Monthly & Seasonal Forecasts now on ClimateData.ca: Learn what’s new, Explore the map.

Agriculture and Future Climate

Welcome to the Agriculture sector information page. Learn how climate change impacts this sector, explore how climate information can be used in decision-making through case study examples, quickly access relevant climate data, and discover other resources to support adaptation planning.

Canadian agriculture has always contended with climate variability and a changing climate may bring new or heightened challenges, including moisture extremes and the introduction of new pests in addition to opportunities to introduce crops with higher heat requirements under a longer, warmer growing season. The agriculture sector module on ClimateData.ca provides an overview of several key climate change impacts for agriculture through case studies and access to climate datasets. This page provides background information on how climate change may affect Canadian agriculture and highlights key information that can be found in the module.

Climate Change and Agriculture

Canada’s agriculture and agri-food sector accounted for roughly 12.5% of total employment in 20161. A changing climate has direct implications for the agricultural sector, including extreme weather events, changing crop suitability, pest distribution, and water availability2,3, making it a priority for inclusion on ClimateData.ca. Canada’s agricultural sector is used to working with climate variability and has already implemented adaptation actions to reduce its risk to this variability. Access to climate model data can provide stakeholders in the sector with a better idea of how the climate is expected to change in their region and case studies provide examples of additional impacts and the use of climate data to better understand changing risks. The information available on ClimateData.ca is intended to inform adaptation by informing decision making, program priorities and investment decisions taken to manage additional risks of climate change.

The ClimateData.ca agriculture sector module was developed with input from a variety of stakeholders in Canada’s agricultural sector through a survey as well as engagements with experts and stakeholders. The module is currently targeted towards anyone in the agricultural sector and can inform long-term adaptation and risk management decisions.

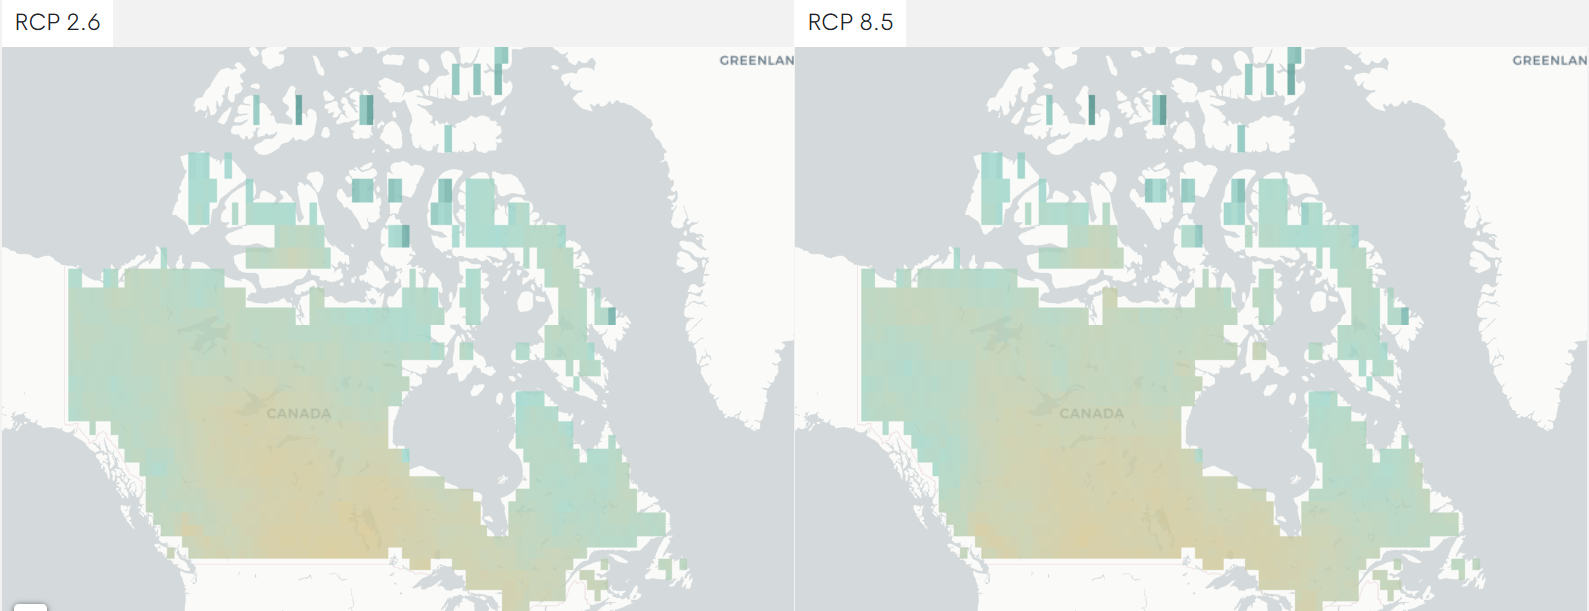
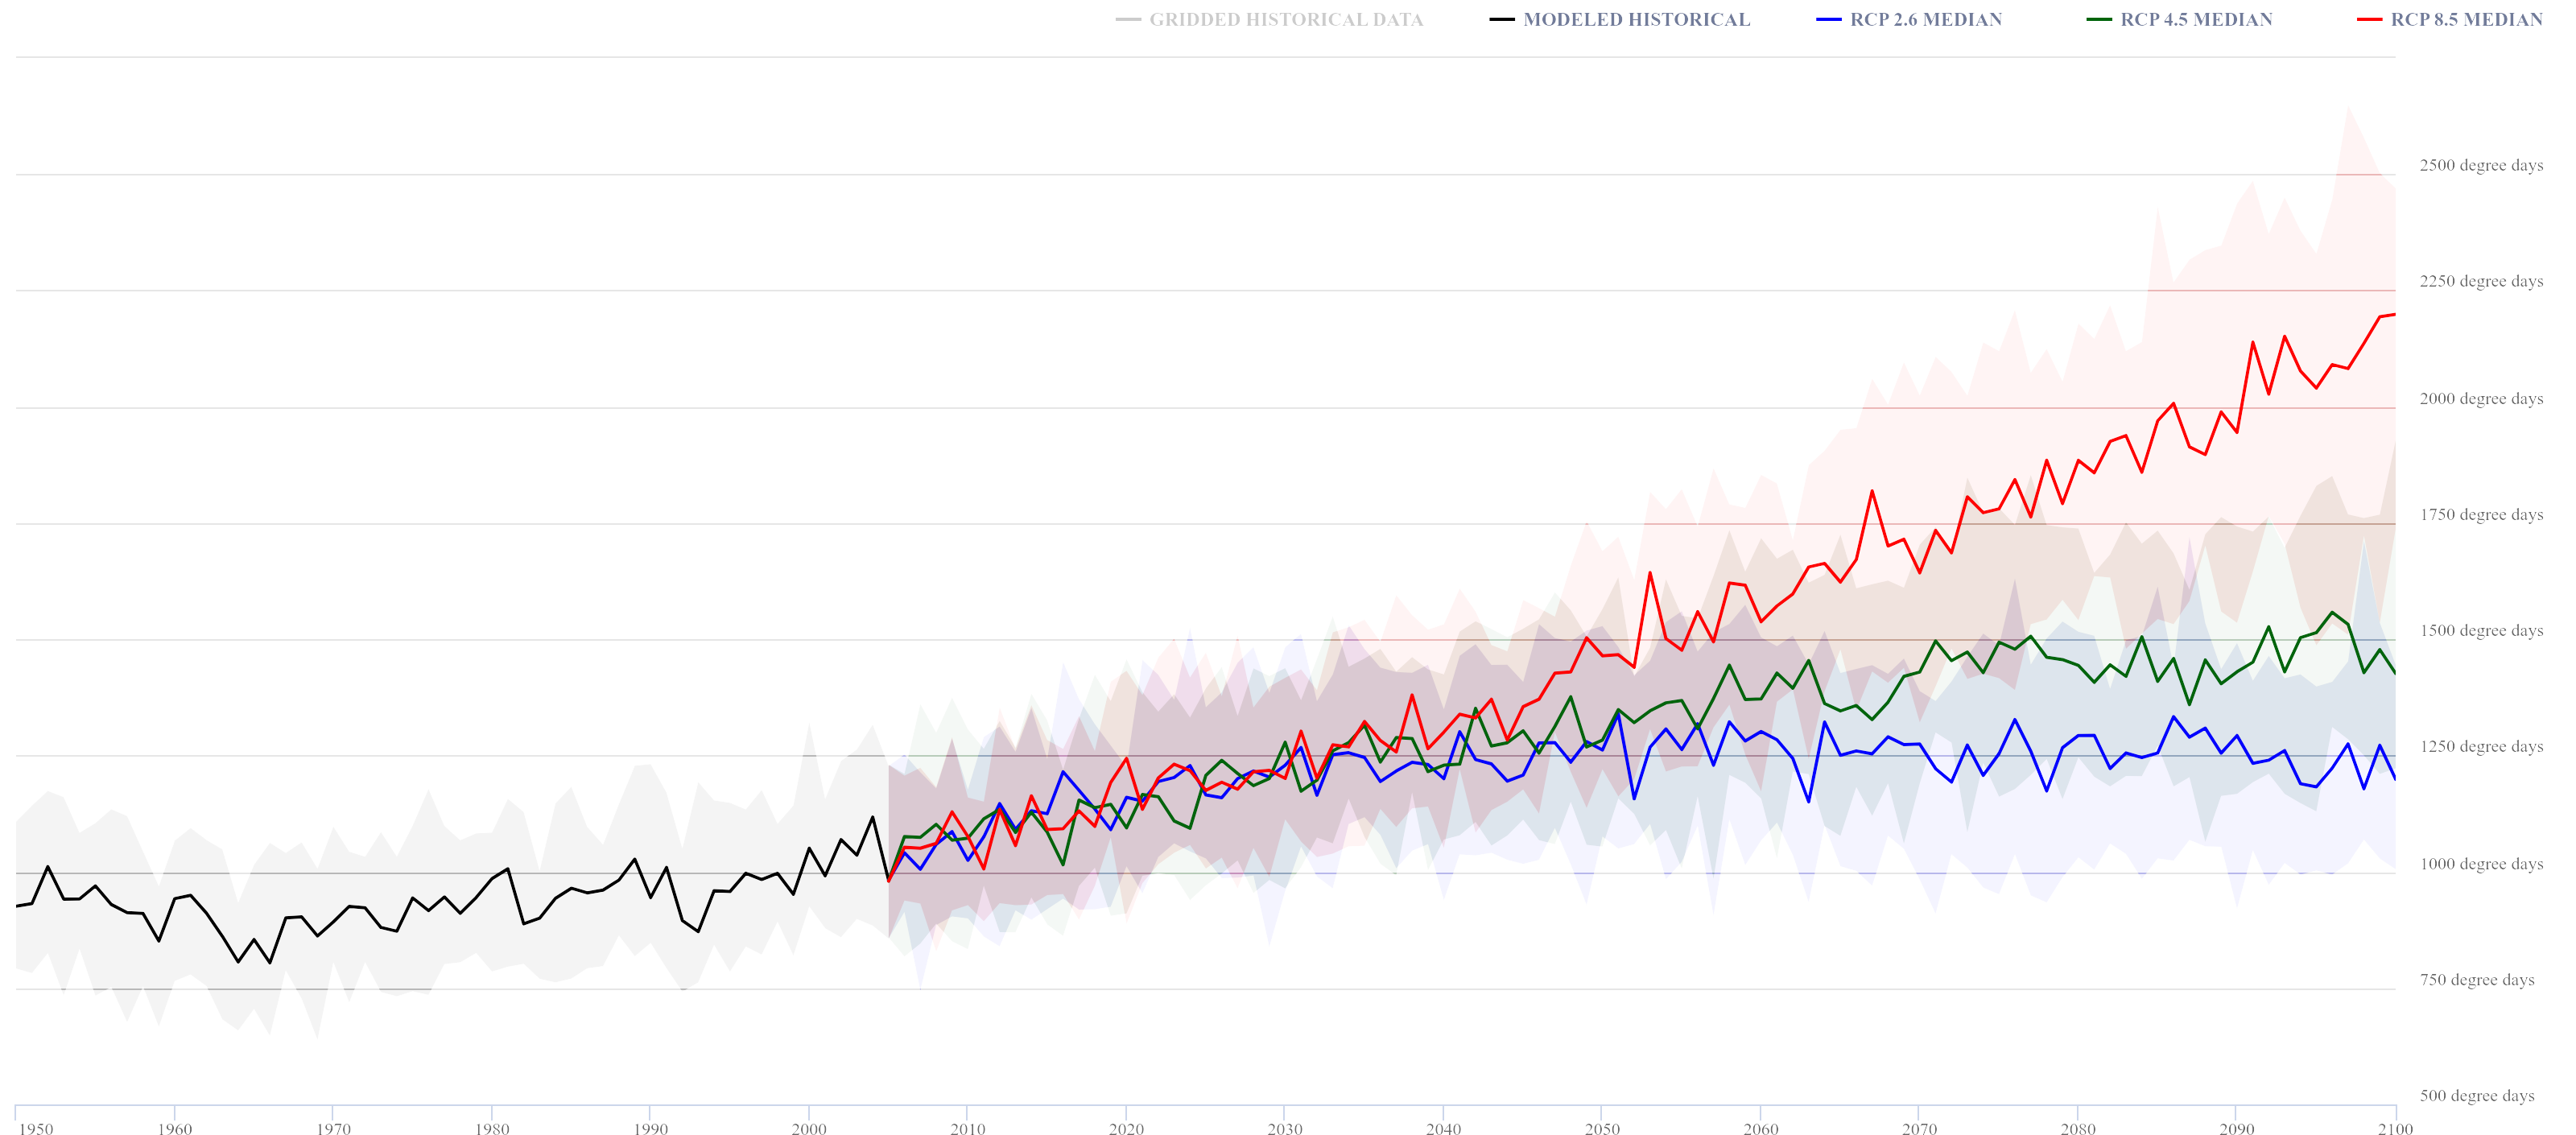
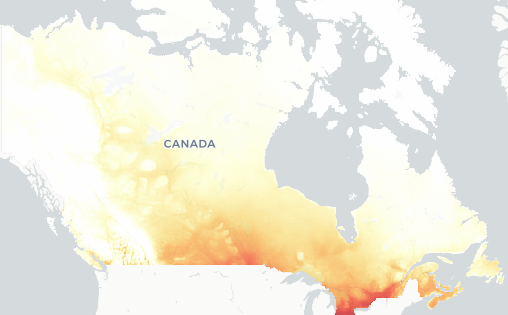
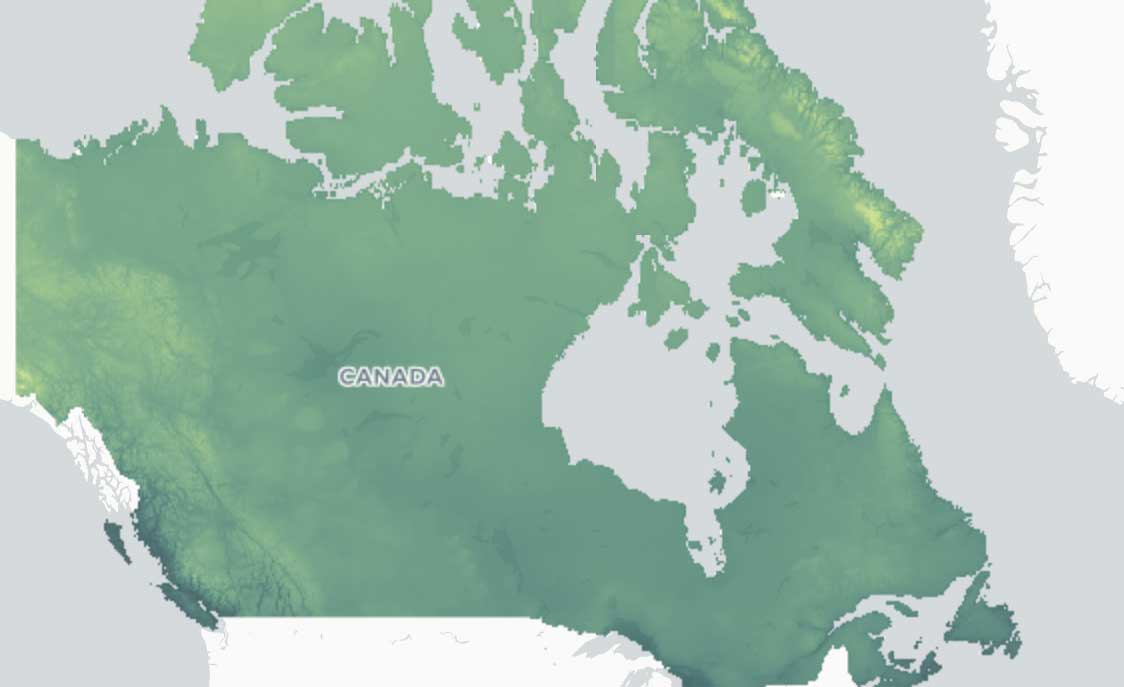
While module content focuses primarily on Canadian impacts, the global nature of climate change means that impacts around the world will likely have indirect effects on Canadian agriculture through changes in global supply chains and trade3,4. ClimateData.ca provides data from an ensemble of 24 global climate models which have been downscaled and bias adjusted using the ANUSPLIN-derived gridded historical dataset. Consequently, only maximum and minimum temperature and precipitation, and several climate indices based on these three variables, are currently available. Survey results indicated that wind, soil moisture and snow cover information is also required by stakeholders; unfortunately, it is not currently possible to provide these variables on ClimateData.ca. The Learning Zone section of ClimateData.ca provides further information on historical datasets, using climate data for decision making, and climate projection ranges.

Many agricultural decisions, particularly at the farm level, are made on shorter time scales than the 30-year horizons. Seasonal weather forecasts can be accessed through the Canadian Climate Data and Scenarios website. The Canadian Drought Monitor provides a variety of information on current and historical drought conditions across Canada. AgWeather Quebec  provides weather information (real-time data, forecasts, agroclimatic indices, models) that is tailored to the agricultural sector for Québec.

Moisture Extremes

Changes in the frequency and severity of extreme weather events, including windstorms, floods, and drought, are likely to be the most challenging impacts for the agricultural sector3,5. The stakeholder survey indicated that extreme or unpredictable weather was the key current impact of climate variability on stakeholders’ work.Heavy rainfalls can make it difficult for farmers to access fields, pose drainage challenges, and reduce yields. A warmer climate and associated increased moisture holding capacity of the atmosphere is expected to result in increased extreme precipitation6. ClimateData.ca provides data for several relevant indices for assessing changes in excess moisture, including maximum 1-day precipitation and wet days above several tlefhresholds (1 mm, 10 mm, and 20 mm). Wet days above custom thresholds can also be determined using the Download page. Drought is another significant hazard for agriculture which can be extremely challenging to adapt to, producing crop failures and water scarcity affecting livestock and other uses. Therefore, the agricultural module development included the addition of the Standardized Precipitation Evapotranspiration Index (SPEI) at the 3-month and 12-month time periods.

The SPEI provides an indication of the moisture balance (precipitation minus potential evapotranspiration), by combining projected changes in temperature and precipitation to give an indication of future drought risk. The agriculture sector module also includes a Drought and Agriculture case study focused on drought on the Prairies.

Length of the Growing Season

A variety of climatic and non-climatic factors determine what shape agriculture takes in a given region7. An important climatic consideration is the length of the available growing season. As part of module development, indices for the last spring and first fall frost dates and total length of the frost-free season were added. The last spring frost index on ClimateData.ca indicates the first date with minimum temperatures greater than 0°C (before July 15) and the first fall frost indicates the first date where minimum temperatures fall below 0°C (after July 15). The frost-free season is computed as the number of days between these two dates and provides an approximate indication of the length of the available growing season. The total length of the growing season is projected to increase, consistent with anticipated warming.

Frost free season

The length of the growing season is one of several other factors associated with climate change that affect average crop and forage suitability, including higher temperatures, increased CO2 concentrations, available heat units, water availability, extreme weather events, and, in coastal regions, sea level rise2,3. The confluence of these factors on Canadian agriculture is challenging to predict, although the Risk Management in the Grape and Wine Industry case study illustrates how multiple climatic and non-climatic considerations can be considered to manage and better understand future risk.

Extreme Heat & Heat Units

Increasing mean and extreme temperatures can have a variety of effects on grain and livestock agriculture. Extreme heat above critical thresholds can be detrimental for crop development, particularly during key flowering and seed development stages8. High temperatures or heat waves during summer can also have negative effects for livestock, including heat stress, reduced milk production, and reduced summer weight gain2. ClimateData.ca provides projections for various indices of extreme heat, including maximum annual temperature and the number of days above a variety of maximum temperature threshold values. The projected frequency of several heat wave indices, using custom thresholds can be assessed using the Download page.

Warmer conditions throughout Canada also affect the available heat units for crop development. Growing Degree Days (GDD) describe the amount of heat available for crop growth by accumulating degree days when daily mean temperatures exceed a given threshold. Different crops have different heat requirements (further discussed in the Risk Management in the Grape and Wine Industry case study) and so projections of GDD using threshold temperatures of 5°C and 10°C are available on ClimateData.ca. The Download page permits the calculation of GDDs using different threshold temperatures.

Growing Degree Days (10°C)

Available heat units also affect the distribution of pests, weeds, and diseases, with warmer conditions possibly permitting increased overwintering, potential for the development of multiple generations in a year, and range expansion. This is further discussed in the Crop Pests and Climate Change case study. The threshold for survival varies by crop and pest, so to provide additional flexibility in analyzing future projections, the analysis tool on ClimateData.ca includes a custom Degree Days Above a Threshold tool on the Analyze page.


  1. Agriculture and Agri-Food Canada. (2025): An Overview of the Canadian Agriculture and Agri-Food System. Online: https://agriculture.canada.ca/en/sector/overview
  2. Warren, F.J. (2004): Agriculture. In: Lemmen, D.S. and Warren, F.J. (Editors). Climate Change Impacts and Adaptation: A Canadian Perspective. Natural Resources Canada: Ottawa, Ontario. 51-70 p. ISBN: 0-662-33123-0
  3. Kulshreshtha, S. (2019): Resiliency of Prairie Agriculture to Climate Change. In: Climate Change and Agriculture. DOI: 10.5772/intechopen.87098
  4. Dellink, R., Hyunjeong, H., Lanzi, E., & Chateau, J. (2017): International trade consequences of climate change. OECD Trade and Environment Working Papers, 2017/01, OECD Publishing, Paris. DOI: 10.1787/9f446180-en
  5. Sauchyn, D., Davidson, D., & Johnston, M. (2020): Prairie Provinces; Chapter 4. In: Warren, F.J., Lulham, N. and Lemmen, D.S. (Editors). Canada in a Changing Climate: Regional Perspectives Report. Government of Canada, Ottawa, Ontario. Online: https://changingclimate.ca/regional-perspectives/chapter/4-0/
  6. Cannon, A.J., Jeong, D.I., Zhang, X., & Zwiers, F.W. (2020): Climate-resilient buildings and core public infrastructure 2020: an assessment of the impact of climate change on climatic design data in Canada. Prepared for: Environment and Climate Change Canada. http://publications.gc.ca/collections/collection_2021/eccc/En4-415-2020-eng.pdf
  7. Bradshaw, B., Dolan, H., & Smit, B. (2004): Farm-level adaptation to climatic variability and change: Crop diversification in the Canadian Prairies. Climatic Change, 67: 119-141. DOI: 10.1007/s10584-004-0710-z
  8. Qian, B., Jing, Q., Bélanger, G., Shang, J., Huffman, T., Liu, J., & Hoogenboom, G. (2018): Simulated canola yield responses to climate change and adaptation in Canada. Biometry, Modeling & Statistics, 110, 133–146. https://doi.org/10.2134/agronj2017.02.0076

Blog posts

Get Climate Smart: resources for the agricultural sector

July 27 2023
Silvie Harder, Amanda Lagace, Ryan Smith, and Teah Lizee, Canadian Centre for Climate Services

Sector Resources

Learning Zone

Explore the wide range of information available to better understand and use climate data.

Download

Download available climate data, choose download options to refine your data choice, or use your own settings to obtain location-specific climate indices.

Census Subdivisions

Climate data can be obtained by census subdivision through the Variable page.

Stakeholder Engagement Methods

A bilingual survey and targeted outreach and engagement with the agricultural sector was undertaken to inform development of agriculture-focused climate indices, case studies, and data formats for ClimateData.ca. This page provides an overview of the process of audience definition and priorities for climate information of those consulted through this process.

Related Content

The Canadian Drought Monitor

The Canadian Drought Monitor provides a variety of information on current and historical drought conditions across Canada.

AgWeather Quebec

AgWeather Quebec provides weather information (real-time data, forecasts, agroclimatic indices, models) that is tailored to the agricultural sector for Québec.

Map of Adaptation Actions

Explore the Map of Adaptation Actions to discover additional examples of adaptation case studies. Use the filter options to go directly to case studies relevant to this sector.

Climate Atlas of Canada

Visit the Climate Atlas’s Topics to learn more about how Canada will be impacted by climate change, and what we can do to manage risks and build resilience.

Seasonal Forecasts

Looking for climate information for the more immediate future? Seasonal forecasts are coming to ClimateData.ca soon, but for the moment you can access short-term forecasts from Environment and Climate Change Canada.

Related Variables

Explore variables which are relevant to this sector.

Days above Tmax

High temperatures, particularly when sustained for several days, can be detrimental to crops, particularly during flowering and seed development, resulting in reduced yields. Heat stress in animals can lead to reduced milk production and reduced summer weight gain in livestock.

View the variable

First fall frost

The first fall frost generally indicates the end of growing season, particularly for tender plants.

View the variable

Maximum 1-Day Total Precipitation

High single day precipitation amounts can impact many agricultural processes. They can damage crops and cause flooding, restrict access to land and hamper seeding and harvest operations.

View the variable

Standardized precipitation evapotranspiration index (12-months)

Longer-term drought can lead to reductions in crop yield, or complete crop failure. Lack of water can reduce grazing for livestock and require farmers to supplement feed, which impacts farmers’ livelihoods.

View the variable

Growing Degree Days (5°C)

Growing degree days indicate the amount of heat required for plants (and pests) to develop and reach maturity. 5°C is a threshold relevant for cooler-season agricultural crops.

View the variable