What do seasonal forecasts look like on ClimateData.ca?
The seasonal forecasts on ClimateData.ca are presented as a single map showing the most probable outcome (e.g., above, near, or below normal conditions) for each location. Probabilities for all outcomes are provided with the forecast. A reanalysis dataset including past observations of the climate between 1991 and 2020 (called the historical climatology) is used to define what are considered normal conditions for each location.
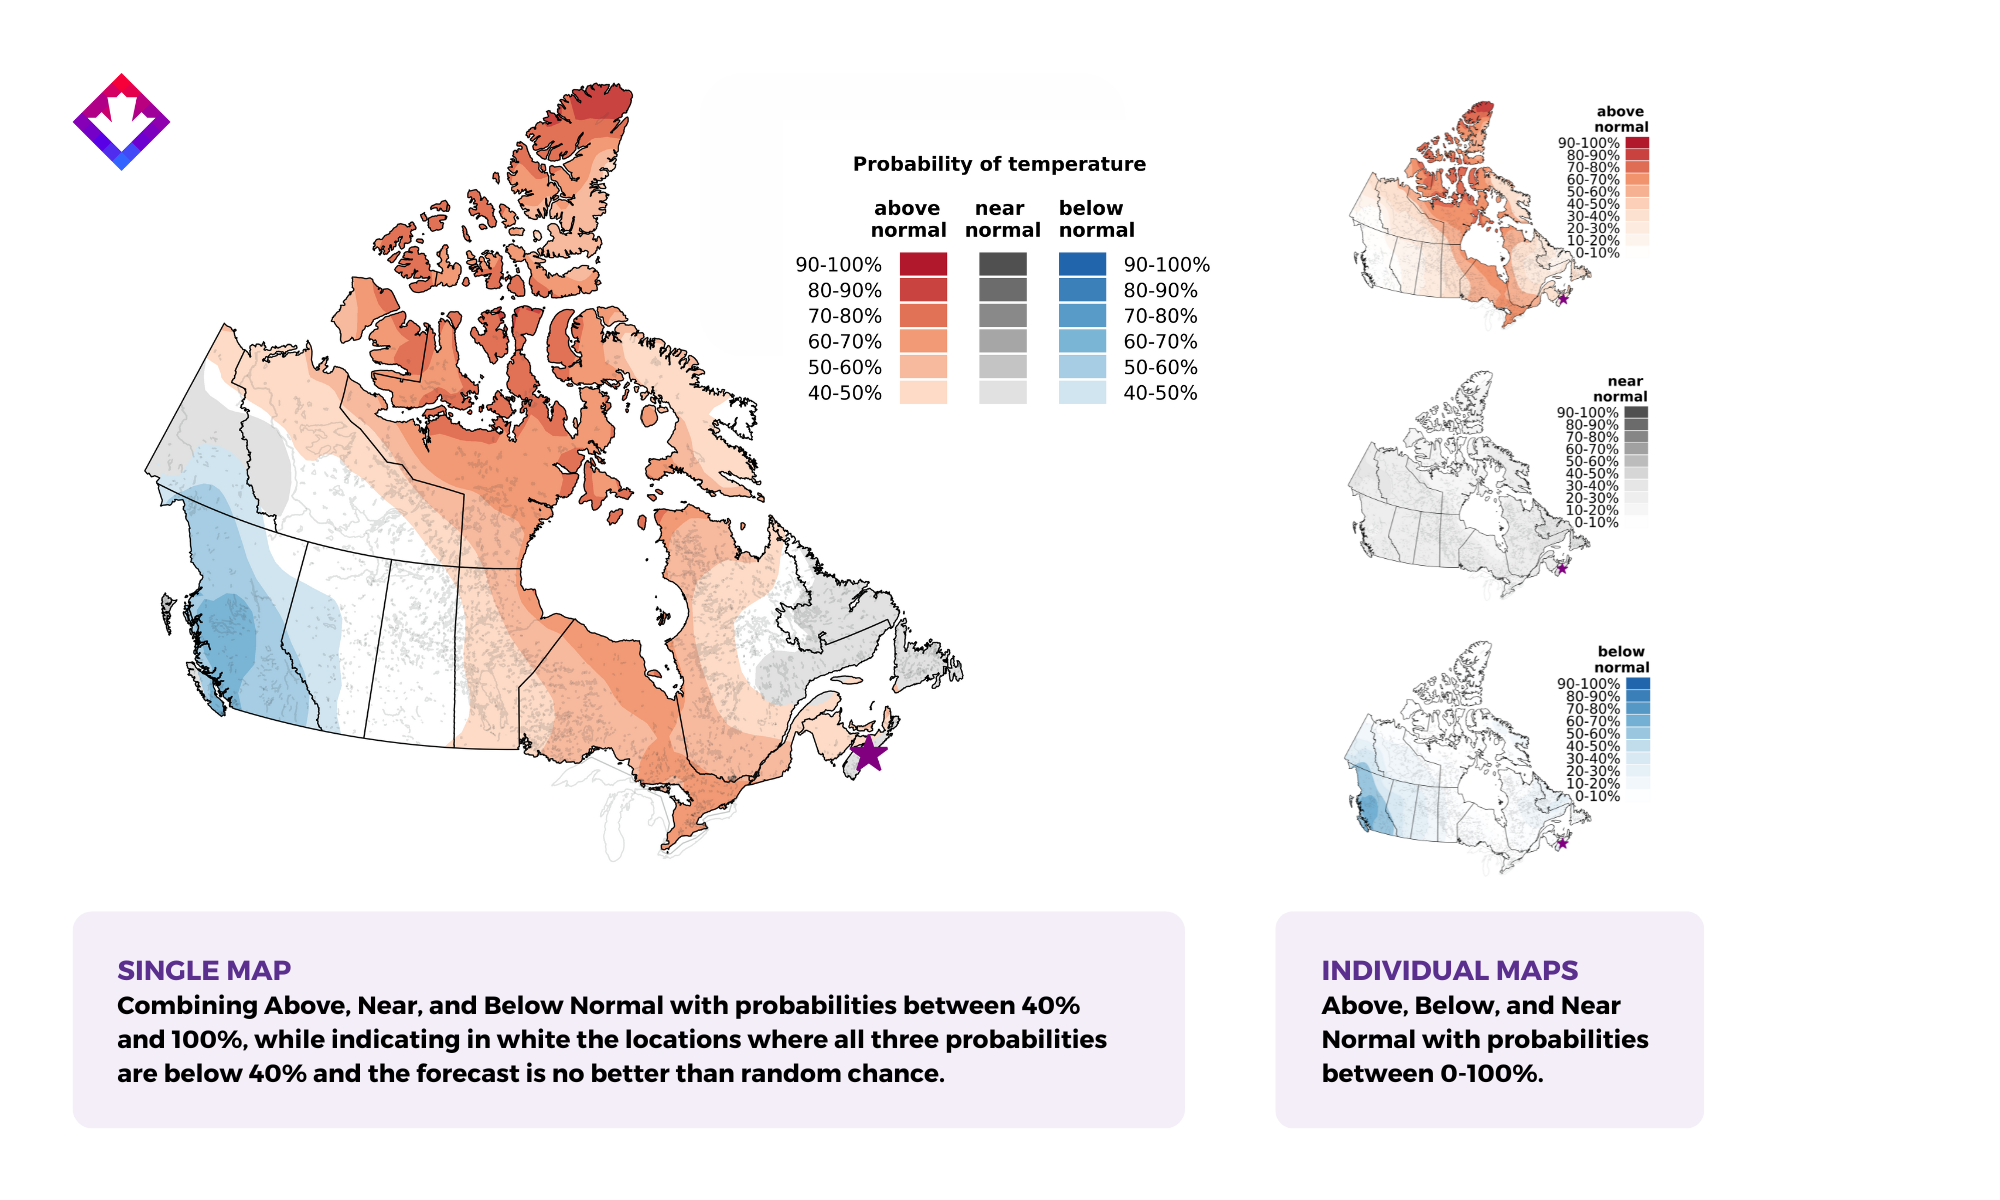
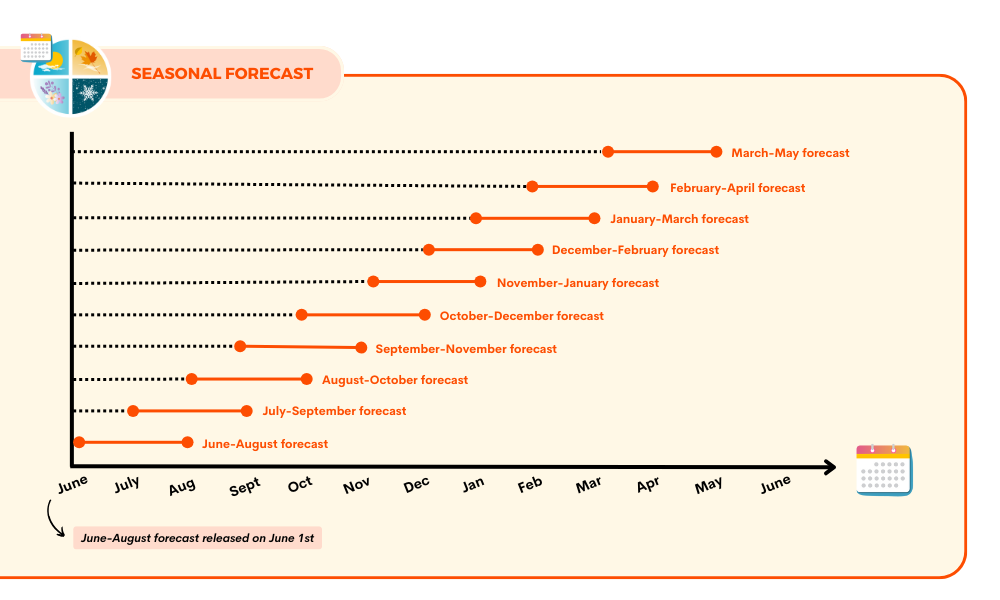
Figure 3 shows an example of how probabilistic forecast maps are developed. This forecast was released on February 1st, 2025, and shows that between February and April 2025, the area around Halifax was forecast to have a 30% probability of above-normal temperatures, a 41% probability of near-normal temperatures, and a 29% probability of below-normal temperatures.
Seasonal forecasts commonly present probabilities for above, near, and below normal outcomes. However, other probabilistic seasonal forecast products exist. For example, some seasonal forecasts on ClimateData.ca show the probability of unusually high or unusually low conditions (e.g., the probability of unusually high temperatures).
Figure 3: Example of how a probabilistic forecast map of mean temperature is generated (for a forecast released on February 1st, 2025, for the February to April 2025 period). There are three small individual maps on the right that show how probable each outcome is: one map for the probability of above-normal temperatures, one map for the probability of near-normal temperatures, and one map for the probability of below-normal temperatures. Each map shows the probability between 0% and 100% for that specific outcome occurring across Canada. The large map on the left shows the most probable of these three outcomes across Canada. The map is white at locations where every possible outcome has less than a 40% probability of occurring, i.e., no outcome has a better than equal chance of occurring. The larger combined map on the left is available on ClimateData.ca, while the probabilities of each outcome shown in the small maps on the right is provided with the forecast.