Accessing Climate Data using PAVICS

Date July 3, 2026
Author Michael Morris and Carrington Pomeroy, CCCS
Topics Get Climate Smart
Share this post

Introduction


ClimateData.ca offers several convenient ways of selecting and downloading Canadian climate data. Users can select variables and climate indices for individual locations or small regions using the Download page. Data can be downloaded in either CSV or netCDF file formats for further analysis.

While these built-in tools meet most needs, some users may require additional flexibility when accessing climate data. Reasons for this may include a need to:

  • Download more data than the Download page allows, e.g. data for a very large number of grid boxes, such as all of Canada.
  • Calculate custom climate indices, not available from the Download page.
  • Efficiently download many data selections, e.g. many different indices.
  • Incorporate the data into a larger automated workflow.

To meet these more advanced requirements, users can access ClimateData.ca’s underlying datasets directly through PAVICS.

What is PAVICS?


PAVICS stands for Power Analytics and Visualization for Climate Science. It is a web-based data analysis platform maintained by Ouranos, the regional climate service organization for Quebec. Using PAVICS requires some background knowledge of Python, which is one of the most popular programming languages for working with climate data.

PAVICS offers two key services for efficiently accessing and analyzing large datasets available through ClimateData.ca: the Data Analysis Platform and the THREDDS Data Server.

Data Analysis Platform


PAVICS hosts an online data analysis platform, called “JupyterHub”, which allows users to run Jupyter Notebooks to analyze climate data. A Jupyter Notebook is a document that combines computer code and plain-language text descriptions. This makes it easier for someone reading the code to understand what the code does and what can be adjusted. Jupyter Notebooks can be used with several programming languages, but the PAVICS JupyterHub only supports Python.

The added benefits of the PAVICS data analysis platform are that it includes multiple example scripts for visitors to use, the ability to share scripts via “public” folders and the PAVICS team maintains all of the environments and python packages so that users do not have to go through setting it all up themselves. All they need is an account.

Users must first register for a free account with PAVICS before being granted access to the JupyterHub. The purpose of the platform is to support researchers and practitioners in fields related to climate change, so registration requests are subject to approval from Ouranos. Read the terms and conditions for using PAVICS.

Once connected, users can begin working with the available climate data (see next section). Example scripts for subsetting data, calculating climate indices and even visualization (Fig. 1) are all available directly in PAVICS.
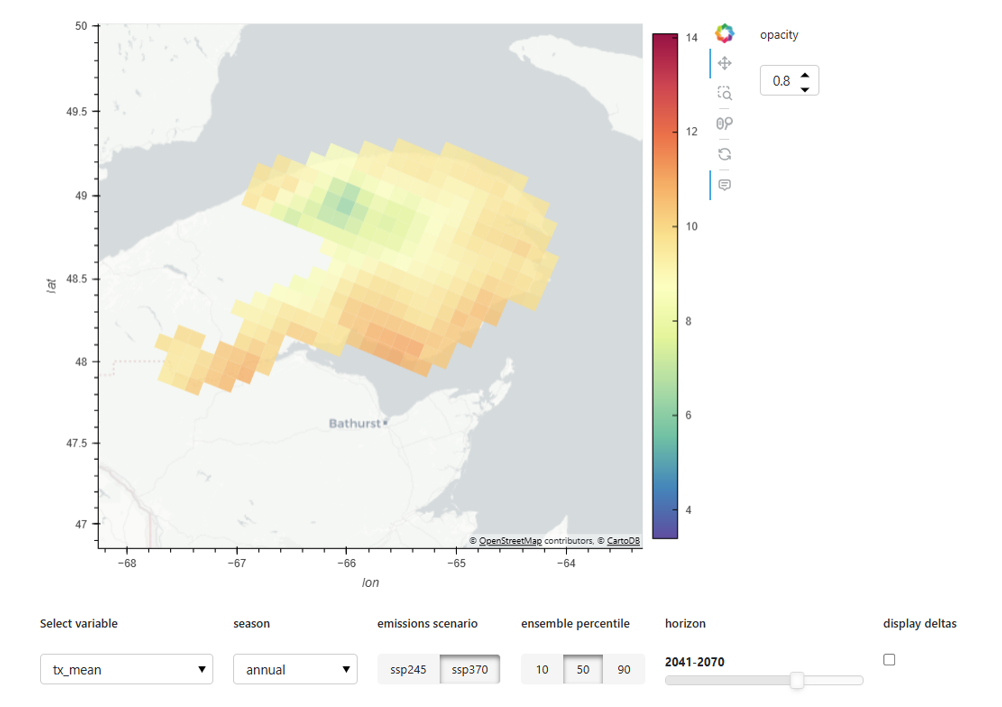
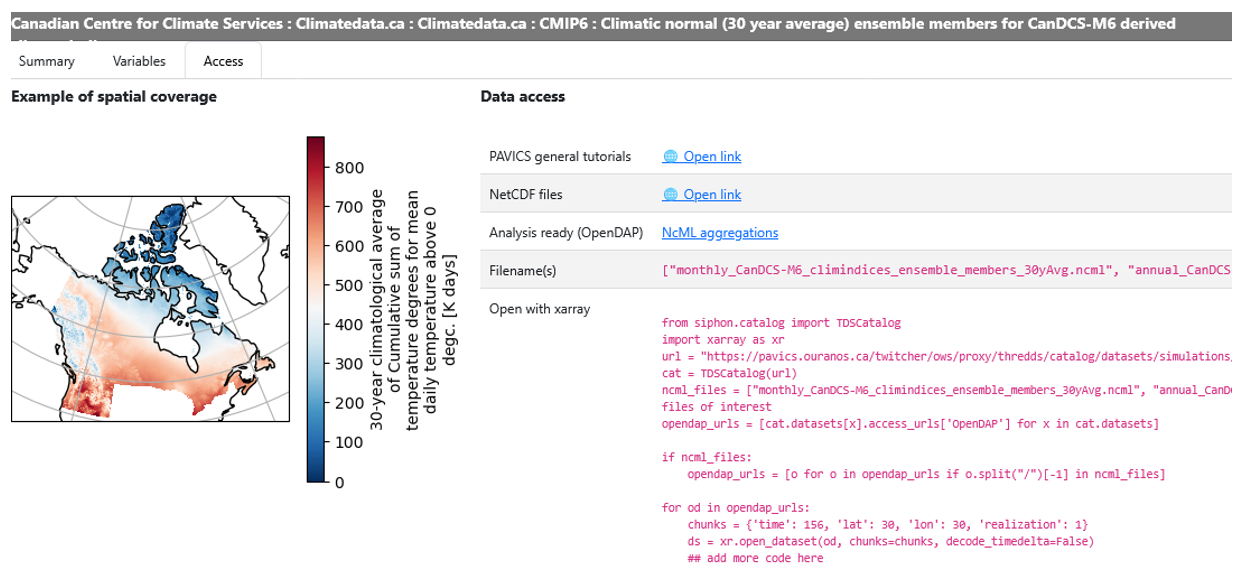
Fig. 1 An interactive dashboard made in one of the PAVICS tutorial scripts

Tutorials


The following PAVICS tutorials illustrate typical next steps after selecting and downloading data from ClimateData.ca (via the Download page) or accessing datasets directly through PAVICS, including subsetting, processing, visualization, and scaling analyses to larger datasets.

THREDDS Data Server


PAVICS hosts a database called THREDDS (Box 1) that provides access to a wide range of climate datasets, including those available on ClimateData.ca.

The PAVICS website includes a page where users can browse the datasets available on the data server. The datasets are sorted by the type of data: climate model simulations, observations, reanalysis, and short-term forecasts. The catalog includes several other datasets in addition to those available from ClimateData.ca. Some of the drop-down menu options are labelled as ClimateData.ca datasets (see Figure 2).

Box 1: What is THREDDS?

THREDDS stands for Thematic Real-time Environmental Distributed Data Services. It is a framework for providing access to climate data via a remote server. The key aspect of THREDDS is the THREDDS Data Server (TDS), which is a web server that includes a web catalog, metadata, and data access. The PAVICS TDS catalog can be explored by clicking through the different directories.

Figure 2: Screenshot of a sample dataset preview from the PAVICS Datasets page. The top four clickable icons list the categories of datasets available from PAVICS. The drop-down menu shows the currently selected dataset, and clicking on it will list all datasets under the selected category. Note that this menu does not include all the datasets available via PAVICS.

You can browse the available datasets through the THREDDS data catalog. There are several ways to find the catalog entry you’re looking for.

If the dataset is listed on the PAVICS Datasets page, you can click on the hyperlink that says “Open link” (see Figure 2). This will take you to the folder of the data server where the dataset is saved. For example, the ‘NetCDF files’ link shown in Figure 1 will take you to the catalog for the 30-year averaged CanDCS-M6 indices.  Alternatively, for those looking to read the data straight into Python, the ‘Analysis ready (OpenDAP)’ link will take you to an aggregated NcML (see Box 2, below) file optimized for this work. Another useful catalog entry available through the “Datasets” folder is the daily CanDCS-M6 data for individual simulations. This data is useful for computing custom climate indices.

Box 2: What is an NcML?

NcML aggregations on a THREDDS server combine multiple data files into a single, seamless virtual dataset, making it much easier for users to programmatically access and analyze multi-file data without needing to download or manually stitch the files together themselves. While NcML aggregations work seamlessly for this purpose, they have also a major limitation for direct HTTP downloads as a direct download only downloads the small, structural NcML text file rather than the actual underlying data. For HTTP download PAVICS users should opt for the “NetCDF files” option.

Most of the gridded historical data and climate model simulations from ClimateData.ca are available through the cccs_portal sub-folder. If the dataset you’re looking for is not listed in the drop-down menus on the “Datasets” page, it is likely located in the Birdhouse folder of the data server.


Summary


ClimateData.ca provides user-friendly clickable interfaces to download a variety of useful climate datasets quickly and easily. Heavy users may require a more efficient way of accessing large quantities of data or custom climate indices, especially when it comes to big datasets like daily gridded data or a large spatial region. The PAVICS THREDDS Data Server allows users familiar with the Python programming language to access their data remotely from their own computers, and work with it as if it were saved on their local file system. The PAVICS JupyterHub is an online tool that facilitates climate data analysis on a remote computer server. By combining the JupyterHub with the THREDDS Data Server, PAVICS users can run Python code to analyze climate data entirely via the web.

For any questions pertaining to the PAVICS platform, please see the community discussion pages or contact [email protected].