Last update: August 2026
NOTE: The information on this page is neither prescriptive nor exhaustive. Content is updated periodically as more information becomes accessible. Readers are encouraged to consider complementary information.
Explore climate indicators and data resources relevant to sea level change, storm surge, coastal flooding, and sea ice in Canada.
Climate Hazards
Article
15 minutes
Last update: August 2026
NOTE: The information on this page is neither prescriptive nor exhaustive. Content is updated periodically as more information becomes accessible. Readers are encouraged to consider complementary information.
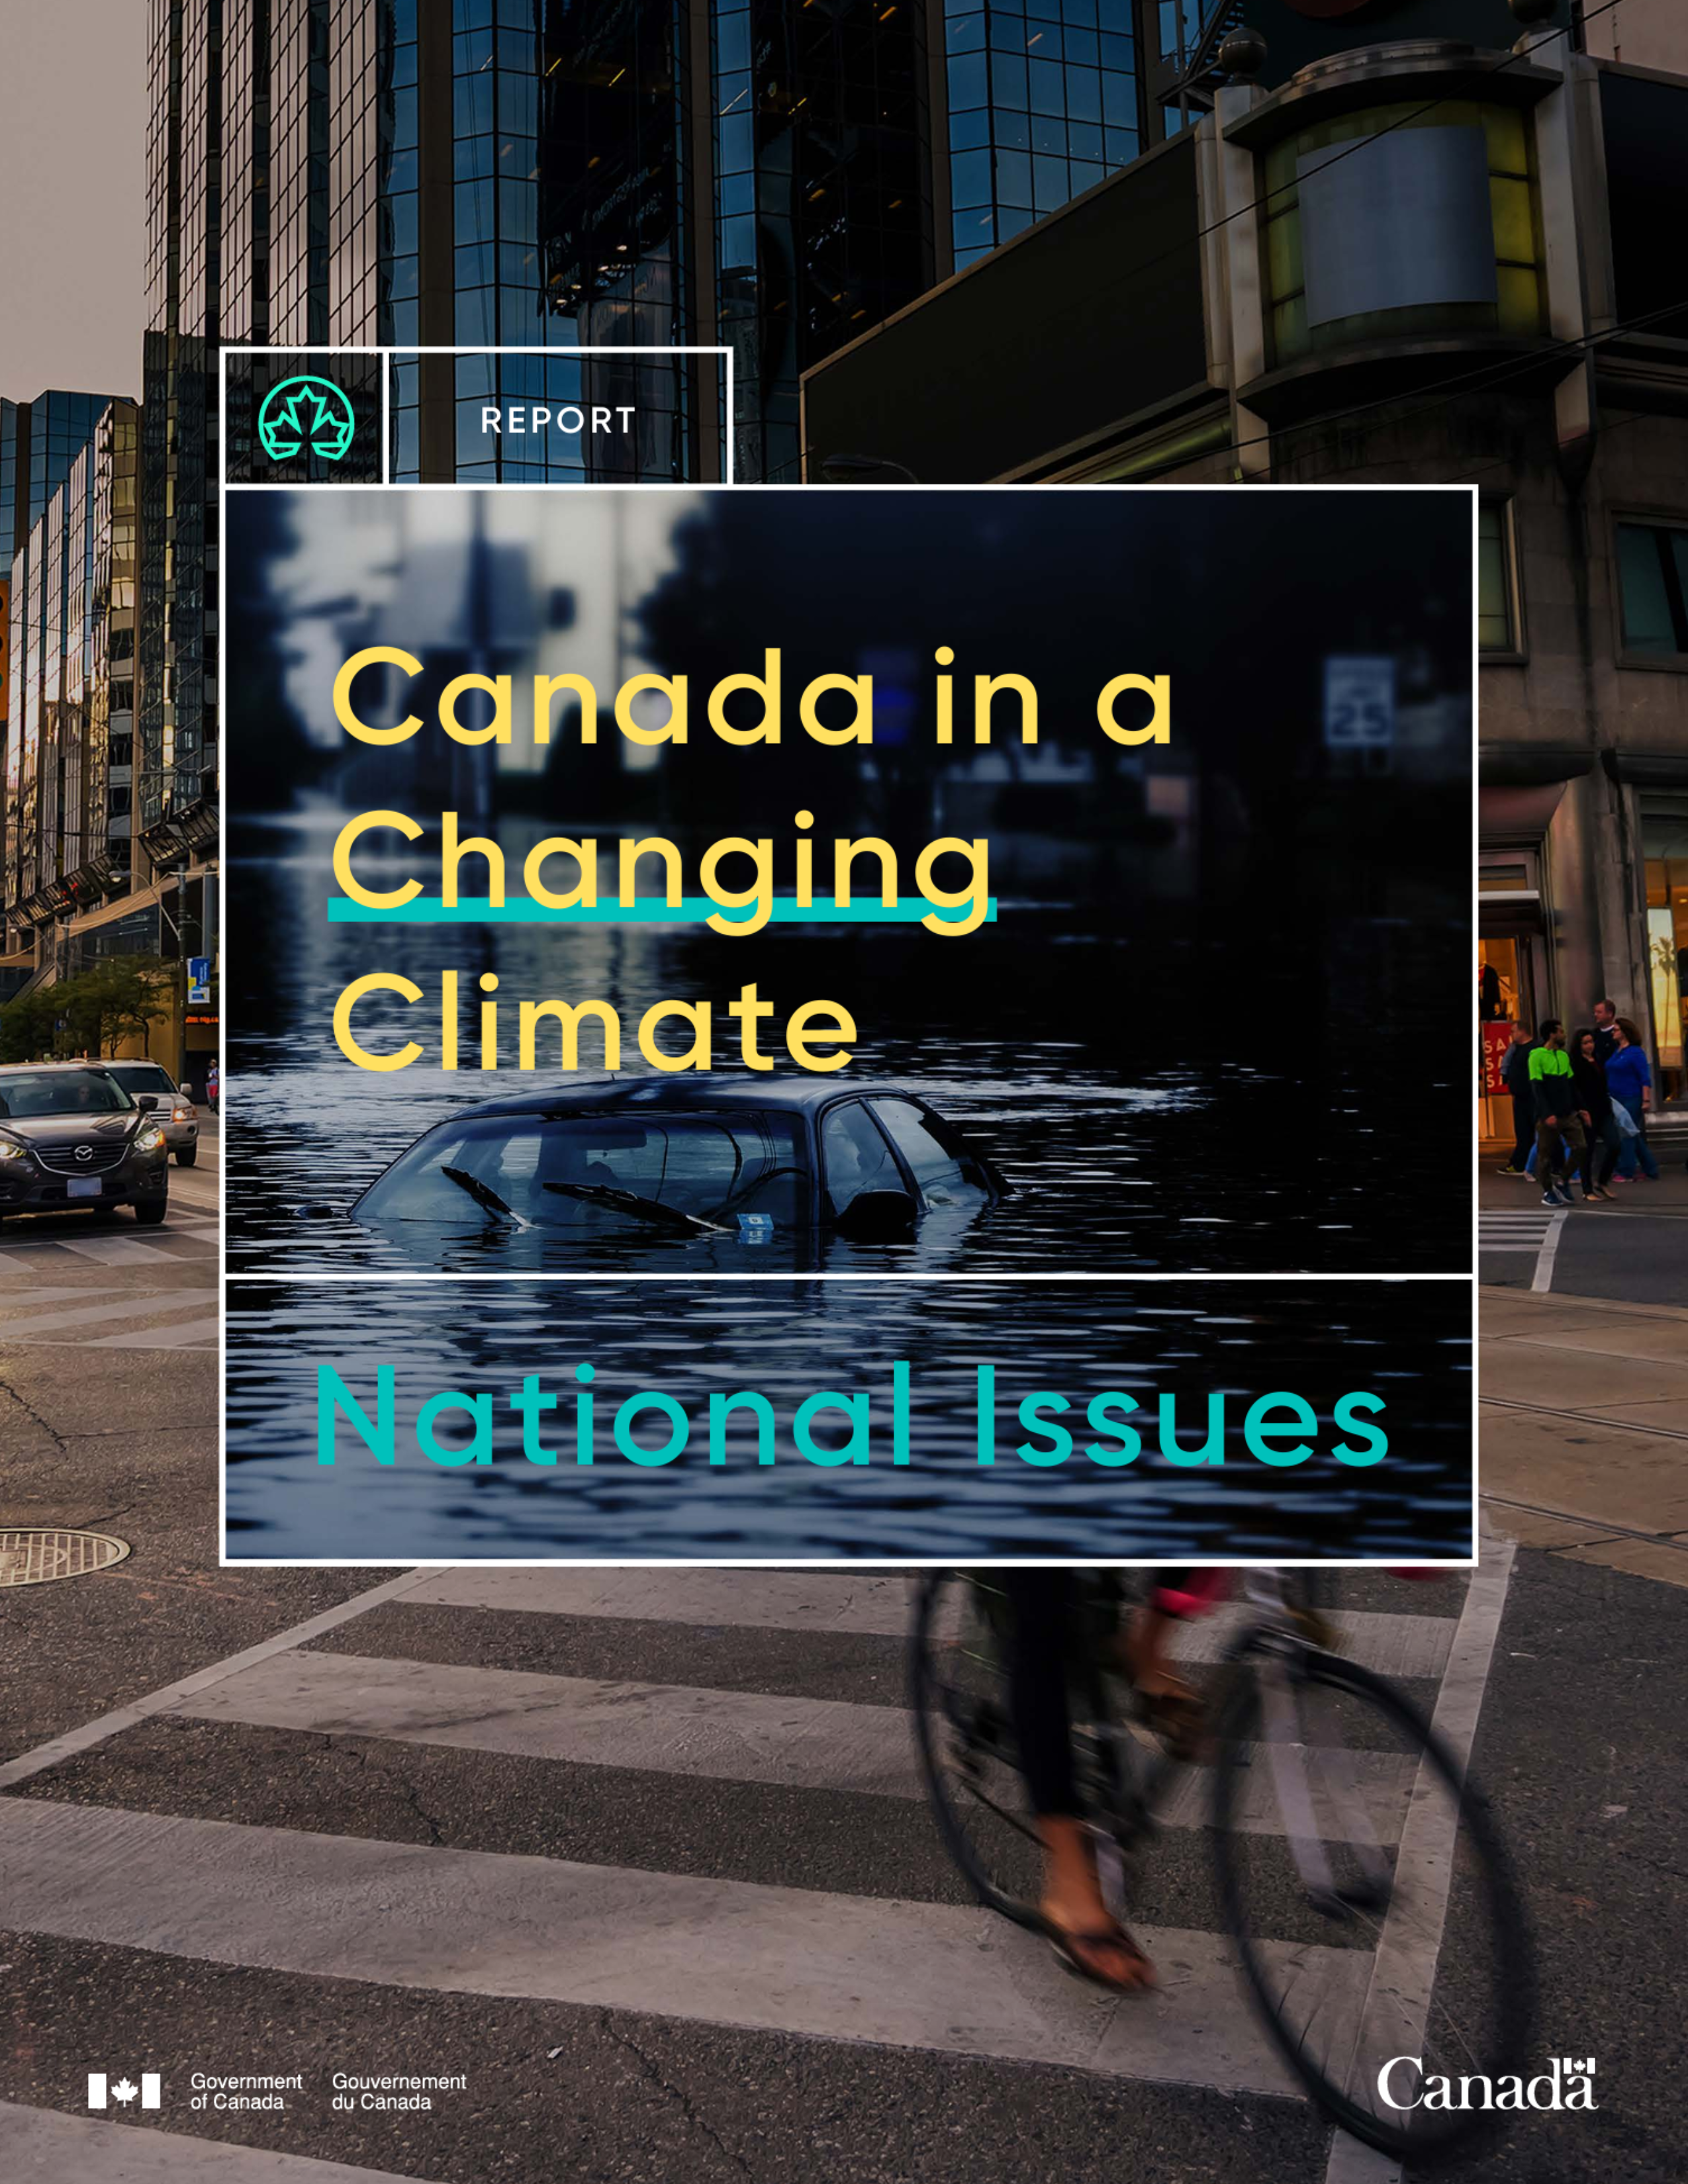
Coastal flooding is a compound event, meaning that multiple climate conditions contribute to its occurrence, such as rising sea levels, extreme precipitation, storm surges, and extreme waves.
This table connects a climate-related hazard with readily available and relevant climate variables and indicators. Knowledge of regional characteristics is key for interpreting and using climate information in local planning. Where possible, project context, local knowledge, traditional knowledge, and/or additional assessments or studies can inform indicator selection and interpretation, to support the link from data to decision-making. Visit the Climate Hazards module to see the full list of hazard tables available, and to view the methodology and inclusion criteria for the tables.
| Future changes | Relevant climate variables and indicators | Climate Data Sources* |
|---|---|---|
| Rising relative sea level at most locations, and falling sea level at other locations, with the amount and direction depending on local vertical land motion. | Relative sea level change (RSLC): Mean sea-level change experienced at the coast, including vertical land motion. | National
Regional
|
| Mean sea level rise | National
| |
| Increasing wave heights and storm surges in regions experiencing sea ice loss (primarily the Arctic). | Wave height: Relative change in mean wave height (typically in percent). | National
Regional
|
| Storm surge: The positive or negative difference in sea level from the predicted tide, due primarily to changes in air pressure and winds. | Regional | |
| Larger and more frequent extreme sea-level events, primarily driven by increases in relative sea level. | Extreme sea level: Combination of mean sea level interacting with short-term phenomena, such as storm surges, tides, and waves. | National
Regional
|
| Changing vertical allowance, varying by region. | Vertical allowance: Height to which infrastructure needs to be raised to maintain the current level of flooding risk under a future scenario of a given rise in sea level, dependent on the designed operational lifetime. | National
|
| Higher probability of extreme sea-level events occurring. | Extreme sea-level return periods: The extreme sea-level value associated with a past 1% average annual exceedance probability (AEP) (a 1-in-100-year extreme would have a 1% chance of a location experiencing coastal flooding in a given year). | This indicator is not currently readily accessible via a climate data portal. Seek out peer-reviewed research for information and static figures. |
| Decreasing glacier mass. | Glacier mass: Total glacier mass. | This indicator is not currently readily accessible via a climate data portal. Seek out peer-reviewed research for information and static figures. |
| Thinner sea ice, and more Arctic waters transitioning from perennially ice-covered to seasonally ice-free. | Sea ice thickness (SIT) | There is uncertainty in sea-ice information due to internal variability and some complex sea-ice processes are challenging to model. SIT has additional uncertainty due to limited observational data. Use caution when interpreting this data. National |
| Sea ice concentration (SIC)1 | Sea ice concentration is available through some portals and can be used to understand future changes in Arctic sea ice. Sea ice concentration is a ratio describing the fraction of area covered by ice. Below are climate data portals with sea ice concentration data available. National
International
Ice outlooks describing the general advance or retreat of ice are also available on shorter timescales: National | |
| Shrinking (contracting) Arctic sea ice extent. | Arctic sea ice extent2: Area of grid cells (pixels) that have at least 15% sea ice cover. Arctic sea ice area3: The total area covered by sea ice. | Arctic sea ice extent and Arctic sea ice area are not directly available through climate data portals.
However, sea ice concentration is available through some portals and can be used to understand future changes in Arctic sea ice area and sea ice extent. See data sources listed above for sea ice concentration. |
| Longer ice-free season in seasonally ice-free waters. | Ice-free season: Length of the ice-free season based on number of ice-free days. |
|
* Additional advanced data analytics tools listed on the Climate Hazards page provide more complex data download options, programming environments and specialized software to support bulk downloads, custom data processing, and analysis of large Canada-wide datasets, and include additional data not listed here.
1Sea ice concentration is a ratio describing the area of the water surface covered by ice as a fraction of the whole area. It is also sometimes presented as a percentage.
2Arctic sea ice extent is often calculated as the total area of grid cells that have at least 15% sea ice cover, e.g., in units of area such as km2.
3Arctic sea ice area is the total area covered by sea ice, e.g. in units of area such as km2.
This project was undertaken with the support of: