ClimateData.ca has undergone a major redesign to make it easier than ever to find, understand, and use high-quality climate data. Meet the Updated ClimateData.ca.

Rapid Extreme Weather Event Attribution system: top heat events of 2024

Date January 7, 2025
Author Aaron Tamminga, Climate Research Division, Environment and Climate Change Canada; Rachel Malena-Chan, Ryan O'Connor, and Ryan Smith, Canadian Centre for Climate Services
Topics Climate Data, New and Noteworthy
Share this post

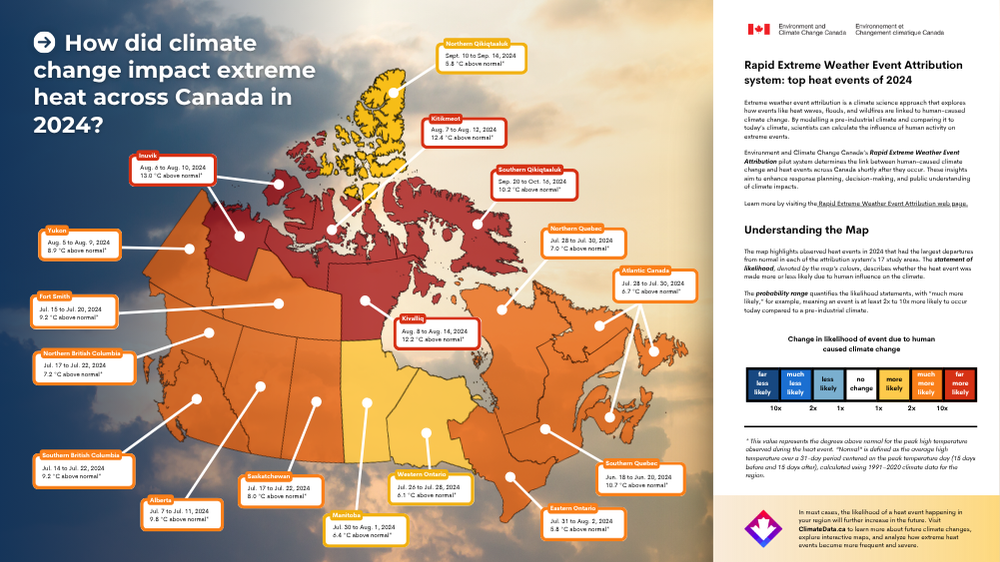
Extreme weather event attribution is a climate science approach that explores how events like heat waves, floods, and wildfires are linked to human-caused climate change. By modelling a pre-industrial climate and comparing it to today’s climate, scientists can calculate the influence of human activity on extreme events. Environment and Climate Change Canada’s Rapid Extreme Weather Event Attribution pilot system determines the link between human-caused climate change and heat events across Canada, shortly after they occur. These insights aim to enhance response planning, decision-making, and public understanding of climate impacts.

The map below highlights observed heat events in 2024 that had the largest departures from normal1 in each of the attribution system’s 17 study areas. The statement of likelihood, denoted by the map’s colours, describes whether the heat event was made more or less likely due to human influence on the climate. The probability range quantifies the likelihood statements, with “much more likely,” for example, meaning an event is at least 2x to 10x more likely to occur today compared to a pre-industrial climate. As the map demonstrates, climate change had an impact on extreme heat events across Canada in 2024.


Click here to download a full-resolution version of this graphic as a PDF

Each extreme heat event is described in more detail in the following table. In addition to a statement of likelihood for the current climate, the table below also contains a statement of likelihood for a modelled, future climate.2

RegionDate of peak temperatureDates of heatwave durationPeak daily high temperature (°C)Degrees above normal daily high temperature (°C)Normal daily high temperature (°C)Current likelihood(compared to 1850–1900 base period)Future likelihood(SSP2-4.5, 2081–2100 compared to 1850–1900 base period)
Inuvik09-AugAugust 6 to August 1026.51313.5Far more likelyFar more likely
Kitikmeot09-AugAugust 7 to August 122512.412.6Far more likelyFar more likely
Kivalliq10-AugAugust 8 to August 1427.112.214.9Far more likelyFar more likely
S. Quebec19-JunJune 18 to June 2029.510.718.8Much more likelyFar more likely
S. Qukiqtaaluk23-SepSeptember 20 to October 168.810.2-1.4Far more likelyFar more likely
Alberta10-JulJuly 7 to July 1131.59.821.7Much more likelyFar more likely
Ft. Smith18-JulJuly 15 to July 2028.49.219.2Much more likelyFar more likely
S. BC21-JulJuly 14 to July 2229.29.220Much more likelyFar more likely
Yukon08-AugAugust 5 to August 924.18.915.2Much more likelyFar more likely
Sask19-JulJuly 17 to July 2230.9822.9Much more likelyMuch more likely
N. BC21-JulJuly 17 to July 2224.27.217Much more likelyFar more likely
N. Quebec28-JulJuly 28 to July 3024.2717.2Much more likelyMuch more likely
Atl. Canada29-JulJuly 28 to July 3126.16.719.4Much more likelyFar more likely
Manitoba30-JulJuly 30 to August 128.36.421.9More likelyMuch more likely
W. Ontario27-JulJuly 26 to July 2827.96.121.8More likelyMuch more likely
N. Qikiqtaaluk12-SepSeptember 10 to September 140.45.8-5.4More likelyMuch more likely
E. Ontario01-AugJuly 31 to August 229.25.823.4Much more likelyMuch more likely

For more information


Visit Environment and Climate Change Canada’s Extreme Weather Event Attribution website to learn more. Visit ClimateData.ca to learn more about future climate changes, explore interactive maps, and analyze how extreme heat events become more frequent and severe under a range of emissions scenarios.

1 Here “normal” is defined as the average high temperature over a 31-day period centered on the peak temperature day (15 days before and 15 days after), calculated using 1991–2020 climate data for the region.

2 Here the “future climate” is calculated using an ensemble of CMIP6 GCMs running the SSP2-4.5 emissions scenario over the 2081-2100 time period.