Tips for managing seasonal forecast uncertainty
Interpreting forecast probabilities
If above-, near-, and below-normal outcomes were equally likely, each would have a 33% chance of occurring; this represents the climatological probability of each outcome. For the forecasts on ClimateData.ca to be considered statistically different from climatological chance, the probability of any one outcome (above-normal, near-normal, or below-normal) must exceed 40%.
An outcome with a probability above 40% indicates that it is more likely to occur than the other outcomes. However, the observed outcome (i.e., the seasonal conditions that actually occur) isn’t always the one with the highest forecasted probability1.
For example, consider a forecast that predicts:
- a 70% probability of above-normal temperatures,
- a 20% probability of near-normal temperatures, and
- a 10% probability of below-normal temperatures.
This forecast can be interpreted as a 70 in 100 chance of experiencing above-normal temperatures, a 20 in 100 chance of near-normal temperatures, and a 10 in 100 chance of below-normal temperatures. In this case, the seasonal prediction system would not be considered “wrong” if a near-normal or below-normal outcome occurred. While these outcomes are less probable, they are not impossible, and are in fact expected to occur some of the time.
This example forecast can be visualized using a wheel spinner, as illustrated in Figure 2 of the What are Seasonal Forecasts? article.
The “success” or “failure” of the seasonal prediction system is never assessed based on the performance of a single probabilistic forecast, because, as noted above, lower probability outcomes are still expected to occur some of the time. Instead, the skill of the seasonal prediction system is calculated using forecasts produced for past seasons between 1991 and 2020.
It is important to consider the skill of the seasonal prediction system when using seasonal forecasts. A performance metric for skill is provided with each forecast on ClimateData.ca. Skill typically improves as the forecast release date gets closer to the season being forecasted. Forecasts are updated each month. Skill can be calculated using many different performance metrics.
On ClimateData.ca, skill for probabilistic forecasts is provided using the Continuous Ranked Probability Skill Score (CRPSS), with a higher CRPSS value indicating higher skill.
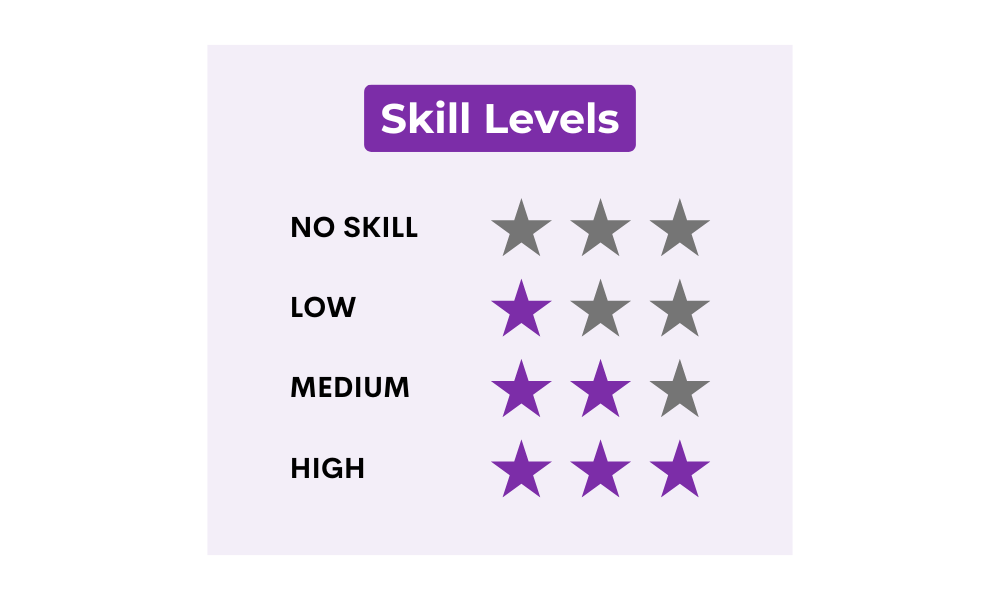
The skill levels on ClimateData.ca are as follows: