Introduction
By looking at past data and comparing it with future climate projections, we can make informed decisions about how to adapt to climate change. The Adjusted and Homogenized Canadian Climate Data (AHCCD) is a useful resource for understanding how the climate has changed in Canada over the years. This article will endeavour to explain what the AHCCD data product is and how it differs from raw weather station data. This article will also explain the importance and uniqueness of the recent addition of the AHCCD data into ClimateData.ca’s Analyze page.
Raw Weather Station Data vs. AHCCD Data
Weather stations collect raw data on various climate variables such as temperature, precipitation, air pressure, wind speed and direction, humidity and snowfall. However, this raw data can be subject to inconsistencies and biases due to factors such as changes in measurement techniques, station relocations, and instrument alterations. These inconsistencies can make it challenging to accurately analyze long-term climate trends. In contrast, AHCCD data has been adjusted account for some these possible inconsistencies.
Temperature data in particular goes through a process known as homogenization. Homogenization is the process of removing biases in the raw data that stem from factors that are not related to actual changes in the variable being measured (see below for an example). Factors that can affect the consistency of a measurement include changes in the location of the monitoring site (to a location nearby), changes in instrumentation, and changes in instrumentation maintenance schedules. Homogenization of long-term data records is often essential because these external factors result in biases in the data that can mask changes in the measurements over time, thus it is important to use homogenized data to look at trends in climate variables.
Here’s one example of homogenization in action:
In 1961, many weather stations in the country shifted their observing time from evening (local standard time) to morning (Coordinated Universal Time), which caused a systematic bias in the raw minimum temperature data. This change in observing time led to an artificial cooling trend in the raw data. The homogenization process applied in the AHCCD dataset corrects for this bias, ensuring a more accurate representation of the actual temperature trends. Read more.
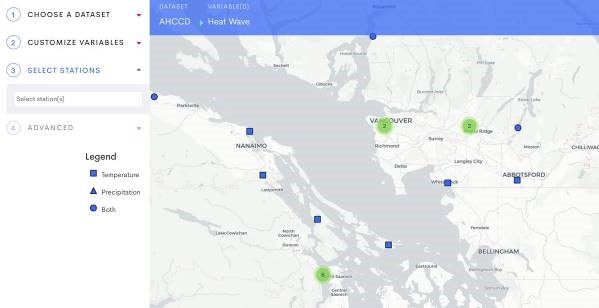
The Analyze Page and Integration of AHCCD Data
ClimateData.ca’s Analyze page is a user-friendly platform that allows individuals to easily access and explore climate data. The integration of AHCCD into the Analyze page enables users to extract custom threshold-based indices (such as the past annual number of days above 32 degrees or the past annual number of freeze-thaw cycles, for example) from the historical station-based AHCCD data, providing insights into past climate trends and variability in Canada.
By incorporating the AHCCD data into the Analyze page, users can now access a wealth of more consistent and robust information on Canada’s past climate. This enables them to better understand the past trends and variability and to make well-informed decisions about climate change mitigation and adaptation strategies.