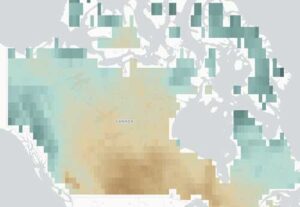
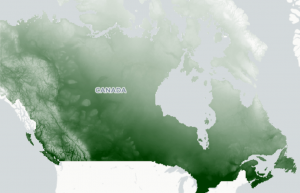
Agriculture

Canadian agriculture has always contended with climate variability and a changing climate may bring new or heightened challenges, including moisture extremes and the introduction of new pests in addition to opportunities to introduce crops with higher heat requirements under a longer, warmer growing season. The agriculture sector module on ClimateData.ca provides an overview of several key climate change impacts for agriculture through case studies and access to climate datasets.

Overview

Changes in crop suitability, pest distributions, and extreme weather events are amongst the key impacts of climate change for the agricultural sector. This page provides an overview of how a changing climate may affect Canadian agriculture alongside relevant information available on ClimateData.ca.

Read further

Case Studies

Drought and Agriculture

Society, the economy and environment depend on a sufficient supply of water within an expected range, which can be seriously threatened by drought. Droughts result from a shortage of precipitation, which may be exacerbated by failing to meet evapotranspiration demand. This case study presents information about historical droughts, possible future …

Risk Management in the Grape and Wine Industry

Climate change presents several opportunities and risks for Canada’s agricultural sector. The success of agriculture from year to year is also reliant on several non-climatic factors, such as global economic markets, supply chains, and institutional support.

Crop Pests and Climate Change

Insect development is generally related to temperature. Consequently, climate change may increase crop damage caused by certain insects by influencing the growth of their populations, by allowing certain species to develop an additional generation or to extend their range, or even by reducing their winter mortality.

Blog Posts

July 27, 2023
Get Climate Smart: resources for the agricultural sector

Silvie Harder, Amanda Lagace, Ryan Smith, and Teah Lizee, Canadian Centre for Climate Services

Topics

Agriculture, Get Climate Smart, Support desk

Read more

Sector Resources

Analyze

For indices not included in the pre-calculated variable list, the Analyze page can be used to create custom indices, such as Growing Degree Days above 14°C.

Census Subdivisions

Climate data can be obtained by census subdivision through the Variable page.

Learning Zone

Further information on using climate data or selecting a relevant historical dataset can be found in the Learning Zone.

Stakeholder Engagement Methods

A bilingual survey and targeted outreach and engagement with the agricultural sector was undertaken to inform development of agriculture-focused climate indices, case studies, and data formats for ClimateData.ca. This page provides an overview of the process of audience definition and priorities for climate information of those consulted through this process.

Related Variables

Explore variables to learn about how data was used to impact climate related decisions in specific contexts.

Days with Tmax > 30°C describes the number of days where the daytime high temperature is warmer than 30°C. This index gives an indication of number of hot days in the selected time period.

High temperatures are important. They determine if plants and animals can thrive, they limit or enable outdoor activities, define how we design our buildings and vehicles, and shape our transportation and energy use. However, when temperatures are very hot, people – especially the elderly – are much more likely to suffer from heat exhaustion and heat stroke. Many outdoor activities become dangerous or impossible in very high temperatures.

Technical description:

The number of days with a maximum temperature (Tmax) greater than 30°C. Use the Variable menu option to view annual, monthly or seasonal values for this index.


The First Fall Frost marks the approximate end of the growing season for frost-sensitive crops and plants. When the lowest temperature of the day is colder than 0°C for one consecutive day (after July 15th) the date of the first fall frost is established.

Technical description:

The first date in the fall (or late summer) on which the daily minimum temperature is less than 0°C (Tmin < 0°C). Because this variable is largely used to assess the end of the growing season in southern Canada, the earliest possible date for a fall frost was set as July 15. Use the Variable menu option to view values for this index on the map.


Maximum 1-Day Total Precipitation describes the largest amount of precipitation (rain and snow combined) that falls within a single 24-hour day for the selected time period. This index is commonly referred to as the wettest day of the year.

Very high 1-day precipitation totals could be the result of intense, but short-lived precipitation events such as thunderstorms, or may be due to precipitation occurring steadily over the course of the day. Short duration, high intensity precipitation events may lead to flash flooding, particularly in urban areas where storm drains may be overwhelmed. Heavy snowfall events can cause damage to buildings and disrupt transportation services.

Technical description:

The largest precipitation total that falls in a single day in the selected time period. Use the Variable menu option to view annual, monthly or seasonal values for this index.


The Standardised Precipitation Evapotranspiration Index (SPEI) is a drought index based on the difference between precipitation (P) and potential evapotranspiration (PET). Negative (positive) values indicate water deficit (surplus).

SPEI-12 describes the SPEI of the month selected from the drop-down menu and the previous 11 months. For example, to look at annual SPEI values, select December from the drop-down menu. The SPEI values displayed will be for December and the previous 11 months (January to November).

Drought can occur on a variety or timescales and impacts will depend on how widespread and how long-lived a drought is. Drought affects water availability, which is of particular importance to agriculture and hydro-electricity production.

Use the Variable menu option to view any 12-month period for this index. Remember to select the final month of your chosen 12-month period in the drop-down menu.


Growing degree days (GDD) are a measure of whether climate conditions are warm enough to support plant and insect growth. When the daily average temperature is warmer than the threshold temperature, growing degree days are accumulated (see Degree Days Above). For forage crops and canola, a threshold temperature of 5°C is generally used.

Technical description:

The number of degree days accumulated above a threshold temperature of 5°C in the selected time period. Use the Variable menu option to view the annual, monthly or seasonal values for this index. Visit the Analyze page to calculate degree days using different threshold temperatures.