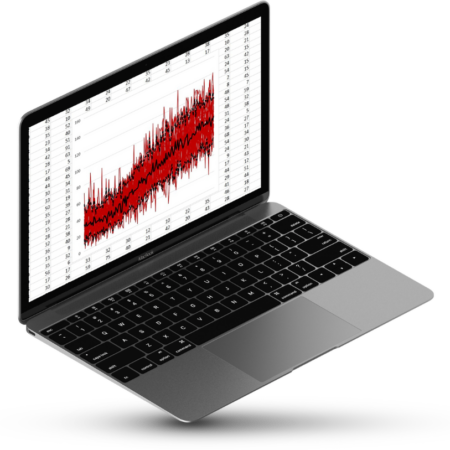
ClimateData.ca has rolled out a major update to its Analyze Page, now featuring individual climate model results. This was one of our users’ top requests. Having access to individual model data allows users to undertake bespoke climate analysis, including:
Flexibility for Advanced Analysis: The availability of individual model outputs enables the calculation of averages over custom timeframes, running means, custom ensembles, and more. Prior to this update, users could only access a limited set of ensemble data from the Analyze page, specifically the 10th, 50th (median) and 90th percentiles.
New ways to visualize change: Having output from all models makes it possible to create custom frequency plots, box and whisker plots, histograms and more, using programs like Microsoft Excel or other data visualization tools. Visualization of individual model results can help analysts appreciate the range of uncertainty introduced by the various assumptions that underpin each model.


