In this series, we take a deep dive into the many climate change maps available on ClimateData.ca. This month, we are focusing on maps showing projected changes in the date of first fall frost—the average calendar date when the first below-zero temperature is recorded. The first fall frost date is an important threshold, as we will discuss below.
Why the date of first fall frost matters
The First Fall Frost marks the approximate end of the growing season for frost-sensitive crops and plants. When the lowest temperature of the day is colder than 0°C for one consecutive day (after July 15th)[1] the date of the first fall frost is established.
Changes in the date of first fall frost imply that the growing season length for various crops will be altered. This shift impacts agricultural planning and crop yields, as farmers rely on predictable weather patterns to schedule planting and harvesting. Earlier frosts can lead to premature crop loss, while later frosts may extend the growing season, allowing for additional crop cycles or the cultivation of varieties that require longer growth periods.
Furthermore, these changes can also affect local ecosystems. Plants and wildlife that depend on seasonal cues for reproduction and migration might be negatively impacted, potentially leading to mismatches in ecological timing. These changes can impact food webs and biodiversity.
Deciphering the Map’s Message
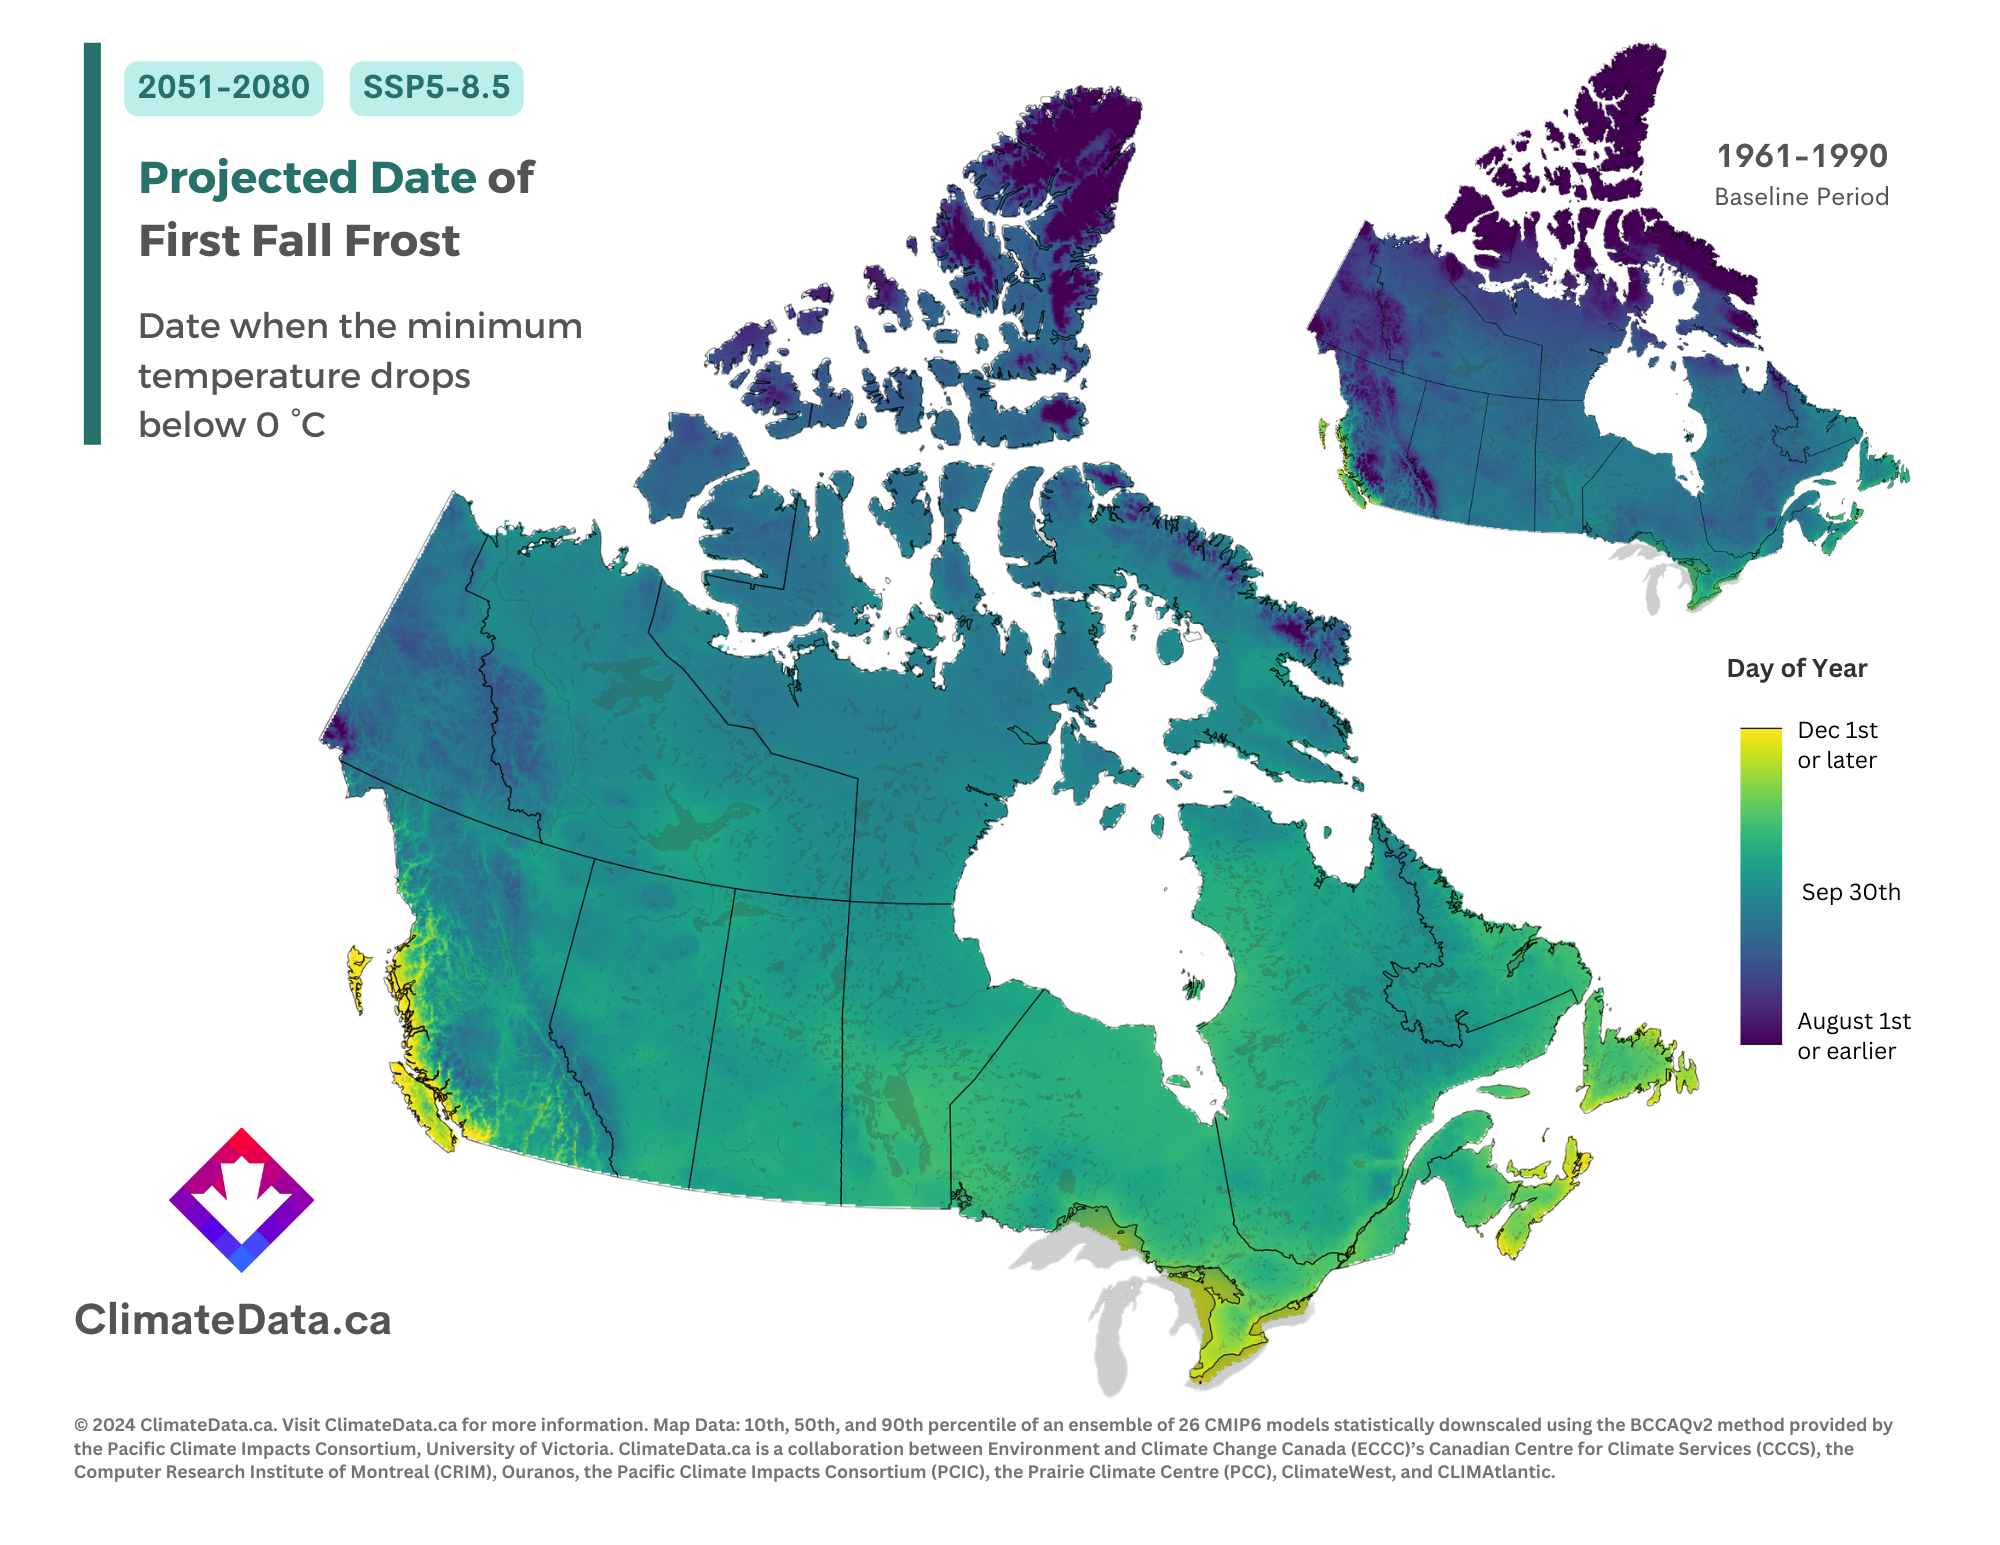
Our first map contrasts two periods: the date of first fall frost under a historical baseline (1961-1990) captured in the inset map, and the projected future (2051-2080) date of first fall frost under the SSP5-8.5 scenario, the scenario resulting in the most warming on ClimateData.ca. To learn more about the importance of using 30-year time periods when examining changes in climate, visit our learning zone article on the subject.
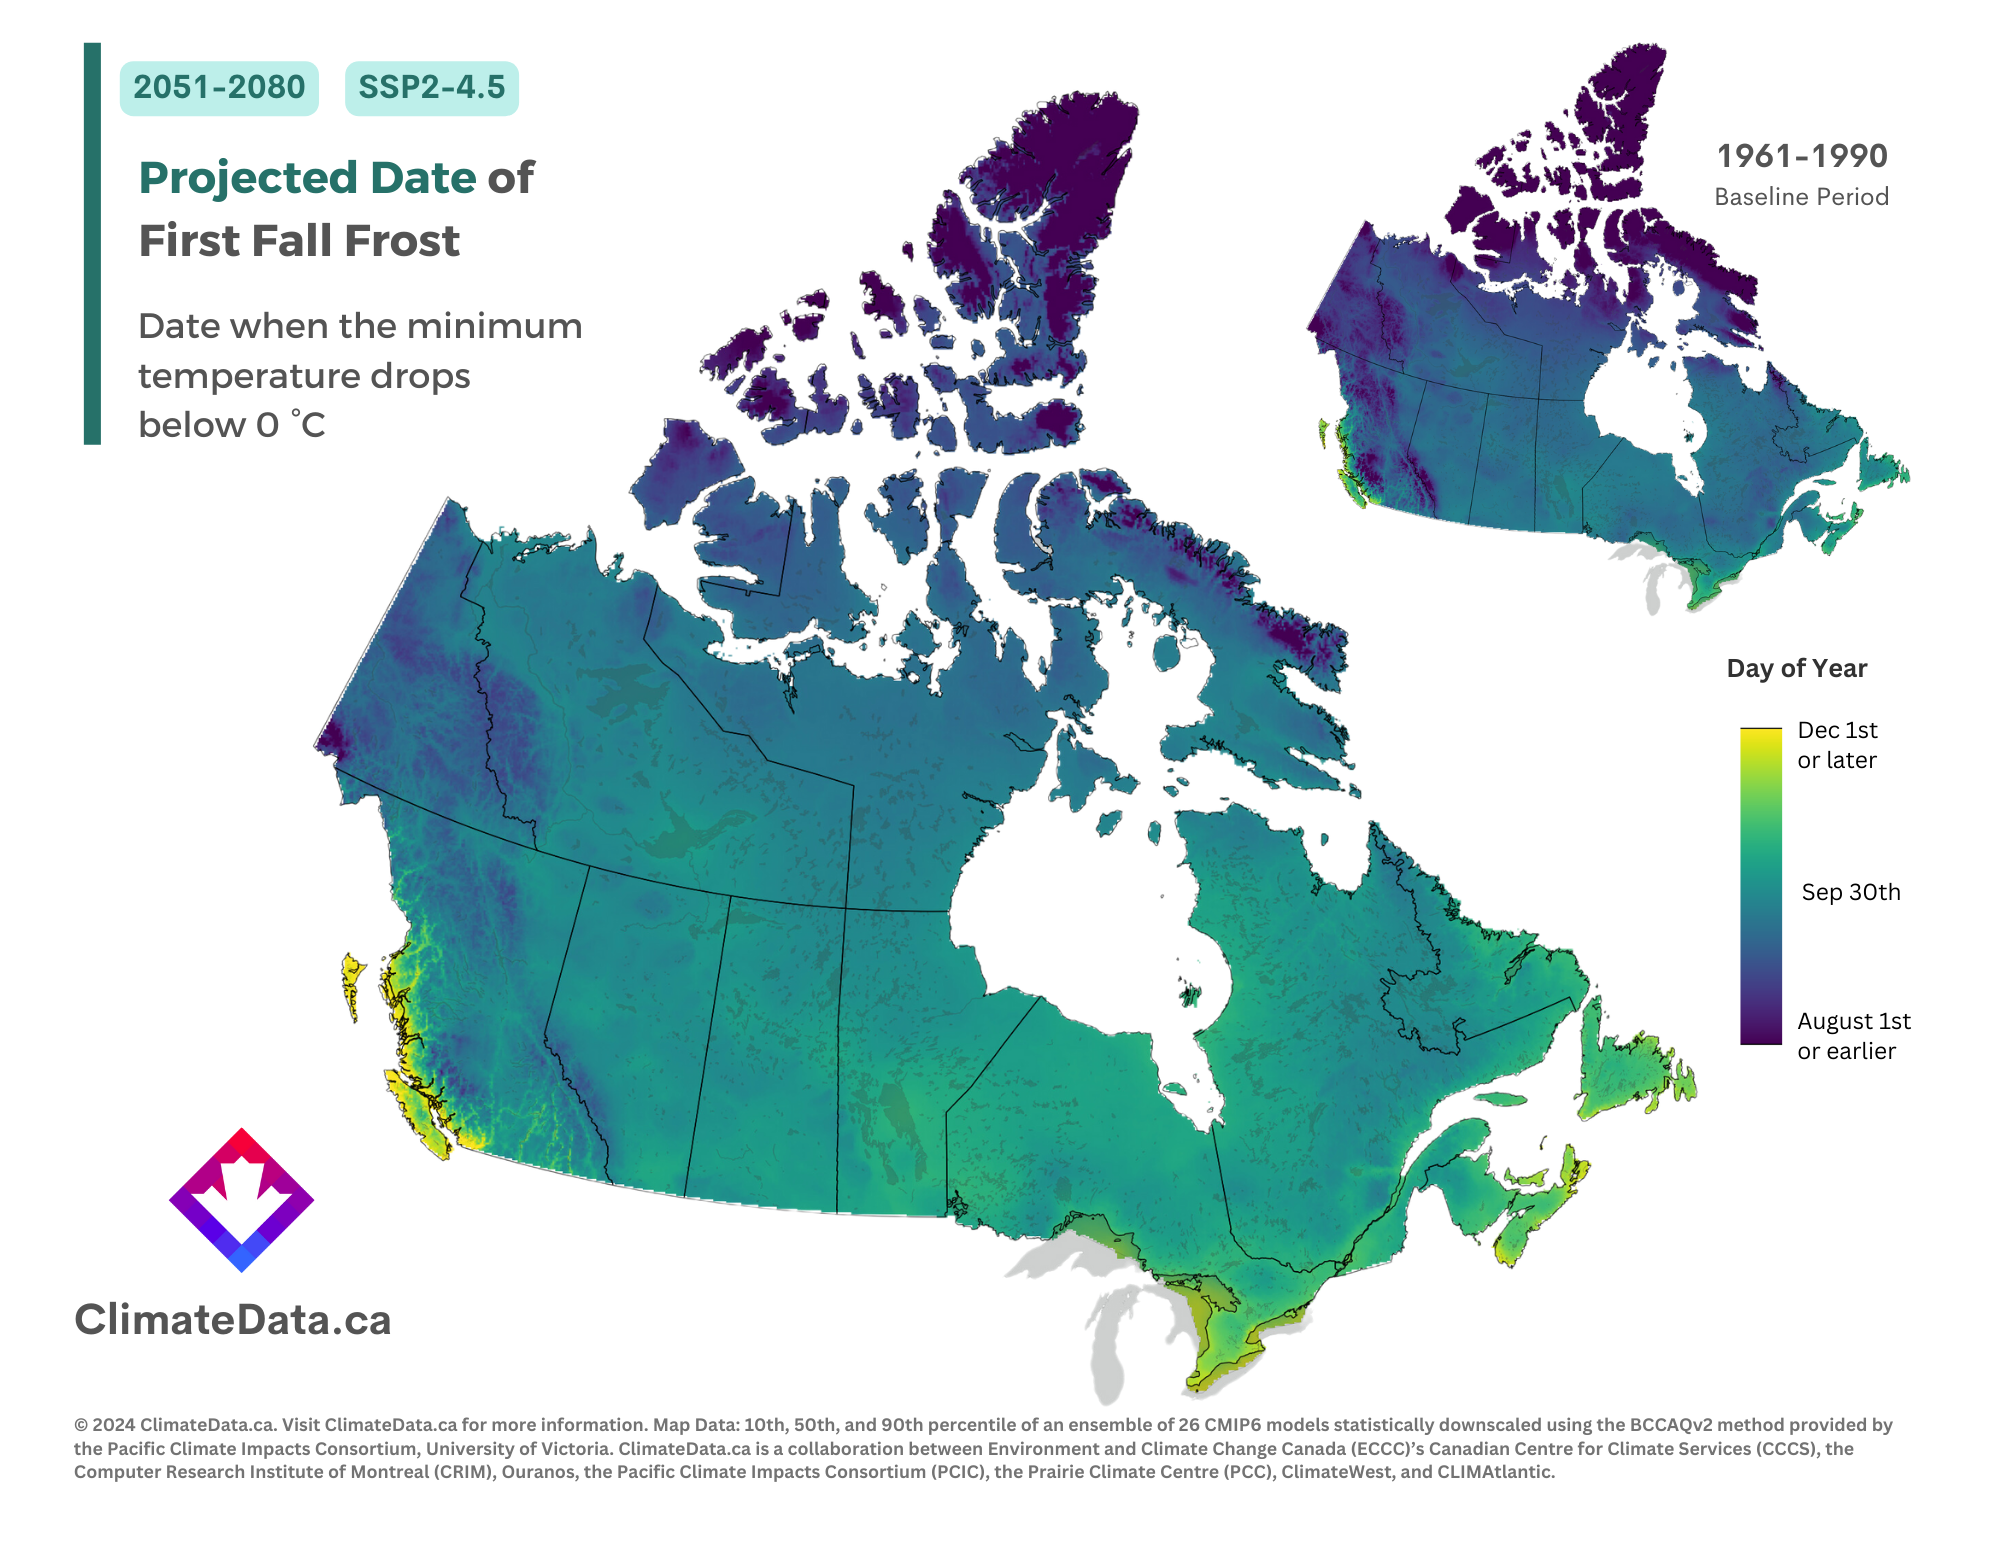
The second map we are sharing today is like the first one but shows the projected date of first fall frost under the SSP2-4.5 scenario.
Map Insights
These maps both reveal that the date of first fall frost will happen much later in the season compared to historical averages, on average. The lighter green and yellow shades indicate regions where the first fall frost will occur in October, November, or even December. This shift towards lighter colours is most evident on the SSP5-8.5 map. In contrast, the inset map contains more darker green and blue shades, indicating that many regions of Canada historically experienced a date of first fall frost on or before September 31st.
Important map caveats
Importantly, these maps illustrate the “median” date of first fall frost, computed from an ensemble of 26 global climate models. The ensemble range indicates substantial variability in yearly first fall dates, meaning that, much like the present-day climate, some years will experience a first fall much earlier in the season compared to others. It is important to acknowledge variability, so that adaptation plans consider the full range of potential values. Learn more about climate model ensembles in our learning zone article on the topic.
These maps underscore the importance of being prepared for climate change as well as the major benefits of reducing global emissions to ensure that the high-end projections do not come to pass.
To browse more maps on ClimateData.ca, including projected changes in the date of first fall frost under different time periods and scenarios, please visit our interactive map page.
[1] Because this variable is largely used to assess the end of the growing season in southern Canada, the earliest possible date for a fall frost was set as July 15. Some high latitude or high altitude regions may experience frost throughout the year.