Exploring the Deep Dive Analysis
The Deep Dive analysis of the Fire Weather Projections application provides users with standard precalculated gridded projections of fire weather conditions as well as the option to create customized metrics for specific weather station locations. The precalculated data offer long-term average projections for the six fire weather components and fire season length, while the customizable option allows for more tailored data extraction for a specific station location, useful for wildfire experts. The following article showcases these two options.
1. Standard Metrics (Gridded)
The “Standard metrics (gridded)” tab within the Deep Dive analysis of the app provides users with precalculated projections for all six components of the Canadian Forest Fire Weather Index (FWI) System as well as for the Fire Season Length. Each of the FWI System components is available through calculated metrics, offering insights into the frequency, severity, and duration of fire weather conditions, helping users understand potential future fire weather conditions over user-selected 30-year periods. The data covers most of Canada, excluding the northern Arctic ecozone and certain coastal and glacier-dominated regions.
There are many different options to choose from. To begin, let’s take a close look a just a few of the different fire weather components and metrics available.
a. Buildup Index (May to September 95th Percentile)
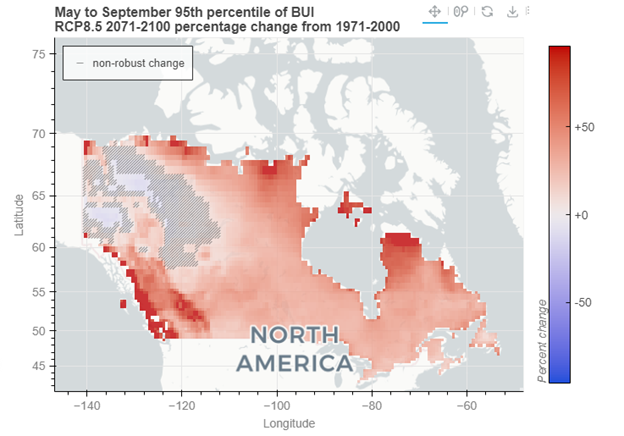
The Buildup Index (BUI) is a fire weather component that evaluates forest floor drought conditions, indicating how much material is available as potential fuel for wildfires. A higher BUI signifies an increased potential for more dry fuel (i.e., vegetation). In the Deep Dive section of the app, users can explore the BUI through various metrics. For example, the “May to September 95th percentile” (also denoted as BUIp95) metric highlights high-end BUI values during the peak fire season, which can be thought of as the extreme or more “severe” values of a fire season. Users can also visualize and download projected changes across different emissions scenarios and 30-year time periods. The map below displays the percent change in May-September BUIp95 values between the 2071-2100 future period and the 1971-2000 baseline under the high (RCP8.5) emissions scenario (Figure 1).
Figure 1: This map indicates that Canada is projected to experience an increase in extreme BUI values in the future under a high emissions scenario, with a 20-45% rise across the country. The most pronounced increases are expected in Western Canada (up to 150%), Northern Quebec (up to 145%), and the territories (up to 110%), signalling more severe fire weather conditions in these regions.
b. Fire Weather Index (Count of days with very high fire danger)
The Fire Weather Index (FWI) is another component of the FWI System, considering both forest floor drought and wind conditions. Like the BUI, the FWI can be explored through various metrics. One option is to select “Count of days with very high fire danger” from the drop-down metrics list. This will generate a map showing the average number of days with an FWI value of 20 or higher, which generally serves as a threshold for “very high” fire danger. However, it is important to note that specific thresholds for “very high” fire danger can vary by jurisdiction. For example, in Alberta, FWI values are considered to be “very high” when they fall within the range of 18.5 to 29.5 (Table 1), whereas in Nova Scotia, “very high” FWI values are within the range of 17 to 22.9 (see the “Additional Resources” section in the Quick Start Blog to see other provincial FWI thresholds).
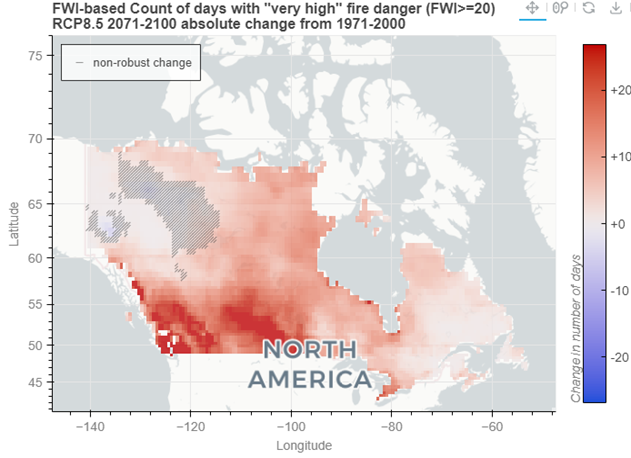
The map below illustrates the change in days with “very high” fire danger, defined as days where FWI is equal to or above 20, between the 2071-2100 future period and the 1971-2000 baseline period under the high emissions (RCP8.5) scenario (Figure 2). For demonstration purposes, this map shows “absolute change” instead of the “percent change” that was used in the previous example.
Figure 2: This map indicates that by 2071-2100, under a high emissions scenario, most regions in Canada are projected to experience an increase in the number of days with “very high” FWI danger. Parts of Western Canada could see up to 41 additional days with “very high” fire danger, while Eastern Canada is expected to experience an increase of 1 to 5 days of “very high” fire danger.
c. Fire Season Length
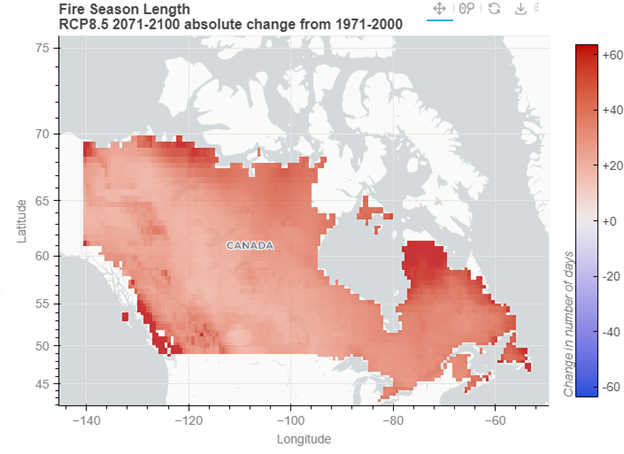
Fire season length is the final component of the FWI application that we will demonstrate. In this application, the fire season starts after three consecutive days with maximum temperatures above 12°C and ends on the third consecutive day when the maximum temperature is below 5°C (Figure 3).
Figure 3: This map, showing projected change in fire season length in Canada by 2071-2100, under a high emissions scenario (RCP8.5), shows that that the fire season across Canada is expected to lengthen by at least 20 days per year. In certain areas, such as Western BC, Northern Quebec, the territories, and Newfoundland and Labrador, the fire season could extend even further—by up to 125, 73, 60, and 64 days longer than the 1971-2000 average, respectively.
2. Customizable metrics (station-based)
The “Customizable metrics (station-based)” tab is where expert users can conduct tailored analyses, produce detailed graphs, and download station-based data. The following subsections showcase just a few of the many different metrics and graphs that can be generated. Here, we will use stations found within three national parks in Alberta as examples: Waterton Lakes (Station 3056214_NAT), Elk Island (Station 3012275_NAT), and Wood Buffalo (Station 2202200_NAT). These are the same three National Parks that we featured in our previous article on the Quick Start function: Exploring the new Fire Weather Projections App through three mini case studies — ClimateData.ca.
a. Fire Season Length
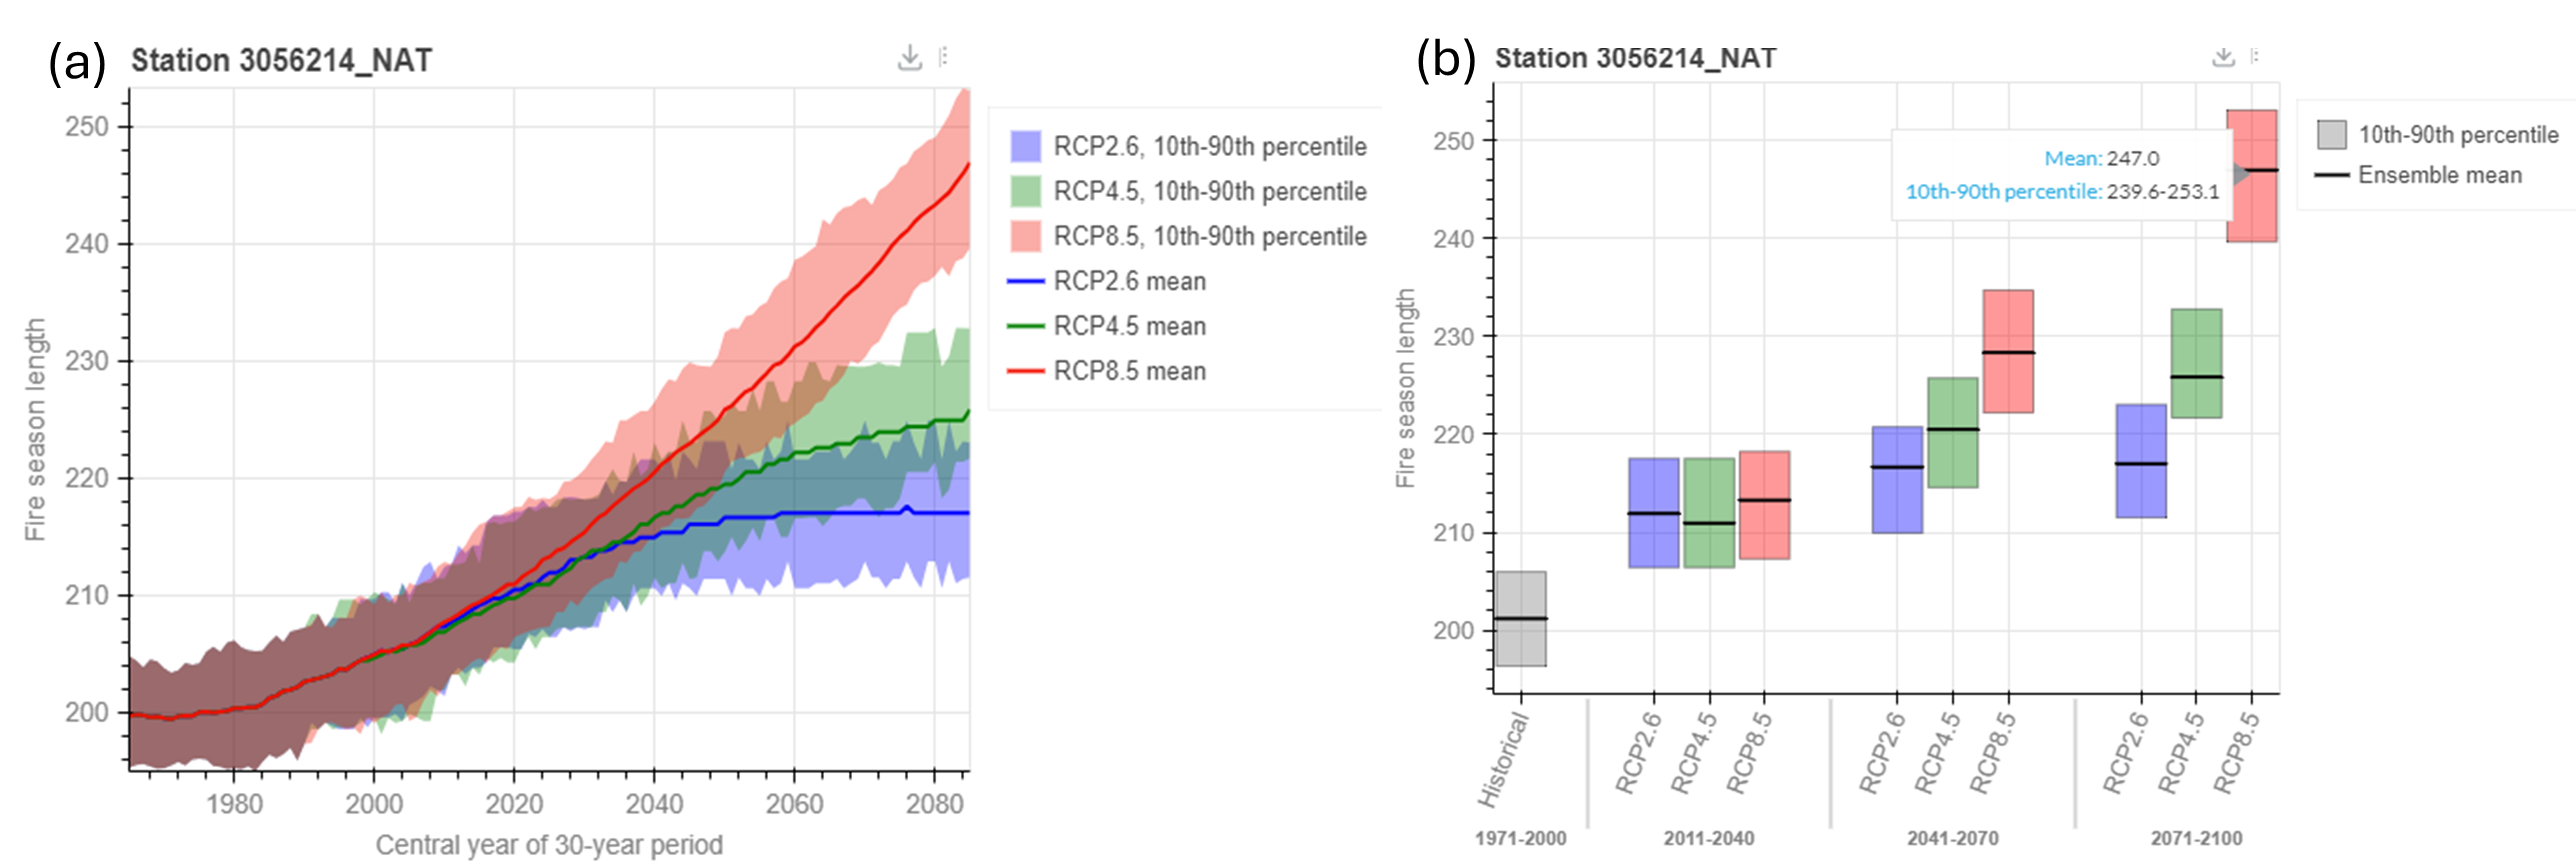
The following two graphs show projected changes in fire season length within Waterton Lakes National Park, Alberta. These figures display the same fire season length data in different formats: a time-series plot (Figure 4a) and a bar plot (Figure 4b). What these graphs show is that by the end of the century, under a low emissions scenario, the fire season in the park could extend to approximately 212-223 days (about 7-7.5 months). In contrast, under a high emissions scenario, the fire season could reach 239-253 days (about 8-8.5 months), compared to the 1971-2000 average of 201 days (about 6.5 months). This suggests the fire season could lengthen by two weeks to two months, depending on the emissions scenario.
Figure 4: Fire Season Length (or number of days per year with measurable fire danger) projections for Station 3056214_NAT (Waterton Lakes National Park, Alberta) from 1971-2000 to 2071-2100.
a) Time-series plot: This time series plot shows the length of the fire season. For each emissions scenario (RCP), the solid lines show the ensemble mean value, so half of the climate model results fall below this line and half of them are above this line. The shaded area around each line shows the range of the ensemble 10th percentile (10% of model results fall below this value) to 90th percentile (90% of model results fall below this value). All values are shown as smoothed 30-year running averages. 30-year averages are often used to ensure that the data reflects the overall climate and not the more variable experience of weather.
b) Bar plot: This bar plot shows the length of the fire season. For each time period and RCP (emission scenario), the bold black lines indicate the ensemble mean. Half of the climate model results fall below this line and half of them are above this line. The ranges of blue, green, and red boxes represent the ensemble 10th percentile (10% of model results fall below this value) to 90th percentile (90% of model results fall below this value) for RCP2.6, RCP4.5, and RCP8.5, respectively.
b. Danger ratings (Fire Weather Index)
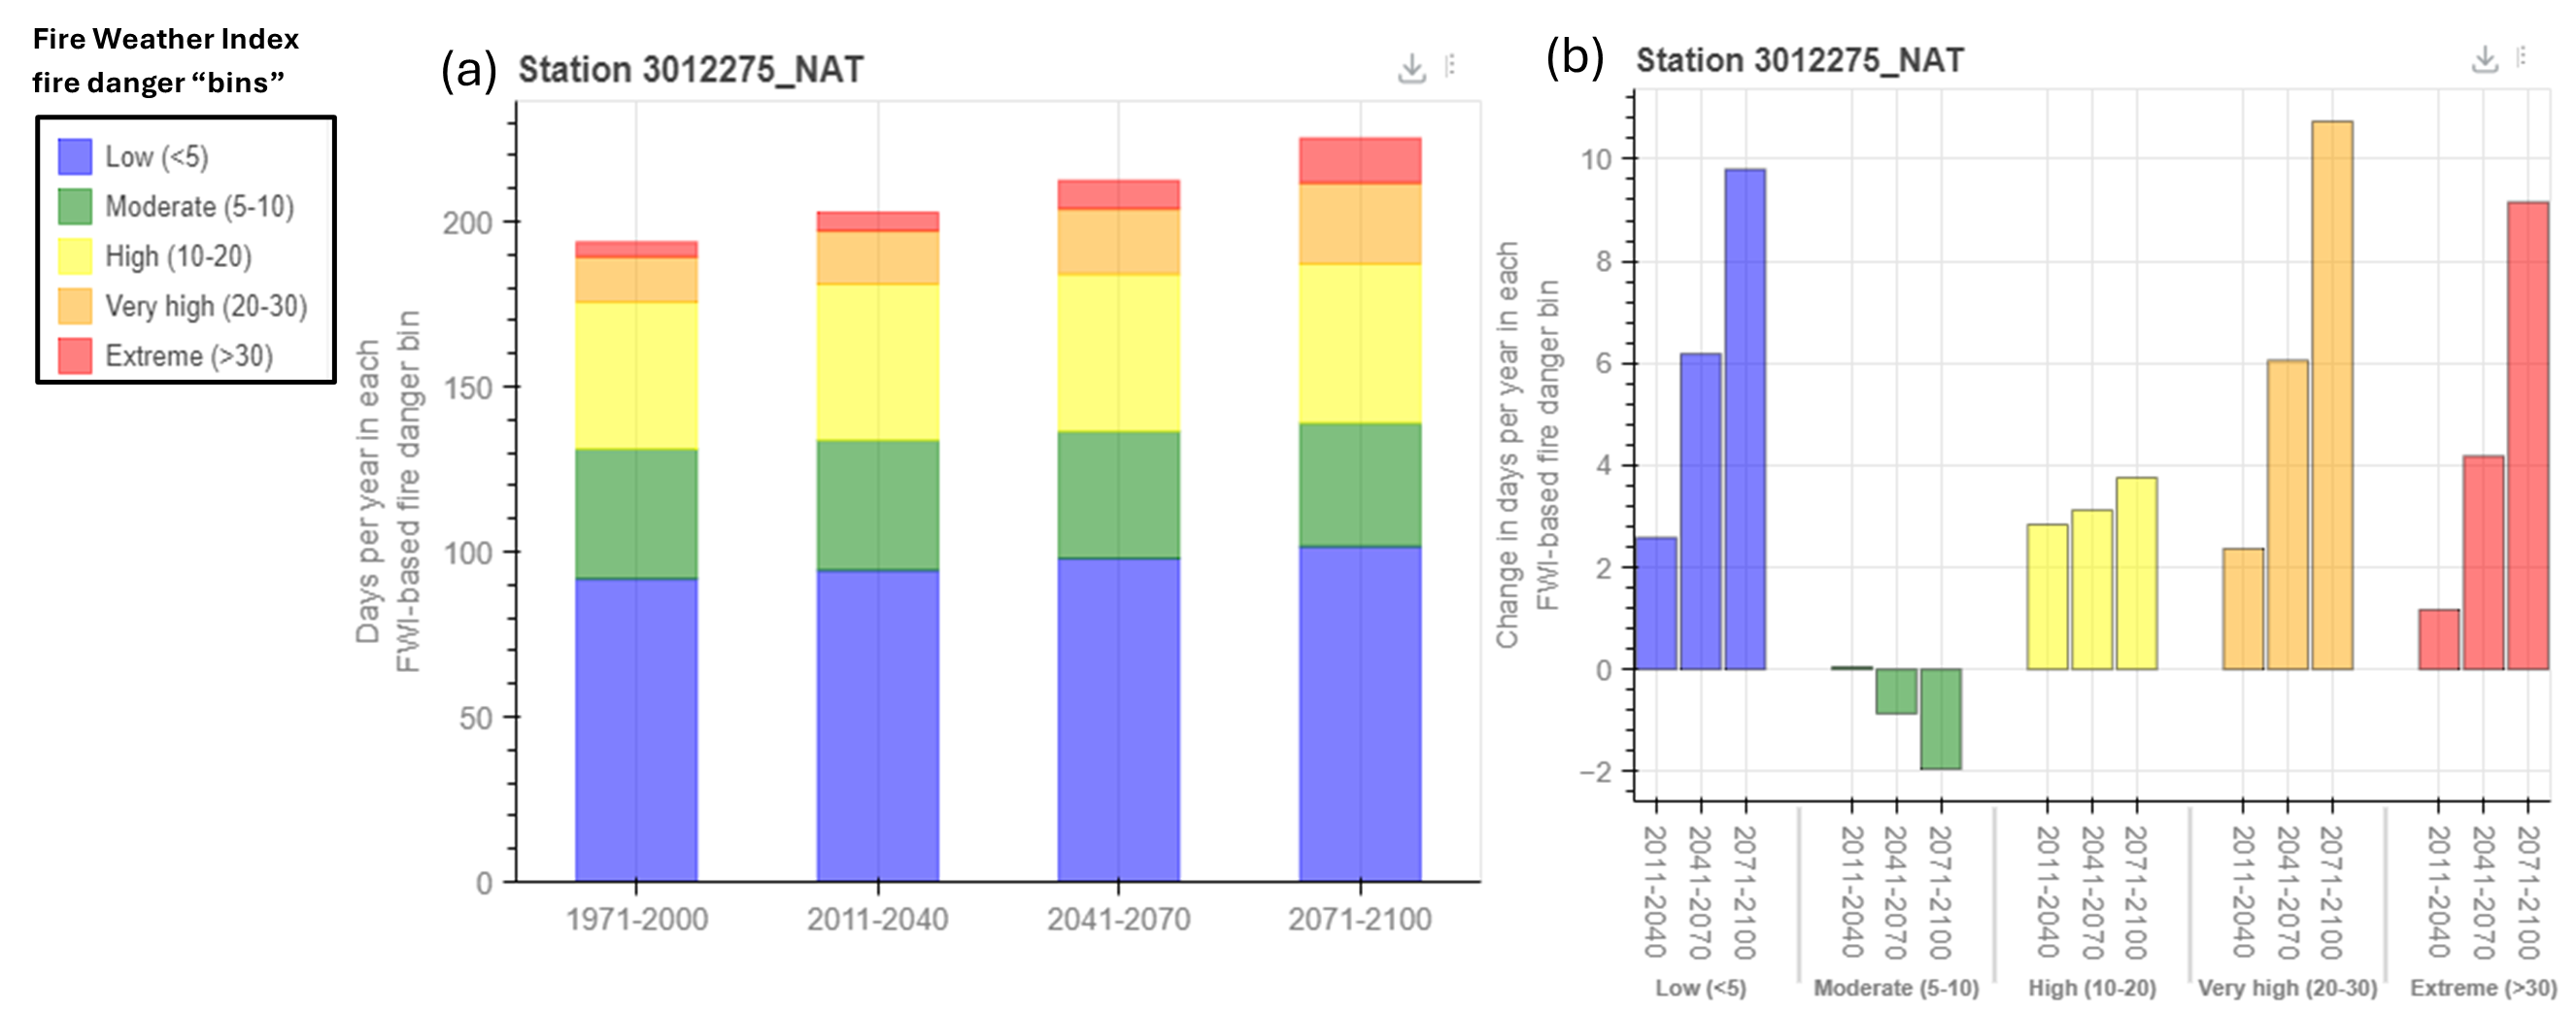
This next example showcases a station within Elk Island National Park, Alberta. Here, we examined projected changes in Fire Weather Index (FWI) danger ratings over time. Both absolute values (Figure 5a) and changes (Figure 5b) are displayed. These plots show the 30-year average number of days in each fire danger category, or “bin,” closely reflecting Alberta’s FWI danger ratings, in a high emissions scenario (RCP8.5) (Table 1).
Figure 5: Fire Weather Index danger rating projections (number of days in each fire danger bin) for Station 3012275_NAT (Elk Island National Park, Alberta) from 1971-2000 to 2071-2100, in a high emissions scenario (RCP8.5). Fire Danger bins are denoted in the legend (e.g., “low”, “moderate”, “high”, “very high”, and “extreme”).
a) Absolute Values: This plot shows the 30-year average of the annual number of days in each fire danger bin (denoted in the legend) for the Fire Weather Index. Only ensemble mean values are provided.
b) Changes: This plot shows the change in the 30-year average of the annual number of days in each fire danger bin for the selected FWI System component. Change is calculated in comparison to a 1971 to 2000 baseline. Only ensemble mean values are provided.
What these plots show is that by the end of the century, Elk Island National Park is projected to experience more days where the Fire Weather Index is considered “low,” “high,” “very high,” and “extreme”. Specifically, the park can expect about 10 more days of “low”, 4 more days of “high”, 11 more days of “very high”, and 9 or days of “extreme” fire danger compared to the 1971-2000 average. Interestingly, the number of “moderate” fire danger days is projected to decrease slightly.
Table 1: Thresholds for hazard ratings from low to extreme fire hazard for Alberta’s Fire Weather Index components. To learn more about Alberta’s FWI components, click here: Fire Weather Index Legend (alberta.ca).
| Hazard Rating |
FFMC
Fine Fuel Moisture Code |
DMC
Duff Moisture Code |
DC
Drought Code |
ISI
Initial Spread Index |
BUI
Buildup Index |
FWI
Fire Weather Index |
| Low |
0-76 |
0-21 |
0-79 |
0-1.5 |
0-24 |
0-4.5 |
| Moderate |
77-84 |
22-27 |
80-189 |
2-4 |
25-40 |
4.5-10.5 |
| High |
85-88 |
28-40 |
190-299 |
5-8 |
41-60 |
10.5-18.5 |
| Very High |
89-91 |
41-60 |
300-424 |
9-15 |
61-89 |
18.5-29.5 |
| Extreme |
92+ |
61+ |
425+ |
16+ |
90+ |
29.5+ |
c. Days above a given threshold (Buildup Index)
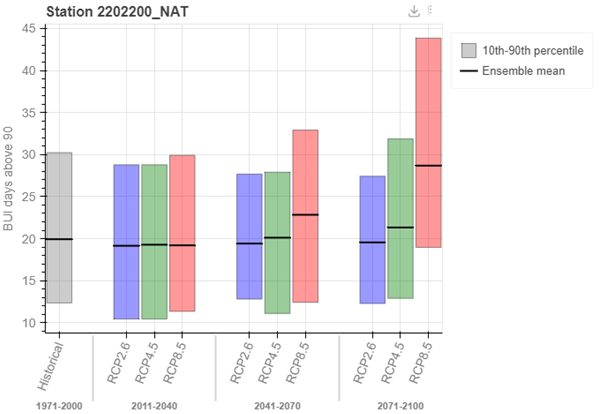
As a final example, we examined the projected number of days per year with a Buildup Index (BUI) value of 90 or higher for a station located within Wood Buffalo National Park, Alberta (Figure 6). The BUI measures subsurface forest floor drought conditions, determining how much burnable material is available as wildfire fuel. Setting a custom threshold of 90 or more for the BUI values is an example of how this app feature can be used to align with provincially-set thresholds for extreme fire danger.
Figure 6: Average number of days where the Buildup Index is 90 or higher (or “extreme” fire danger in Alberta) for Station 2202200_NAT (Wood Buffalo National Park, Alberta) from 1971-2000 to 2071-2100. For each time period and RCP (emission scenario), the bold black lines indicate the ensemble mean. The ranges of blue, green, and red boxes represent the ensemble 10th percentile (10% of model results fall below this value) to 90th percentile (90% of model results fall below this value) for RCP2.6, RCP4.5, and RCP8.5, respectively.
This bar plot presents the projected number of days with a BUI of 90+ across all emissions scenarios through the end of the century. This graphic shows that Wood Buffalo National Park, in a high emissions scenario (RCP8.5) could experience a mean of 29 days per year with a BUI above 90 by the end of this century (the 2071-2100 time period)—nine days higher than the historical (1971-2000) mean of 20 days. The bars on this graph also show the range of projected values near end of century is between 12 and 44 days, depending on the emission scenario.

