ClimateData.ca has undergone a major redesign to make it easier than ever to find, understand, and use high-quality climate data. Meet the Updated ClimateData.ca.

Rapid Extreme Weather Attribution system: Top heat events of summer 2025

Date December 30, 2025
Author Aaron Tamminga, Climate Research Division, Environment and Climate Change Canada
Topics Get Climate Smart, New and Noteworthy
Share this post

Introduction

Hot weather affected Canadians across the country in 2025. Nationwide, it was the 11th warmest summer on record since 1948, reflecting long-term summer warming of 1.8°C over the past 78 years1. The on-the-ground experience, however, varied by region. Differences in the timing, duration, and intensity of strong heat waves influenced its impact on Canada’s healthcare systems, infrastructure, wildfire risk, and people’s daily lives. Regional-scale extreme heat events are becoming more common and severe due to human-caused climate change.

Extreme Heat, Heat Warnings, and Heat Waves

When temperatures are much hotter than usual for a particular place and time of year, it is generally called an “extreme heat event” or “heat wave”. For public health and emergency planning, Environment and Climate Change Canada (ECCC) and health partners use specific heat warning criteria. These criteria look at how hot it is during the day, how little relief there is overnight, the duration of the exceptionally hot weather and, in some regions, how humidity adds to the heat stress (described by the Humidex).

When health-based thresholds are reached for two or more days in a row, ECCC and public health partners issue heat warnings and activate Heat Alert and Response Systems. These systems are designed to protect Canadians by triggering actions such as opening cooling centres, checking on vulnerable people, and sharing advice on how to stay safe.

The summer 2025 extreme heat events described in this article will be familiar to many people because they often coincided with heat warnings. However, the events analyzed here are defined slightly differently than those based on criteria for health-focused heat warnings. Specifically, the events below are characterized by daily maximum temperatures averaged over one of 17 regions across Canada exceeding the typical hottest day of the year for the region. Once characterized, the Rapid Extreme Weather Attribution system is used to determine whether human-caused climate change has changed the likelihood of these heat events occurring in these regions.

The Rapid Extreme Weather Attribution System

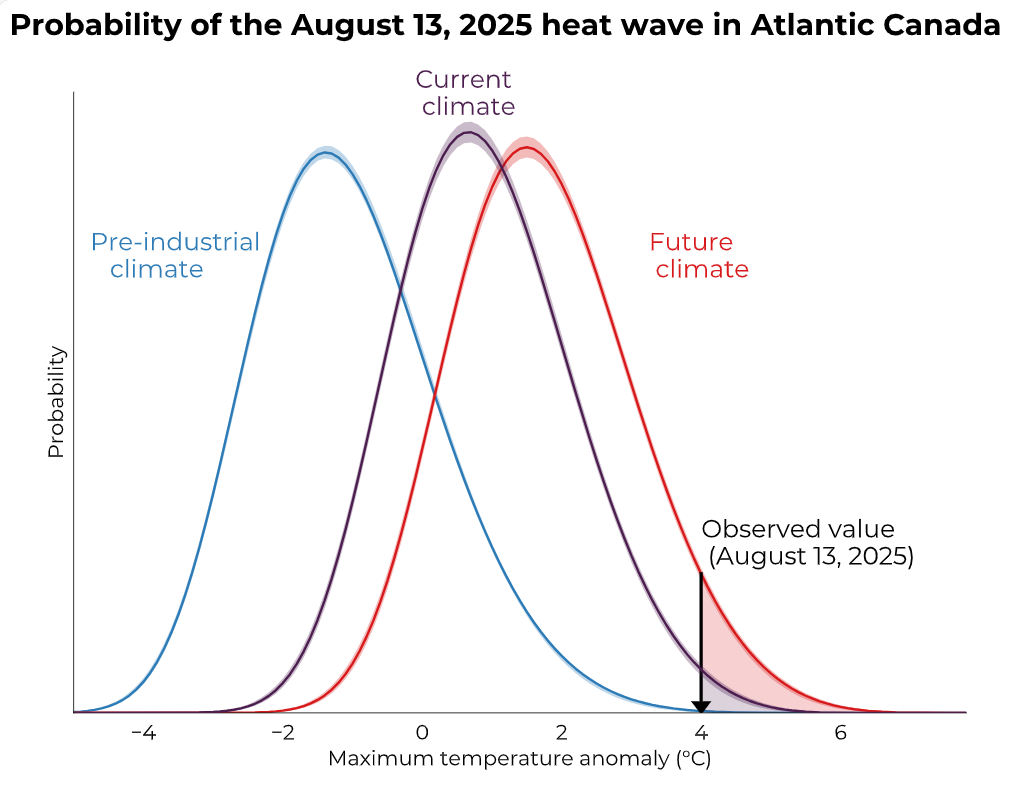
To understand how emissions generated by human activities directly impact extreme weather, such as heat events, scientists from the Climate Research Division at ECCC developed the Rapid Extreme Weather Event Attribution system. This system uses advanced climate models and observations to compare three climates: the pre-industrial conditions of the 1800s, today’s climate, and a projected future climate reflecting additional global warming. Immediately after an extreme event occurs, scientists can compare the likelihood of such an event happening in each of the three climates (pre-industrial, current, and future) and calculate the change in probability due to human-caused climate change. By providing insight into the causes and likelihood of extreme events, the Rapid Extreme Weather Event Attribution system allows for better planning related to weather emergencies, supports decision making to protect health, safety, and property, and informs climate change adaptation.

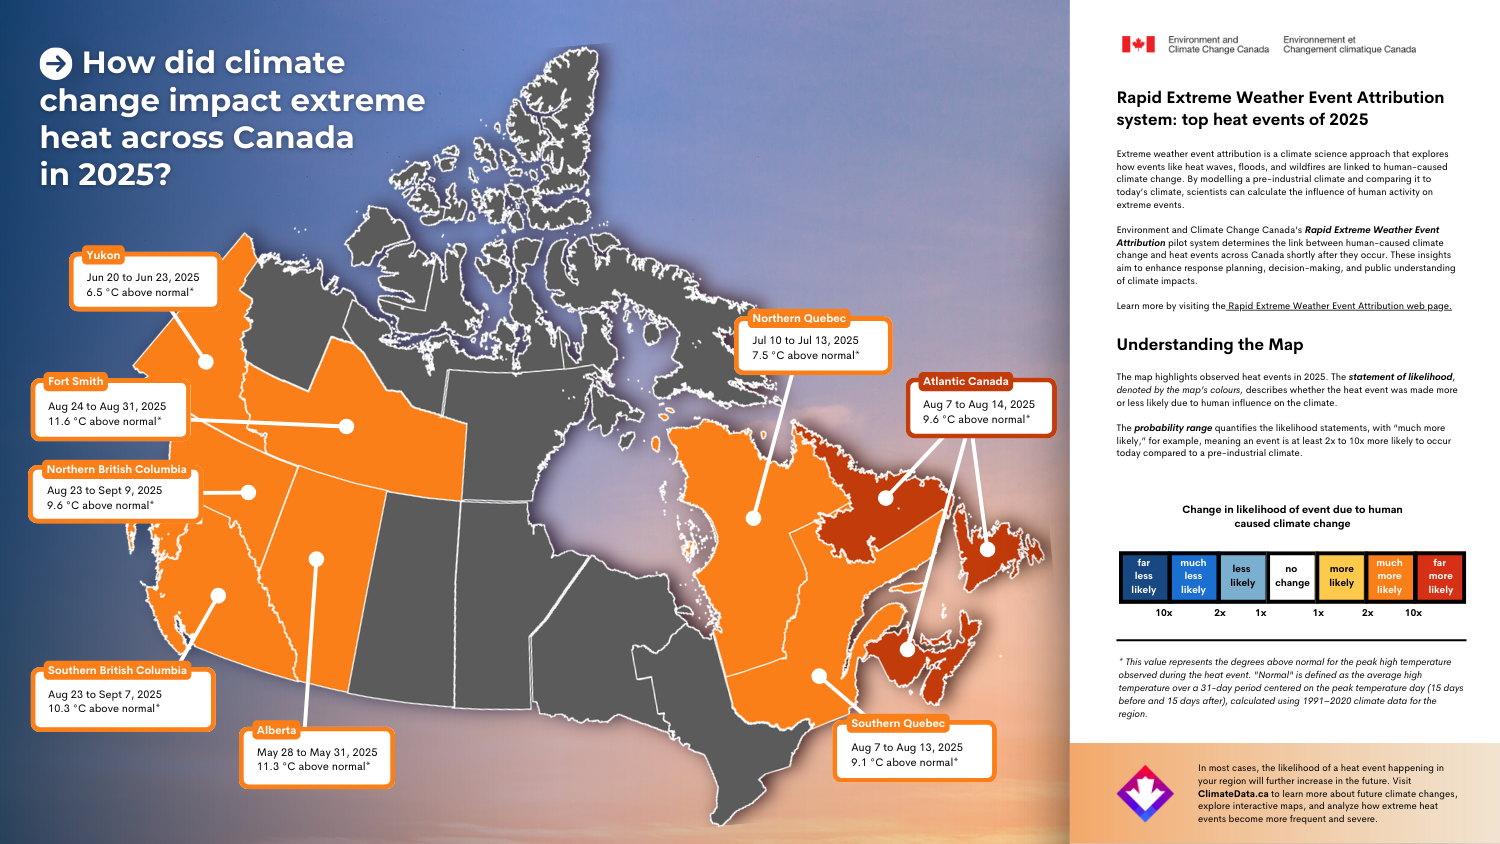
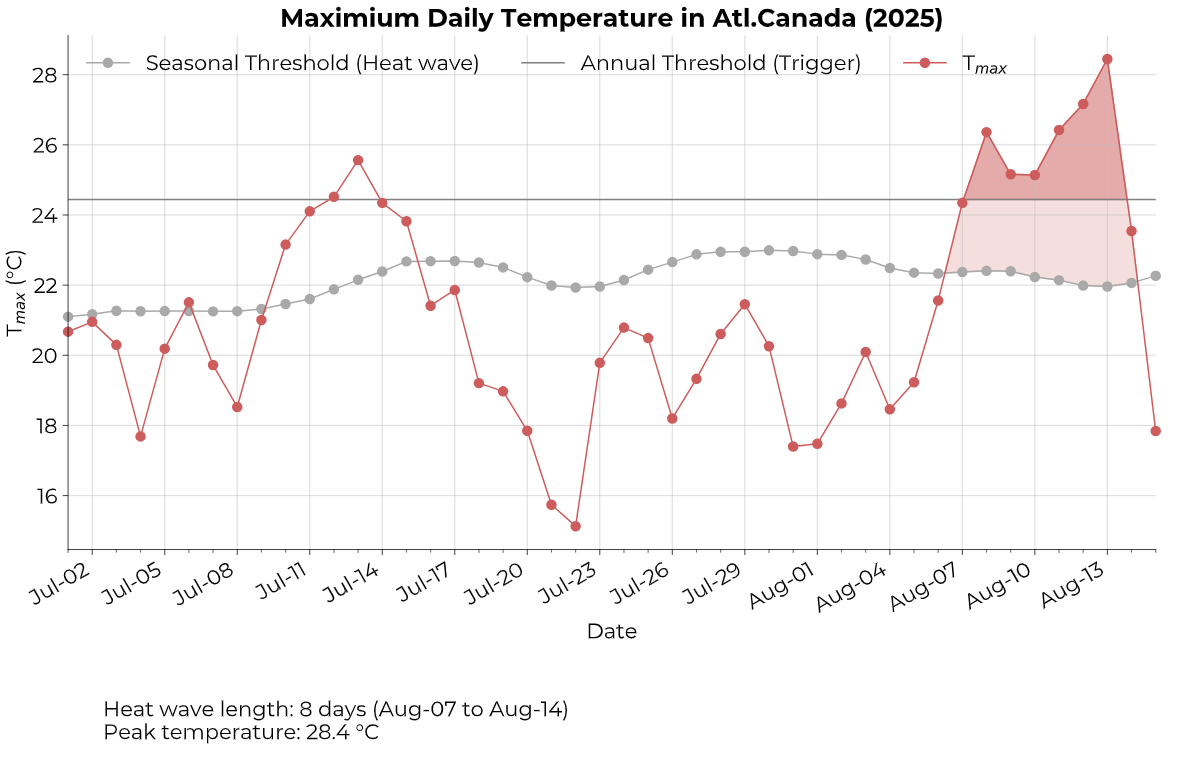
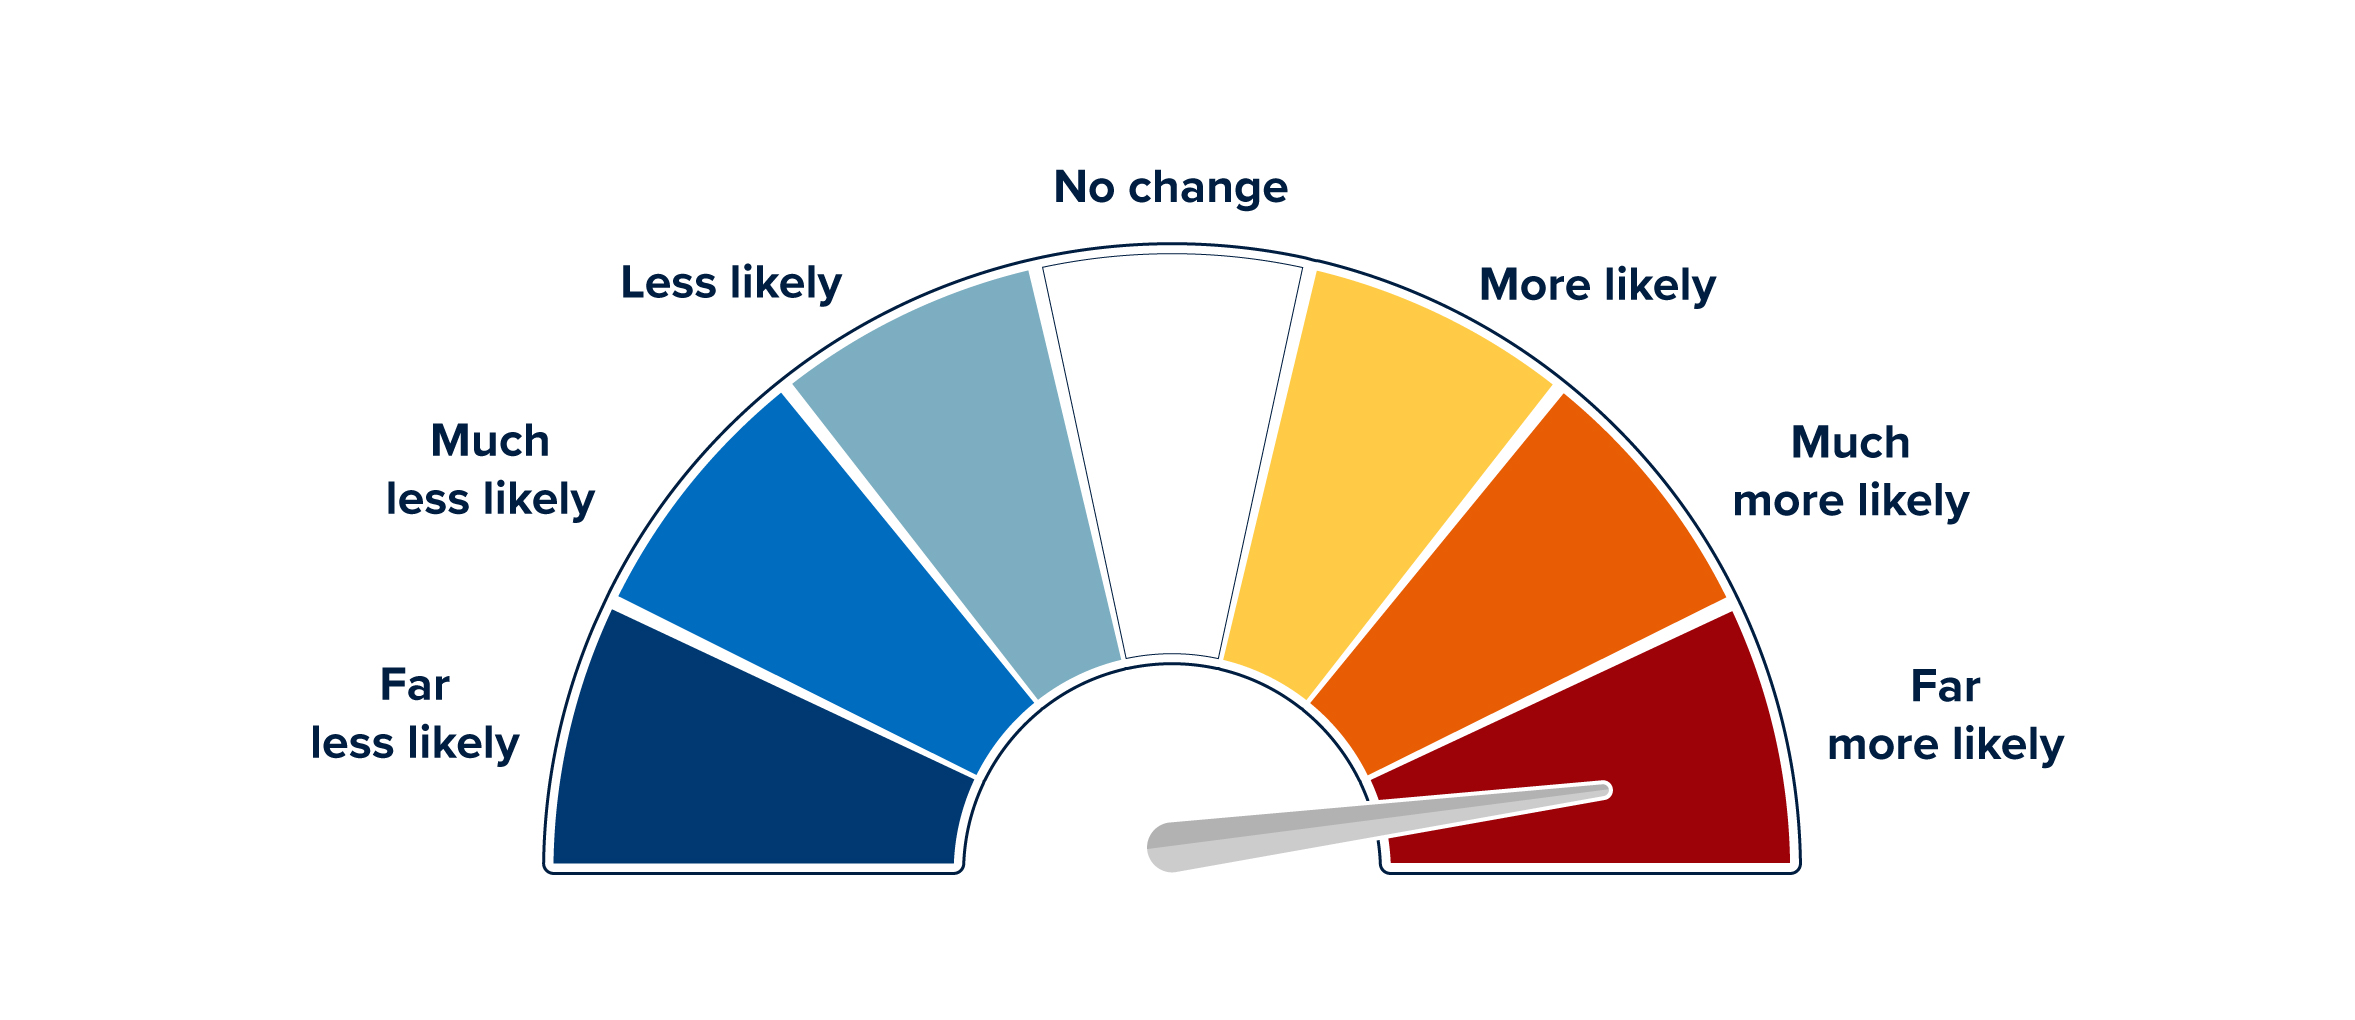
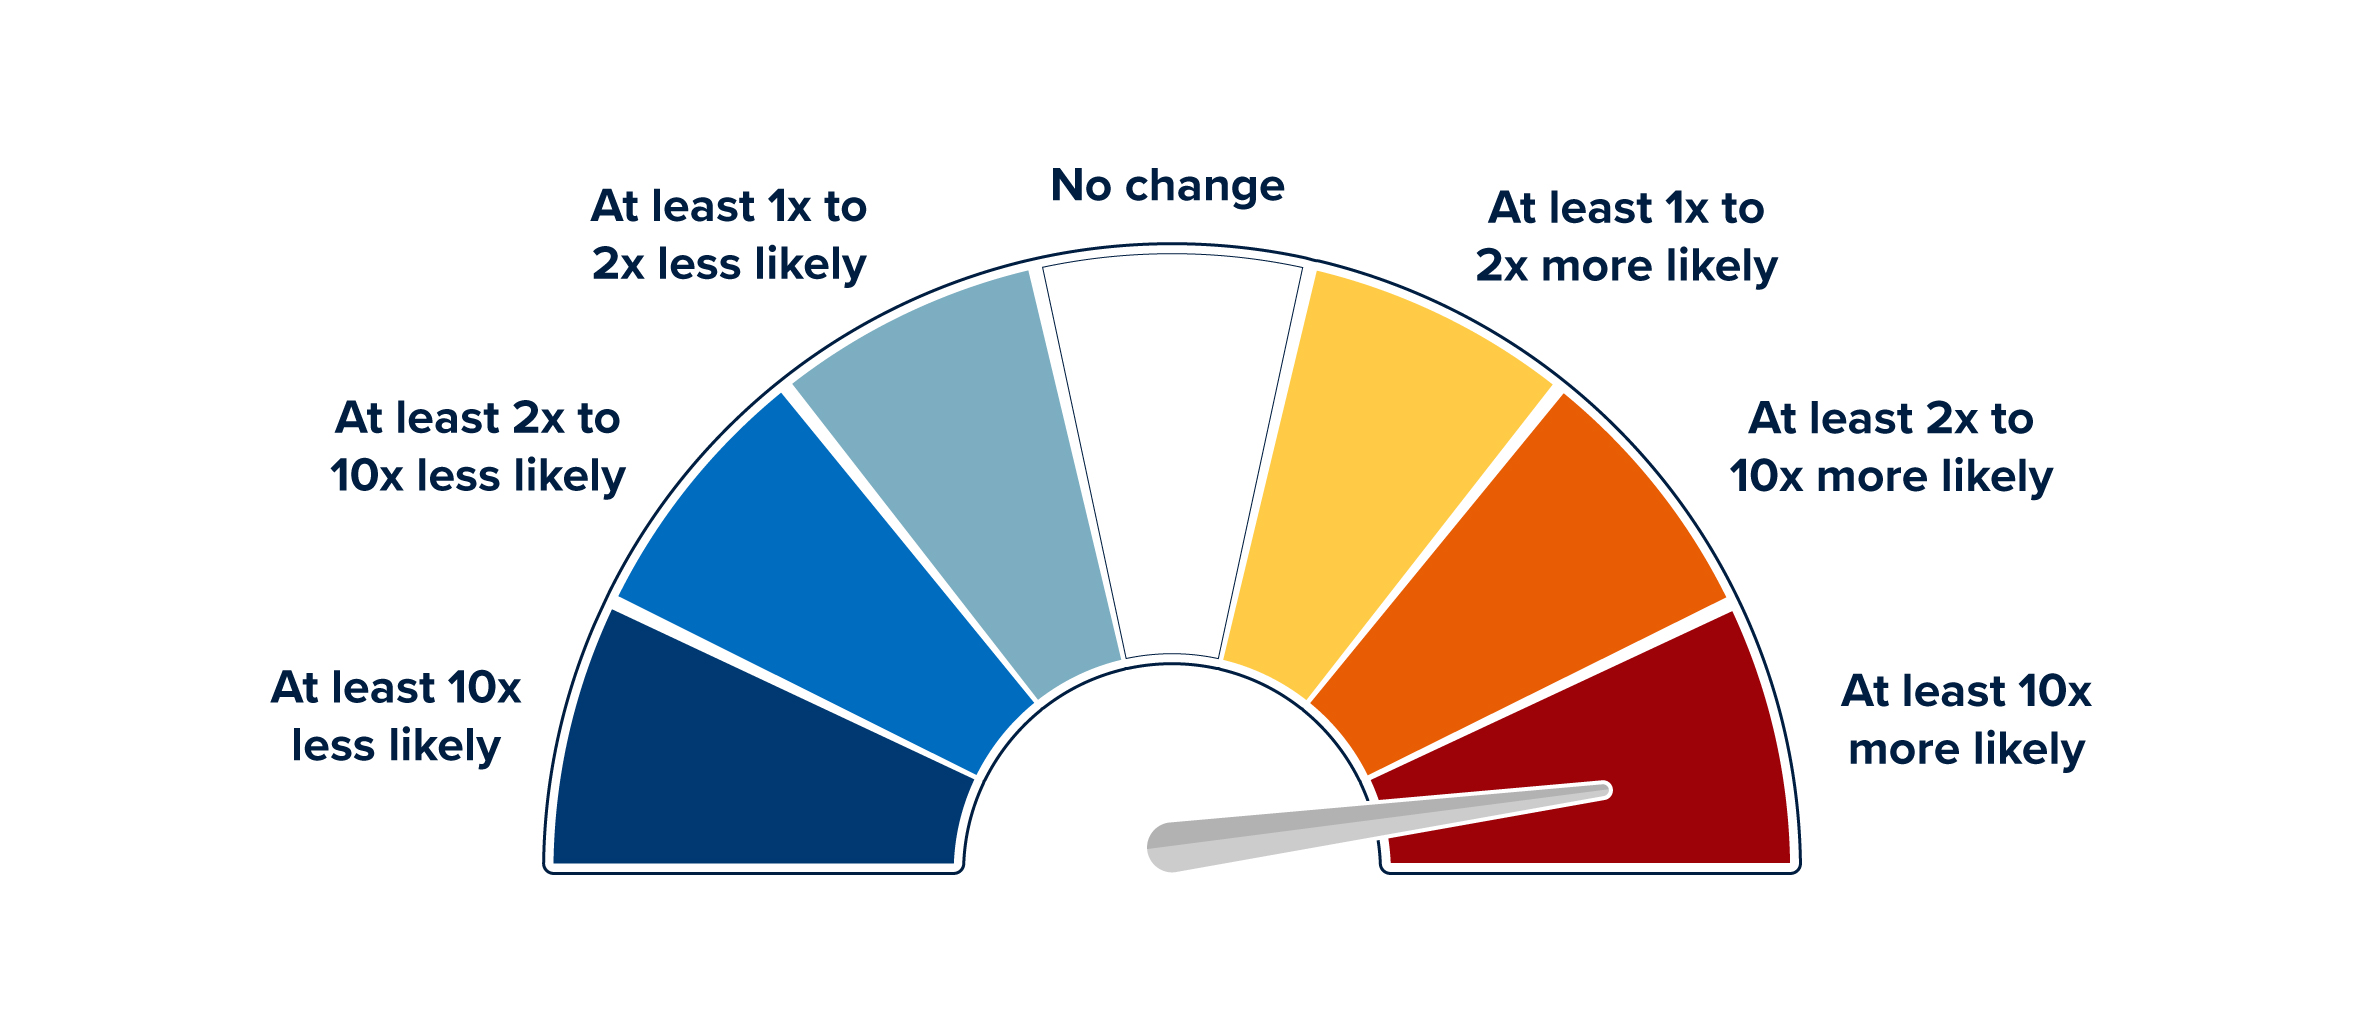
The Rapid Extreme Weather Event Attribution system divides Canada into 17 regions. The system runs every day and uses a trigger criterion based on an annual threshold of the typical hottest day of the year from a 1991-2020 base period to define heat events. When the daily maximum temperature (averaged over a region) exceeds the average annual maximum temperature for that region from 1991-2020, the system automatically identifies a heat event and calculates how human influence on the climate impacted the likelihood of the event*. The attribution analysis focuses on the peak temperature during the event, but to add relevant context, the duration of the event is defined based on a seasonal threshold of how many days exceeded the 90th percentile of daily maximum temperatures for that time of the year. Results are reported as a statement of likelihood on a scale ranging from far less likely to far more likely, with each statement corresponding to a probability/risk number value. For example, an event of a given magnitude determined to be much more likely in the current climate due to climate change is at least 2x to 10x more likely to occur in today’s climate compared to the pre-industrial climate of the 1800s.

Summer 2025 Heat Across Canada

This past summer, human-caused climate change influenced heat events in many regions of Canada. A total of 12 heat waves were identified by the system, with 11 determined to be much more likely and one determined to be far more likely (at least 10x more likely) due to human-caused climate change. The map below shows the most extreme event identified for each region (eight events total because only the strongest event is shown for regions with more than one event; grey regions did not have a heat wave that met the criterion for a heat event set by the system).

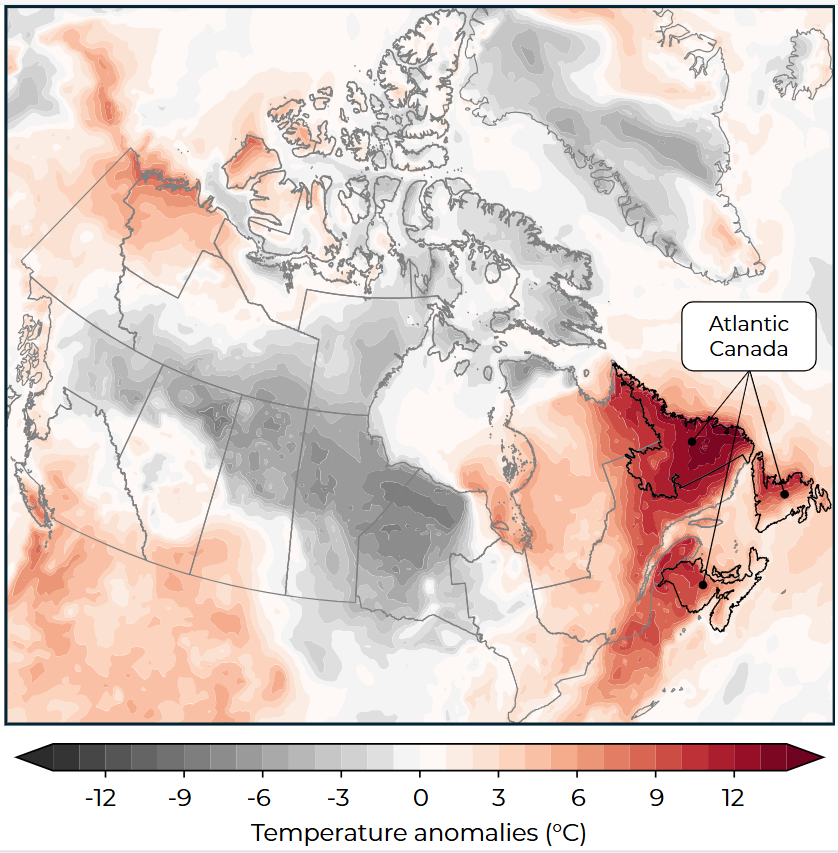
Notable heat events occurred in western Canada at the beginning and end of the summer season, with a surge of heat in late August and early September. Eastern Canada experienced a short but intense warm window later in the summer, with hot weather in mid-July and August, including an event in Atlantic Canada that had the strongest calculated human influence on likelihood of the 12 events. Northern Canada also experienced heat at the beginning and end of summer, with events in Yukon in June and in the Northwest Territories in late August.


Click here to download a full-resolution version of this graphic as a PDF

The table below shows the full set of 12 events with additional temperature information, along with the current statement of likelihood and a statement of likelihood describing how much more likely an event of the same magnitude would be in a future climate with 2°C global warming.  Although the peak temperatures reported in the table may not seem that extreme, they are average values over each large region; certain areas within each region would have experienced much higher peak temperatures during each event. The system also focuses solely on daytime temperatures for the attribution analysis; the health risks presented by high humidity or elevated nighttime temperatures are not reflected, although they often accompany the events listed here.

The event with the hottest absolute temperature was in southern Quebec with a peak of 29.3°C averaged across the region on August 11th, and the longest event was in northern British Columbia which lasted 18 days from August 23rd to September 9th. Under 2°C global warming in the future, extreme events will become more frequent overall; in this case, two events are projected to shift from much more likely to far more likely, while 10 events remain in the same likelihood category.

Region Dates of heat event Date of peak temperature Peak daily high temperature (°C) Normal daily high temperature (°C) Degrees above normal daily high temperature (°C) Current likelihood (compared to pre-industrial) Future likehood under 2°C warming (compared to pre-industrial)
Fort Smith, Northwest Territories Aug 24 to Aug 31 Aug 30 25.5 13.9 11.6 Much more likely Much more likely
Alberta May 28 to May 31 May 29 28.8 17.5 11.3 Much more likely Much more likely
Southern British Columbia Aug 23 to Sept 7 Sept 3 27.1 16.8 10.3 Much more likely Much more likely
Northern British Columbia Aug 23 to Sept 9 Aug 29 23.5 13.9 9.6 Much more likely Much more likely
Atlantic Canada Aug 7 to Aug 14 Aug 13 28.4 18.8 9.6 Far more likely Far more likely
Alberta Aug 25 to Aug 31 Aug 28 28.8 19.5 9.3 Much more likely Much more likely
Southern Quebec Aug 7 to Aug 13 Aug 11 29.3 20.2 9.1 Much more likely Far more likely
Northern Quebec Jul 10 to Jul 13 Jul 11 24.2 16.7 7.5 Much more likely Much more likely
Atlantic Canada Jul 10 to Jul 15 Jul 13 25.6 18.5 7.1 Much more likely Far more likely
Northern Quebec Aug 6 to Aug 9 Aug 7 23.8 16.8 7.0 Much more likely Much more likely
Yukon Jun 20 to Jun 23 Jun 21 22 15.5 6.5 Much more likely Much more likely
Fort Smith, Northwest Territories Jul 30 to Aug 1 Jul 31 25.2 19.2 6.0 Much more likely Much more likely

Example Heat Event: Atlantic Canada August 7th to 14th

The heat event with the strongest human influence (far more likely or at least 10x more likely due to climate change) in summer 2025 was in Atlantic Canada from August 7th to August 14th, with a peak temperature of 28.4°C averaged over the region on August 13th. This heat wave was associated with unusually dry conditions: low soil moisture can cause warmer air temperatures by altering the surface energy balance and can also increase wildfire risk. Fires caused evacuations and damage throughout the region and Newfoundland’s Avalon Peninsula experienced its longest-ever heat warning: seven straight days.

The following set of figures demonstrates how the Rapid Extreme Weather Event Attribution system identifies and analyzes a heat event, using the Atlantic Canada event as an example. The first figure shows a map of temperature anomalies (defined as the difference in daily maximum temperature between the analyzed date and the 1990-2021 base period) across Canada for the hottest day of the event. These temperature anomalies are derived from the ERA5 reanalysis product2, which uses a weather model together with observations to provide a spatially complete snapshot of climate conditions in recent history. At the peak of the event, warm conditions extended across much of eastern Canada. Temperature anomalies in the highlighted Atlantic Canada region exceeded 10°C above normal in many areas, with much warmer than usual conditions in Newfoundland and Labrador in particular.


The second figure shows a time series of observed absolute maximum daily temperatures (Tmax) from ERA5 data in July and August averaged over the Atlantic Canada region. The annual threshold line represents the trigger criterion to identify an event, calculated as the average annual maximum temperature (hottest day of the year) for the region from 1991-2020. In the case of the early August heat wave, this threshold was exceeded from August 8th to August 13th, shown by the dark red shaded area. Following the event, the final start and end dates are determined based on the seasonal threshold, which is calculated as the 90th percentile of daily maximum temperatures from the 1991-2020 period for the dates of interest, shown by the light red shaded area. Based on the seasonal threshold, the event lasted from August 7th to August 14th.

To determine the influence of human-caused climate change on the event, the attribution system compares how the distribution of the temperature of the hottest day of the year (relative to 1991-2020) changes between the simulated pre-industrial, current, and future climates. These distributions come from multi-model climate ensembles from the Coupled Model Intercomparison Project Phase 6 (CMIP6)3 for each time period. The graph below shows the distributions of maximum temperature anomalies for Atlantic Canada for each time period based on 27 CMIP6 models. As the modelled climate warms from pre-industrial to current to future conditions, the distribution of maximum temperature anomalies shifts to the right. This shift indicates increased overall temperatures as well as increased probability of extreme heat, which occurs at the far-right tail of each distribution. The observed hottest daily maximum temperature anomaly relative to the average hottest day of the year for the region between 1991 and 2020 according to ERA5 data for the Atlantic Canada event was 4°C and is shown by the vertical black line. Under pre-industrial conditions, an event with a 4°C anomaly is extremely uncommon and nearly beyond the upper range of the distribution. Under the warmer conditions of the current climate, such an event is still at the upper end of the distribution but is much more probable. As the climate continues to warm in the future under a 2°C global warming level, the distribution continues to shift to warmer temperatures and a 4°C temperature anomaly event is well within the range of modelled conditions, meaning it is expected to happen more frequently.

Because of the difference in probability (indicated by the shaded area under each distribution) between the current climate and the pre-industrial climate, the Atlantic Canada event was determined to be at least 10x more likely in the current climate due to human-caused climate change, which corresponds to a likelihood statement of far more likely. The probability/risk range values and likelihood statements are communicated for the event with indicator scale graphics as shown below.  

Conclusion

The Rapid Extreme Weather Event Attribution system provides valuable insights into the role that human-caused climate change plays in extreme weather events. The system was initialized in 2024 with a focus on extreme heat events; analysis of extreme cold events (which are becoming less common) was added in 2025 and a new pilot system for the attribution of extreme precipitation has been recently introduced. ECCC’s scientists are still making improvements to strengthen the system as new capabilities are piloted and more data and research become available. As the system continues to run, a valuable dataset of events over the years will be developed, allowing for a long-term perspective on how weather extremes, such as the heat events detailed in this piece, are changing across Canada.  By linking extreme events to human-caused climate change in the current climate and projecting probabilities of extremes in the future, the system will allow Canadians to better understand, plan for, and respond to dangerous and costly extreme weather hazards.

For More Information

Visit Environment and Climate Change Canada’s Extreme Weather Event Attribution website to learn more. Visit ClimateData.ca to learn more about future climate changes, explore interactive maps, and analyze how extreme heat events become more frequent and severe under a range of emissions scenarios.

*The criterion to trigger a heat event was updated between 2024 and 2025 so that the system shifted from analyzing seasonal extremes (extreme for that time of year) to focusing only on annually extreme events (extreme compared to the typical hottest day of the year). For this reason, results from 2024 and 2025 are not directly comparable.

References

1Climate Trends and Variations Bulletin – Summer 2025. (2025). Environment and Climate Change Canada. Climate Trends and Variations Bulletin – summer 2025 – Canada.ca.

2Hersbach, H., Bell, B., Berrisford, P., Hirahara, S., Horányi, A., Muñoz‐Sabater, J., … & Thépaut, J. N. (2020). The ERA5 global reanalysis. Quarterly Journal of the Royal Meteorological Society146(730), 1999-2049.

3Eyring, V., Bony, S., Meehl, G. A., Senior, C. A., Stevens, B., Stouffer, R. J., & Taylor, K. E. (2016). Overview of the Coupled Model Intercomparison Project Phase 6 (CMIP6) experimental design and organization. Geoscientific Model Development9(5), 1937-1958.