Best Practices for Using IDF Curves

Based on technical guidance from ECCC and CSA 4013:2019, here are eight best practices and key challenges to consider when using IDF curves.

Time to completion
5 min

Summary

The following best practices are recommended for decision-making and design using IDF curves, and summarize technical guidance available from ECCC and CSA PLUS 4013:2019.

Best Practices and Key Challenges

Pick a return period that is appropriate for your application. The choice of return period is important and should be based on consideration of relevant impacts and risks.  For example, storm sewers, ditches, and culverts often use a peak flow approach to consider return periods ranging from 2 years to 100 years. However, critical infrastructure that is used to manage surface water runoff from train tracks or highways may be designed for return periods of over 200 years – outside the scope of standard IDF curves.
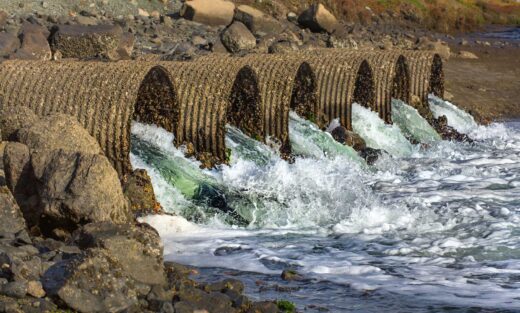
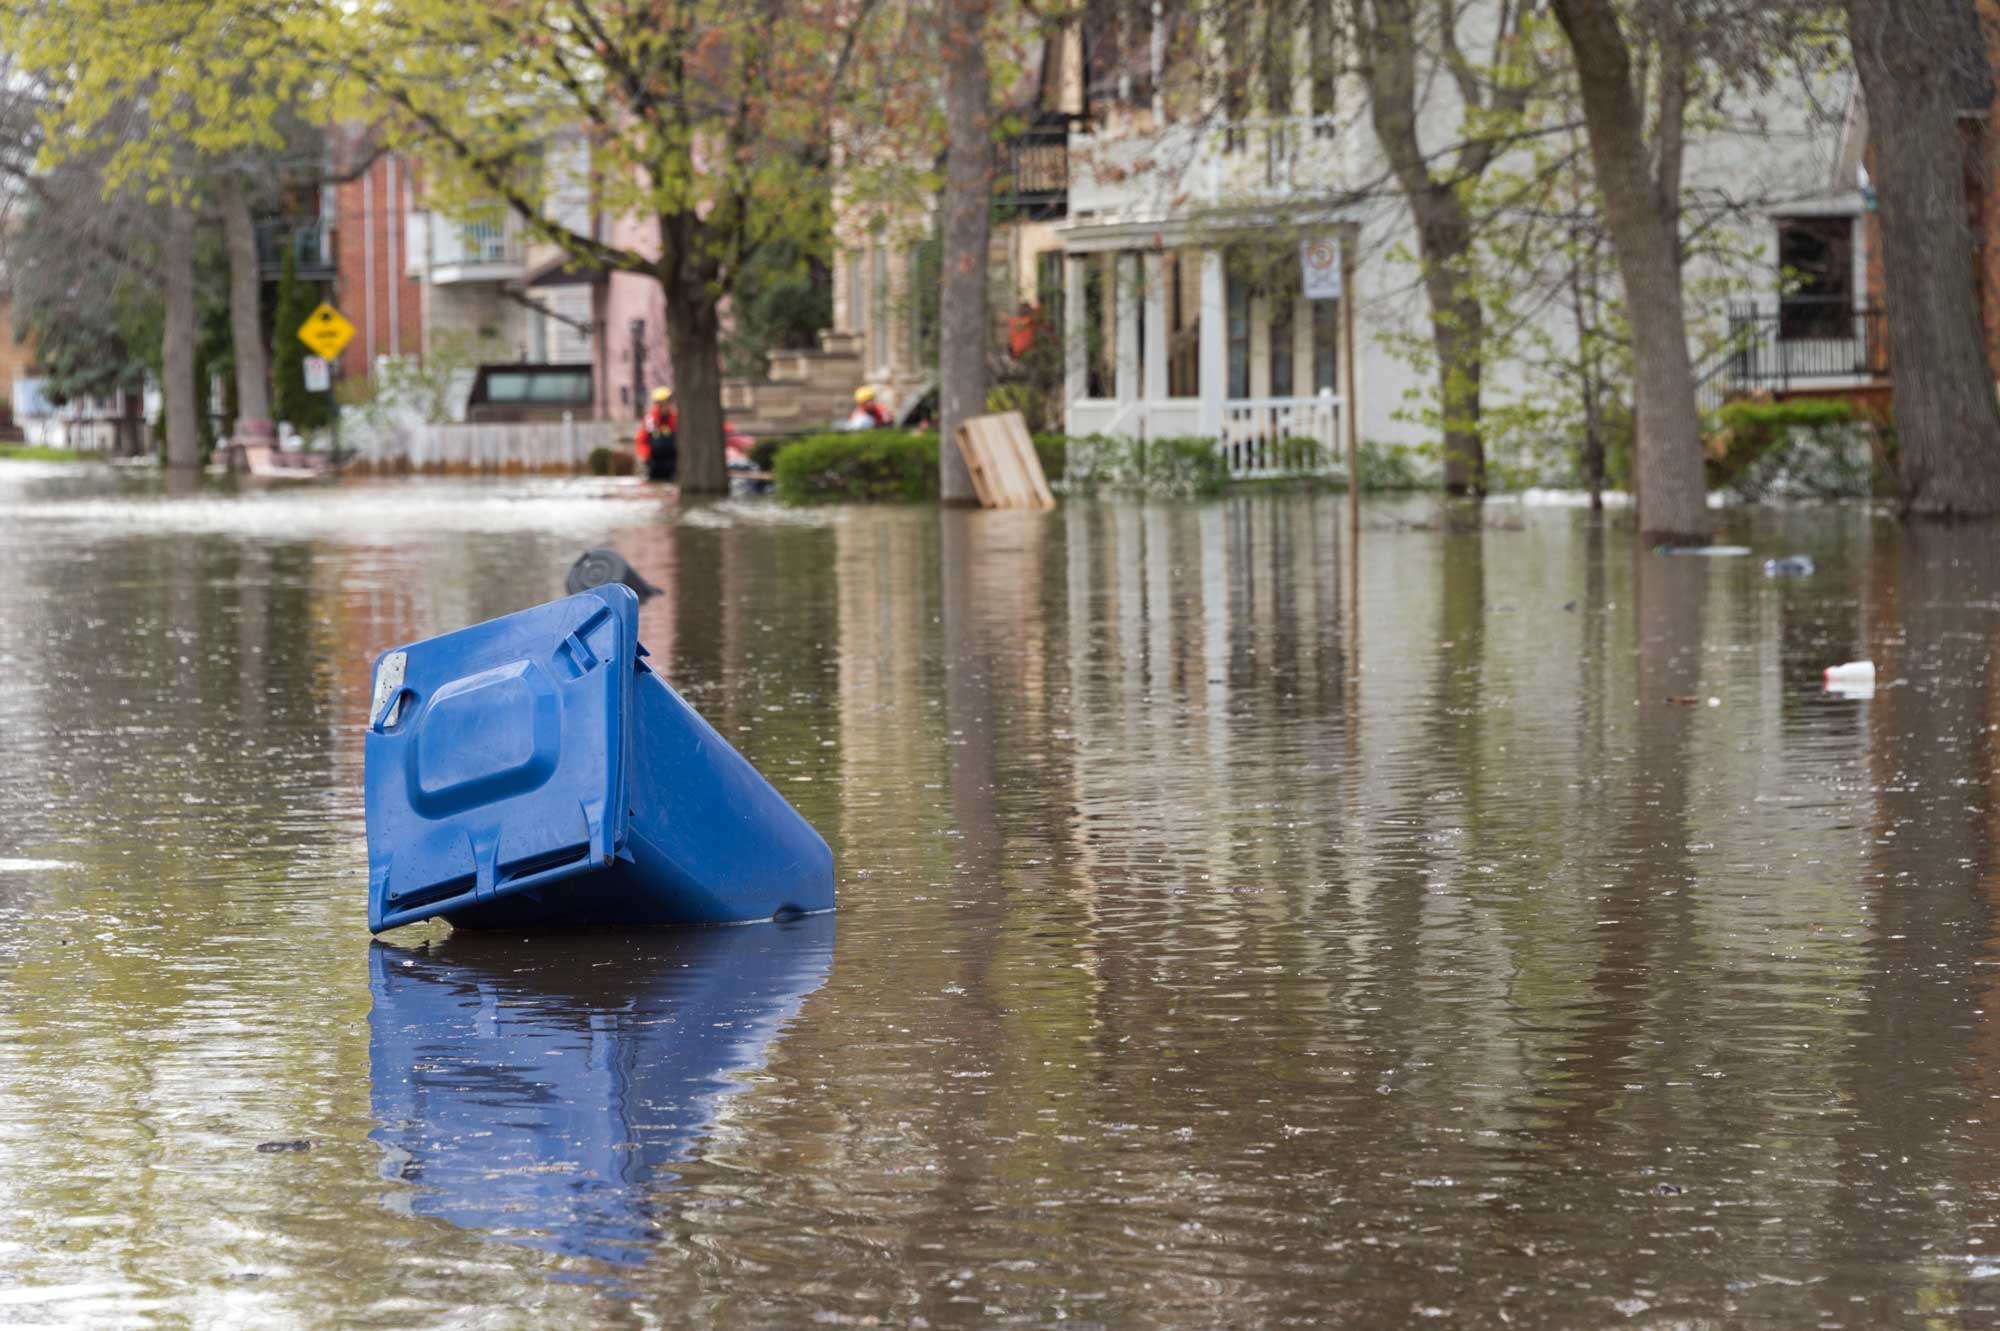
Pick a storm duration that is appropriate for your application. Not all rainfall impacts stem from the same storm durations.  For example, storms that tend to cause damaging urban overland flooding are often short, extreme events. In contrast, soil saturation and stability may be most impacted by lower intensity – but more persistent, longer duration – storm events.  Practitioners should carefully consider the appropriate storm duration that best reflects how rainfall impacts their project.


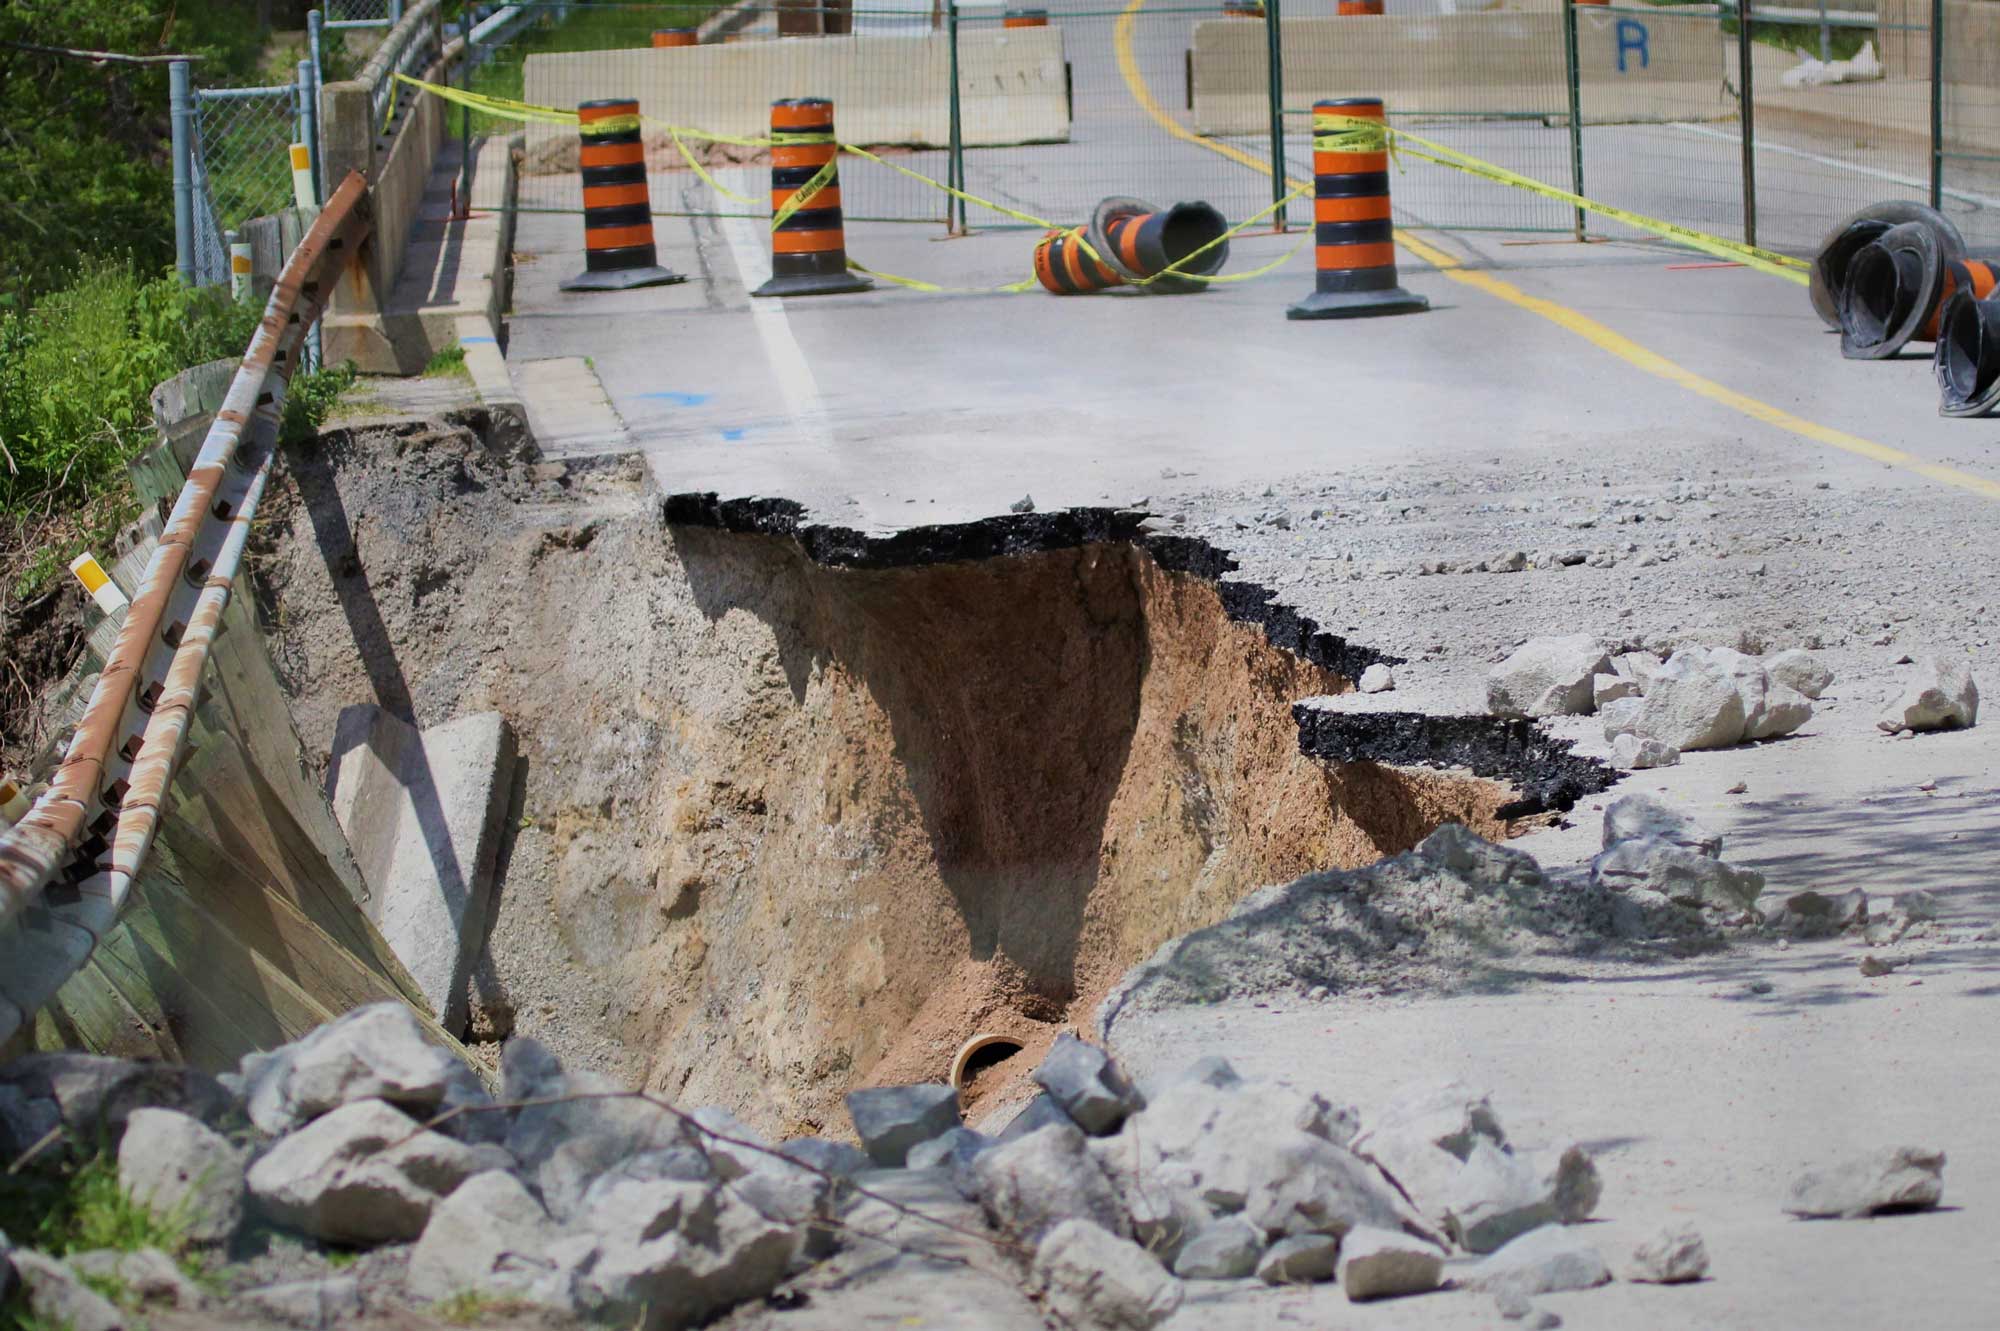
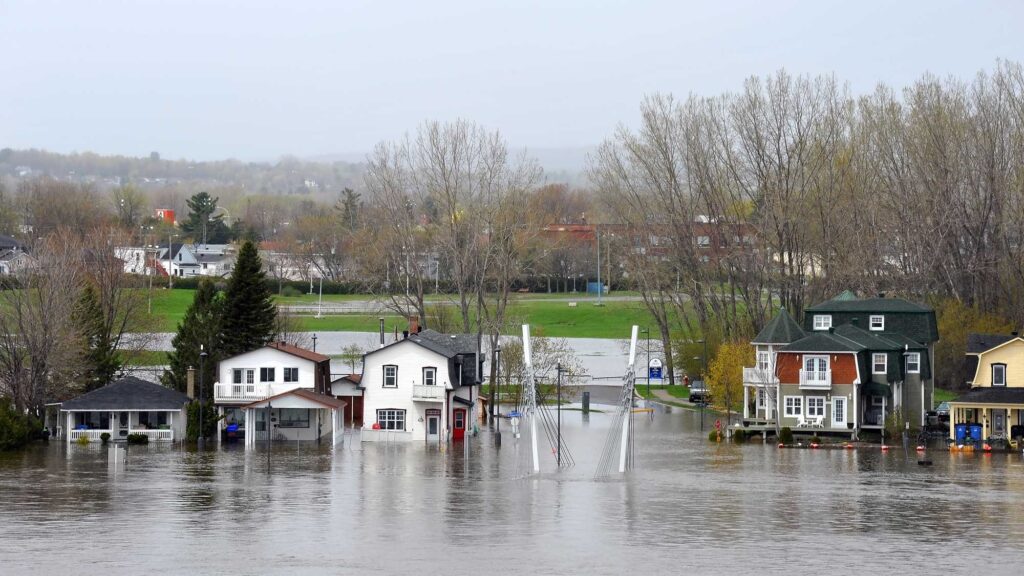
Short-duration high-intensity storm causing damaging flooding
Long-duration lower-intensity stormwater seeping into the soil and impacting infrastructure stability

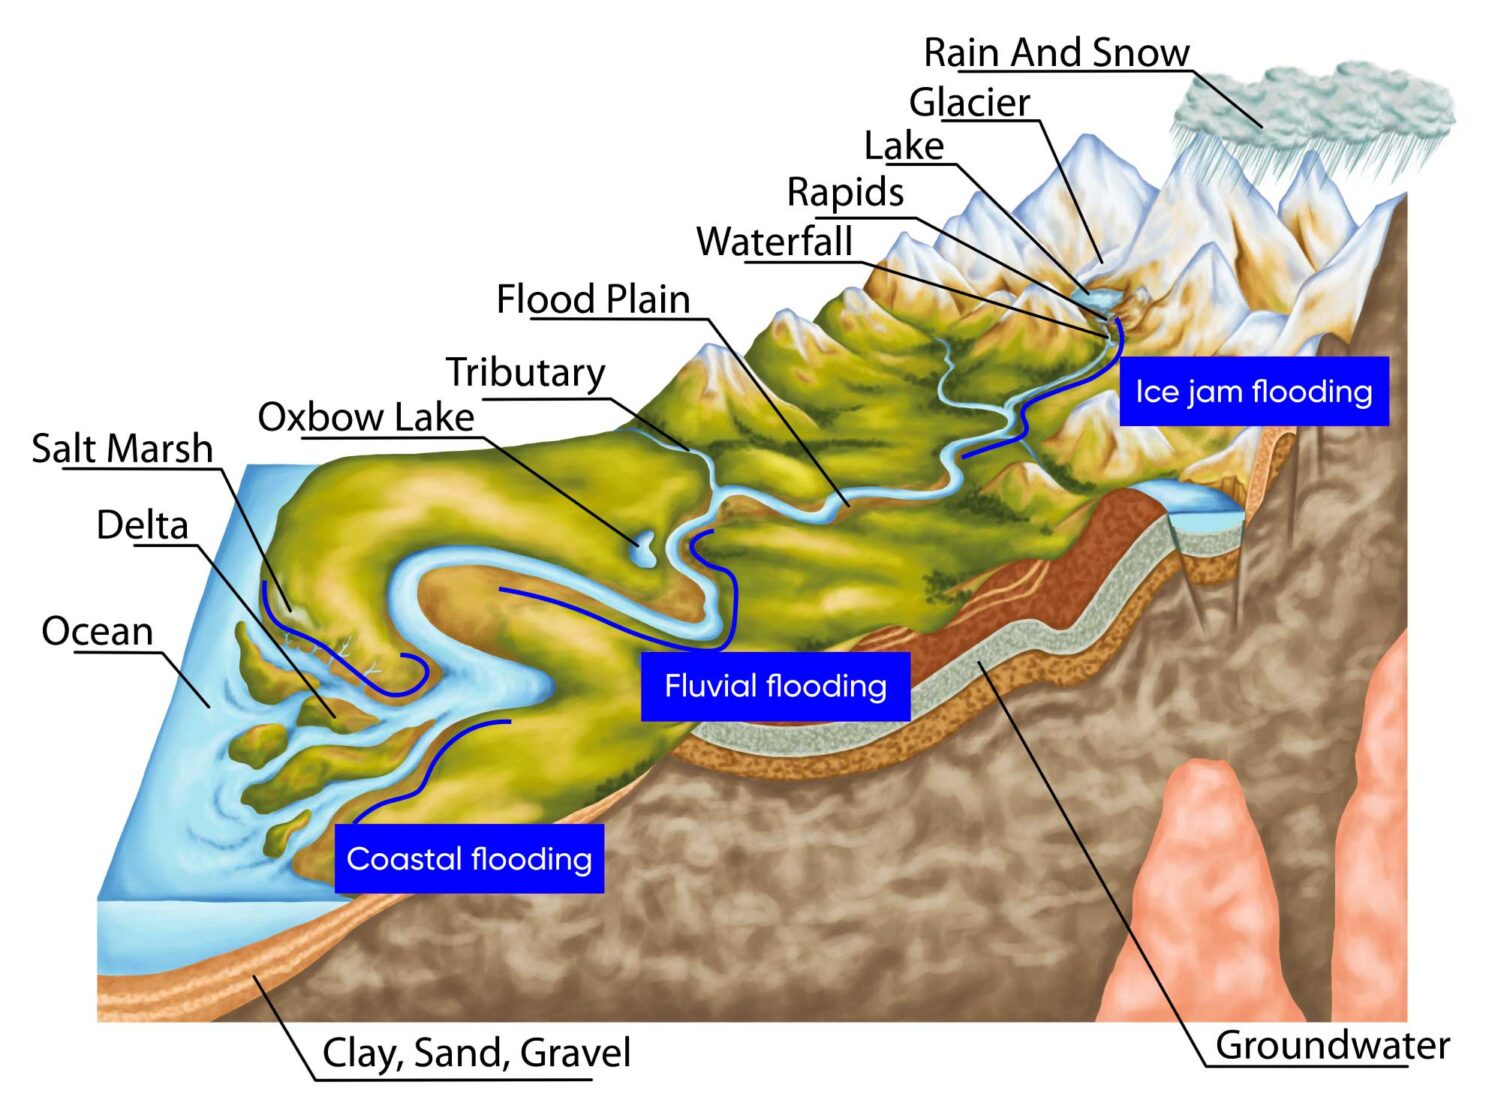
Understand other hydrologic processes that can contribute to flood events. IDF curves are excellent sources of extreme rainfall information for assessing direct rainfall-caused flooding.  However, they do not provide information for other flood mechanisms. For example, late-winter snowmelt and rain-on-snow events influence river and lake flooding, and marine storms and sea level change trends influence coastal flooding.  IDF curves do not provide information that is directly related to these types of floods.

Understand how the information on rainfall durations and intensities contained in IDF curves relates to actual storm and weather events. IDF curves are based on the single largest annual maximum event for a particular duration each year. This means that other flood-causing rainfall events – for example, concurrent extreme rainfall events associated with atmospheric rivers or hurricanes may not be represented in typical IDF graphs (however, specialized 1 to 30-day IDF curves may capture this type of information). Users can obtain underlying precipitation data to develop custom IDF curves via the Engineering Climate Datasets.


Select sites with long data records when possible and appropriate. Confidence in IDF data is lower for sites with shorter rainfall record lengths. The confidence limits that are sometimes displayed on IDF plots are a statistical measure used to indicate the uncertainty inherent in estimated values of rainfall intensity across different return periods and durations. Wider confidence intervals suggest lower confidence in IDF curve values, typically caused by fewer years of rainfall data or longer return periods. Generally, confidence in IDF curve information is highest for shorter return periods, and for sites with long rainfall records.

Keep in mind that IDF curves represent rainfall at specific measurement locations.  If your project is far from a location that provides IDF curves, more analysis may be needed ensure that the data are appropriate for your site. For example, practitioners should understand how the elevation of their project site differs from the nearest IDF site’s elevation and what this might mean for IDF curve translation to site.  To learn more about which factors to consider when selecting a site for your project, please refer to the CSA PLUS 4013:2019.

Understand that return period terminology does not imply regular occurrences of extreme events. For example, the term ‘1-in-25 year’ rainfall does not imply that a rainfall of this magnitude occurs regularly every 25 years. Instead, it means that a rainfall event of this magnitude has a 1-in-25 (4%) chance of occurring in any given year. Indeed, it is possible to have 1-in-25 year events in consecutive years, or, not at all for 30 years.

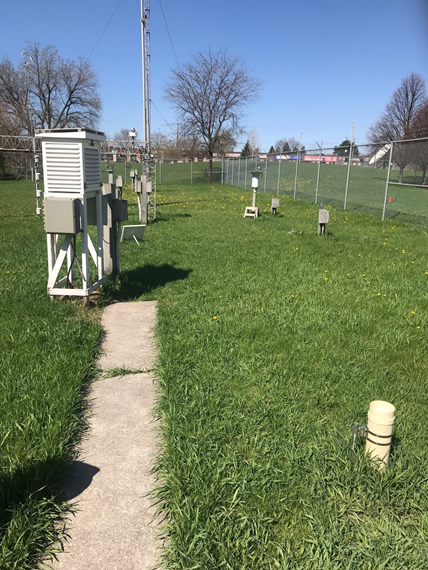
Be aware that IDF curves typically do not include winter precipitation. Tipping bucket rain gauges are deactivated during the “snow season” because snow can fall on the gauge one day and then upon melt, be recorded incorrectly as rainfall.  The deactivation period of the year depends on the region. For example, sites along the BC coast may run all year while most stations elsewhere are closed for at least some winter periods. If you would like to know the activation period for a particular site, please contact the Engineering Climate Services Unit at [email protected].

Now that you have completed reading Best Practices for Using IDF Curves, you may be interested in IDF Curves and Climate Change.

For any questions about using climate data and information, please contact the Climate Services Support Desk.