Extreme heat waves in Québec

One of the uncontested consequences of climate change is an increase in the frequency and intensity of heat waves. In Québec, various monitoring, planning and response activities have been implemented to ensure prevention of health impacts and improve emergency preparedness.

Summary

One of the uncontested consequences of climate change is an increase in the frequency and intensity of heat waves, which can have significant impacts on population health, such as heatstroke, cardiovascular and respiratory problems, and even death; mental health issues are also a significant factor during heat waves. In Québec, various monitoring, planning and response activities have been implemented to ensure prevention of health impacts and improve emergency preparedness.

Background

In Québec, an extreme heat wave is defined as a period of 3 consecutive days during which the 3-day weighted moving average maximum and minimum temperatures reach predefined temperature thresholds that are based on expected excess mortality1.

Depending on the region, these thresholds vary between 31°C and 33°C for maximum temperatures and 16°C and 20°C for minimum temperatures2. However, emergency plans are activated much earlier, according to predetermined levels for each region.

To estimate the impact of an extreme heat wave on population health, the number of deaths, hospitalizations, emergency admissions and ambulance transports reported during the heat wave is analyzed to see whether it is higher than the historical average over the previous five years for similar non-extreme-heat periods. The period of interest includes a latency period of 3 days following the end of the heat wave3.

A health impact analysis1 showed that during the summer of 2018, the hottest summer on record in 146 years of meteorological observations in southern Québec4, 86 possibly heat-related excess deaths were reported across the nine regions affected by the heat wave. Significant increases in hospitalizations, ambulance transports and emergency admissions were also observed in several regions. The main meteorological features of the 2018 heat wave are presented in Table 1.

Table 1: Main characteristics of 2018’s extreme heat wave.

Main features of the 2018 heat wave in Quebec province. The heat wave lasted 6 days in Montreal and the average maximum and minimum temperatures during those days reached 33.7°C and 22.1°C respectively. 

Adapted from : Lebel G, Dubé M, Bustinza R. (2019) Surveillance des impacts des vagues de chaleur extrême sur la santé au Québec à l’été 2018, INSPQ. En ligne: https://www.inspq.qc.ca/bise/surveillance-des-impacts-des-vagues-de-chaleur-extreme-sur-la-sante-au-quebec-l-ete-2018#ref

Adapted from : Lebel G, Dubé M, Bustinza R. (2019) Surveillance des impacts des vagues de chaleur extrême sur la santé au Québec à l’été 2018, INSPQ. En ligne: https://www.inspq.qc.ca/bise/surveillance-des-impacts-des-vagues-de-chaleur-extreme-sur-la-sante-au-quebec-l-ete-2018#ref

However, these impacts on mortality and morbidity are smaller than those experienced in July 2010, when a significant increase of 33% in mortality (about 280 excess deaths) and a 4% increase in emergency admissions (about 3,400 excess admissions) were recorded5. The health impacts were, in fact, greater in the summer of 2010 than in 2018. This is illustrated in Figure 1 which shows the mortality rates ratio for these two summers. The mortality rate ratio compares the mortality rate during a heat wave event with the mortality rate at the same time of year, with no heat waves occurring, over the previous five years. Ratio values greater than 1 indicate excess deaths, while ratios less than one indicate reduced mortality.

Figure 1: Mortality rate ratios during the extreme heat waves of 2010 and 2018.

Comparison of mortality rate ratios (see text for explanation) for the two heat wave years 2010 and 2018 by health region.

Adapted from : Lebel G, Dubé M, Bustinza R. (2019) Surveillance des impacts des vagues de chaleur extrême sur la santé au Québec à l’été 2018, INSPQ. En ligne: https://www.inspq.qc.ca/bise/surveillance-des-impacts-des-vagues-de-chaleur-extreme-sur-la-sante-au-quebec-l-ete-2018#ref

Adapted from : Lebel G, Dubé M, Bustinza R. (2019) Surveillance des impacts des vagues de chaleur extrême sur la santé au Québec à l’été 2018, INSPQ. En ligne: https://www.inspq.qc.ca/bise/surveillance-des-impacts-des-vagues-de-chaleur-extreme-sur-la-sante-au-quebec-l-ete-2018#ref

Adaptation strategies

First, the number of households with air conditioning has increased over the last 10 years. A comprehensive population survey conducted in 20116 in underprivileged neighbourhoods in Québec’s nine largest cities showed that only 49.5% had an air conditioner in the home, usually a stand-alone unit in one room of the dwelling. The Statistics Canada Households and the Environment survey showed that, across the metropolitan area of Montréal, the proportion of households with an air conditioner increased from 54% in 2009 to 65% in 2015, and is possibly higher today.

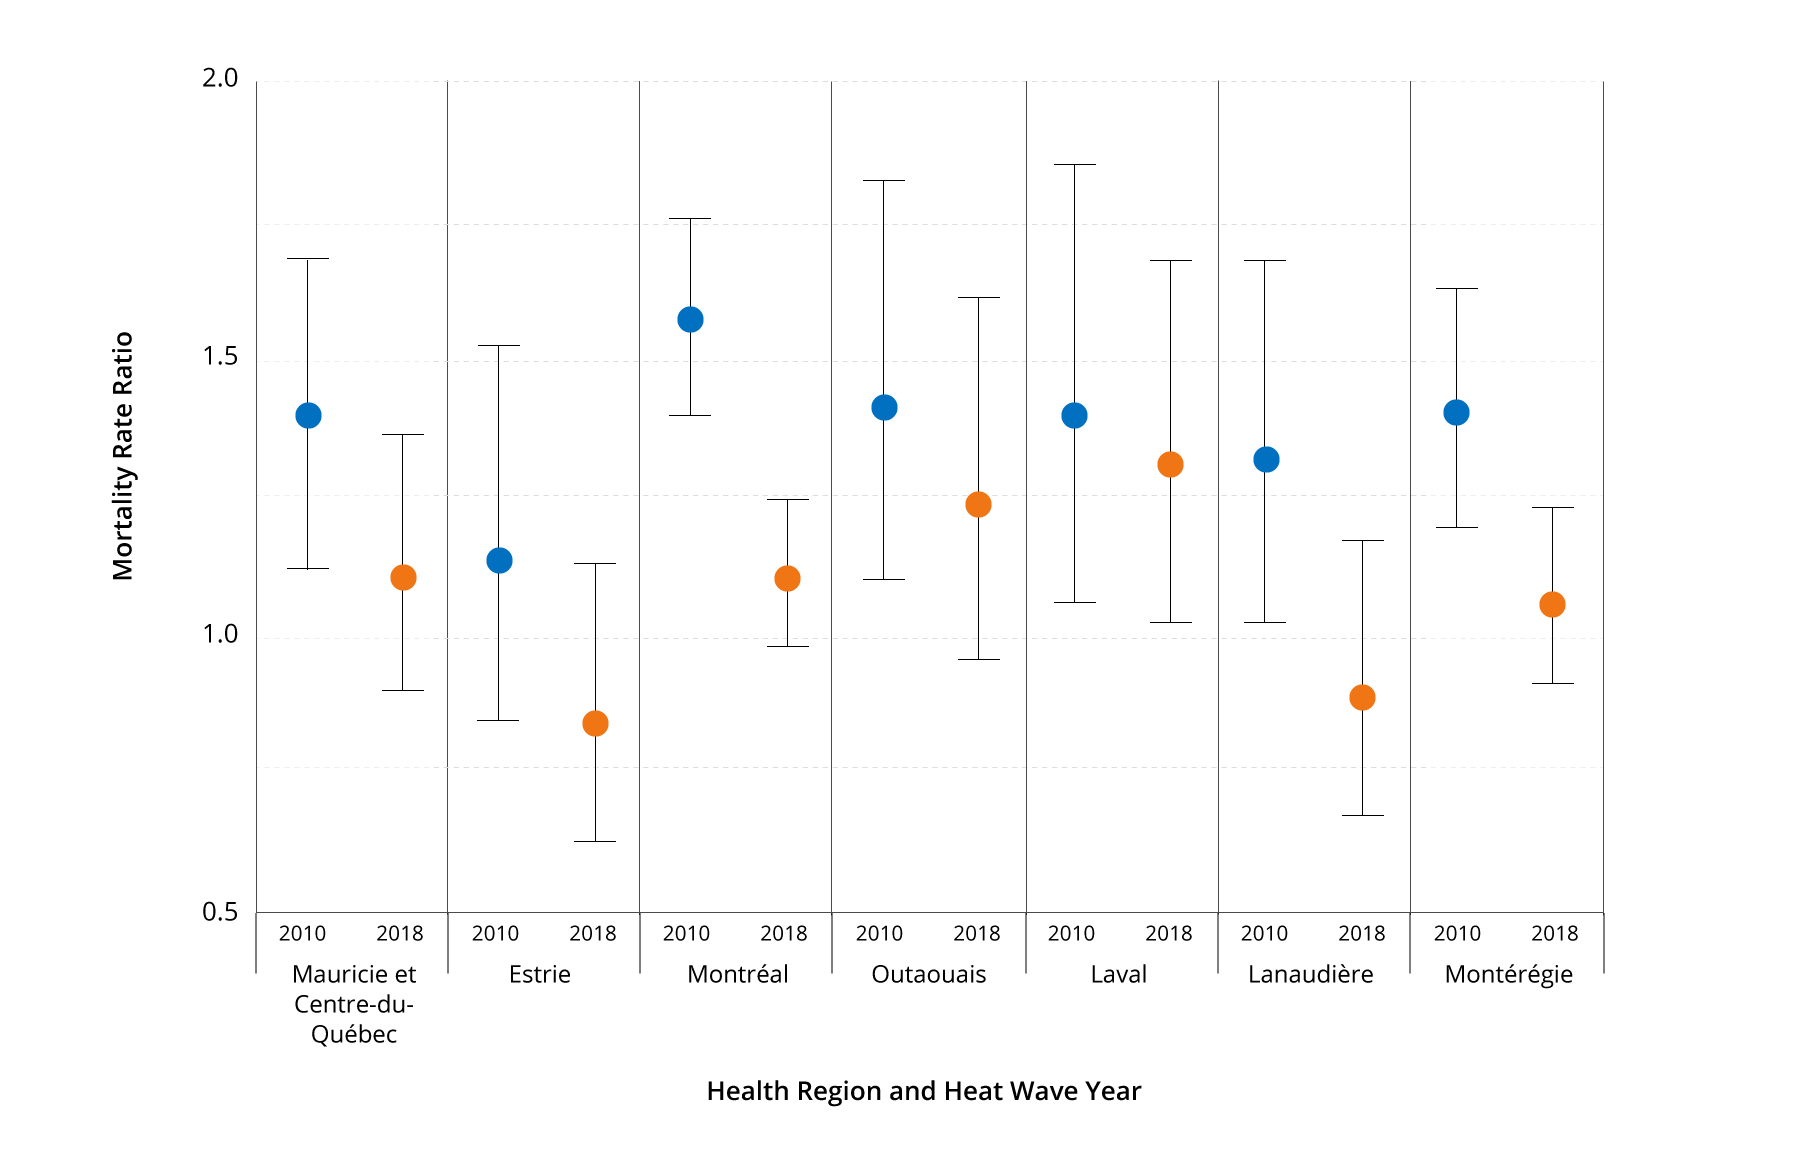
Various public health initiatives are also helping to reduce mortality during heat waves, despite the fact that the proportion of seniors – a vulnerable group – has doubled in Québec over the same period. These initiatives are led by cities, private and public organizations, and public health authorities. Preventive interventions begun in 2004 have been intensified towards high-risk groups (hospitals, seniors’ residences, the homeless, high-risk neighbourhoods) since 2010 in the province’s most vulnerable regions7, 8.

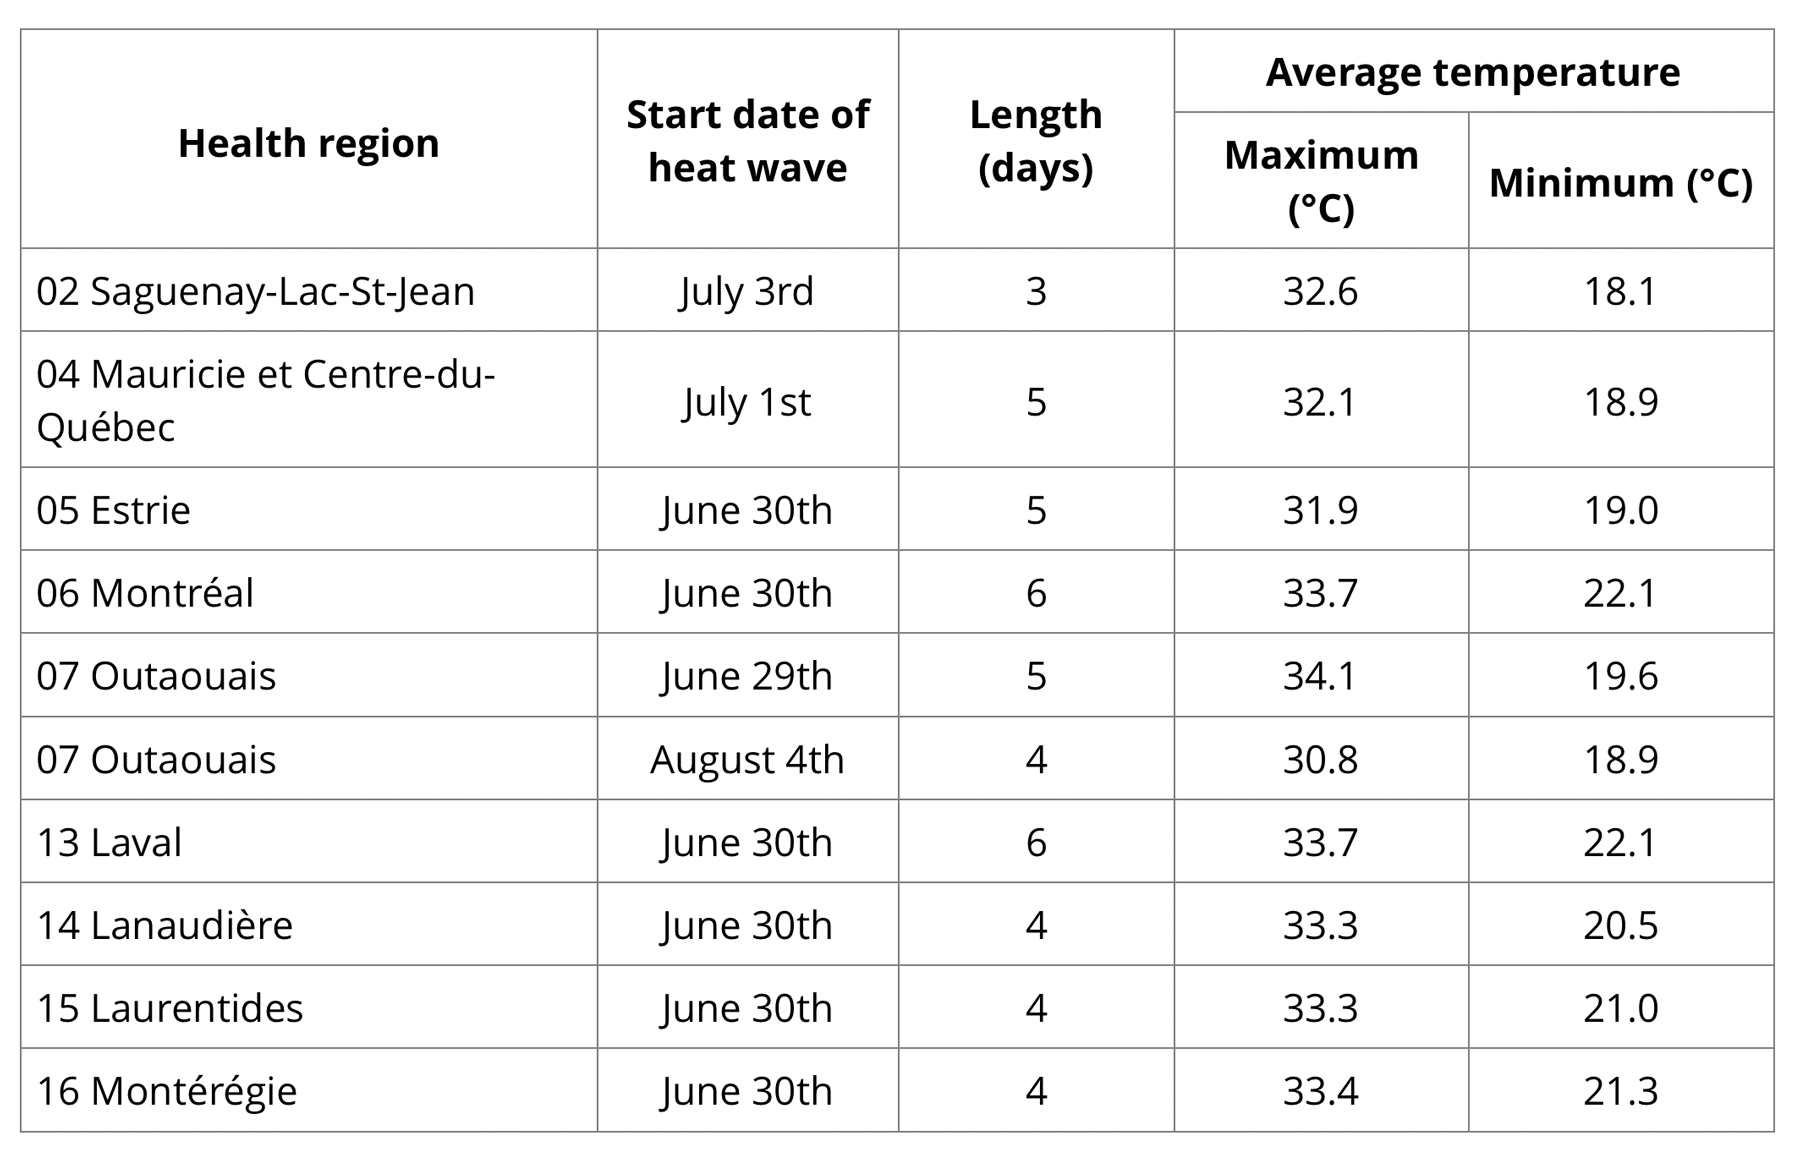
Since 2010, public health interventions have been largely based on an annual report on the health impacts of extreme heat waves in Québec produced by the Institut national de santé publique du Québec (INSPQ) (only for years with heat waves, namely 2010, 2011, 2012, 2018).

Since 2010, the INSPQ has implemented the SUPREME system for the monitoring and prevention of health impacts of extreme meteorological events. SUPREME identifies areas at risk and sends extreme heat warnings to public health authorities to initiate emergency actions as needed, as well as other relevant warnings issued by the Meteorological Service of Canada (MSC).

Of the 98 heat waves observed during the summers from 2010 to 2016, 47 were predicted by the SUPREME extreme heat warnings, and 51 were missed, mainly due to the inherent uncertainty of weather forecasts received from MSC. Nevertheless, the overall performance of the SUPREME extreme heat warnings is judged to be good9 and the system’s users consider it to be “very useful”10.

The fight against urban heat islands is also picking up momentum in Québec through various urban greening initiatives. Among other things, the INSPQ has produced an interactive map of heat and cool islands across the province. In addition, the health component of the Québec climate change action plan has subsidized more than one hundred projects through more than $35 million of funding over the past 10 years, and many cities and private organization are doing the same, causing this amount to triple. A performance study of projects to reduce urban heat islands in the Montréal region shows that some projects have achieved a noticeable cooling effect11.

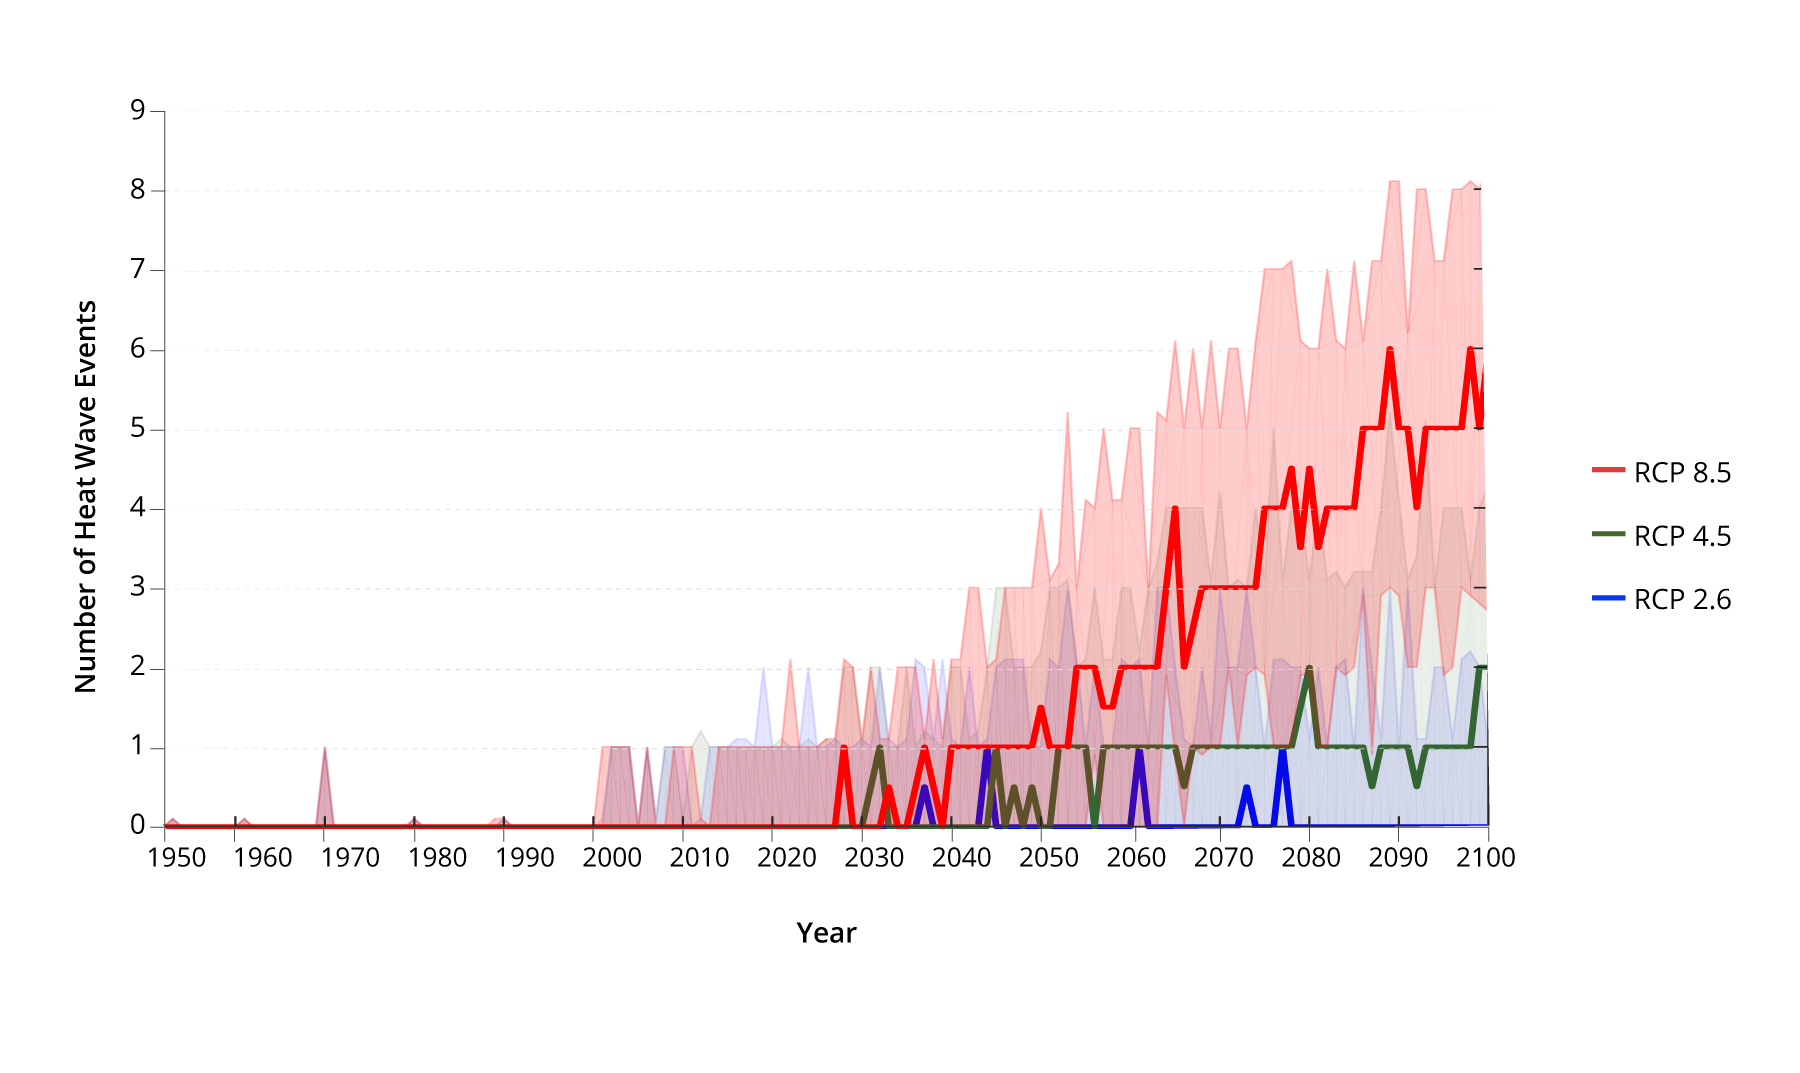
Climate models are useful for determining plausible temperature increases and estimating the intensity and frequency of future heat events. These projections can be used to develop adaptation strategies aimed at reducing the morbid effects of extreme heat (dehydration, hyperthermia and heatstroke, heart failure, respiratory problems, etc.) and heat-related mortality. The heat wave variable in the analysis page can be used to estimate the duration and frequency of heat waves in the future using specific temperature thresholds for a particular location.  Figure 2 presents the evolution (from 1950 to 2100) of the number of extreme heat wave events in the Montréal area using thresholds of 30°C for maximum temperature and 22°C for minimum temperature.

Climate scenarios will also be useful in choosing the best species to plant for urban greening based on future precipitation and growing degree-days, as well as for determining improvements to housing that will become necessary and be beneficial for population health and quality of life.

Figure 2: Evolution of the number of heat waves simulated for Montreal, 1950-2100.

Number of heat wave events, 1950-2100, for Montreal, as simulated by 24 climate models in the BCCAQv2 dataset. The thresholds defining a heat wave event for Montreal are three or more consecutive days where the minimum temperature is greater than 22°C and maximum temperature is greater than 30°C. Bold lines indicate median values and the range (indicated by coloured shading) for each RCP is defined by the 10th and 90th percentile values. These data were calculated using the Heat Wave Analysis Tool.

Key takeaways

  • One of the consequences of climate change is an increase in the frequency and intensity of heat waves, which have significant impacts on population health.
  • The health impacts were greater in the summer of 2010 than in 2018, with a 33% increase in mortality (280 excess deaths). In 2018, 86 possible heat-related excess deaths were reported across the nine regions affected by heat waves.
  • Various public health initiatives are helping to reduce the adverse effects of heat waves, including the monitoring of deaths and hospitalizations during extreme heat events, the issuing of extreme heat warnings, cross-sector coordination of emergency plans, reducing urban heat islands, and the use of climate projections to inform the decisions made by public health and urban planning officials.

References

1 Lebel G, Dubé M, Bustinza R. (2019) Surveillance des impacts des vagues de chaleur extrême sur la santé au Québec à l’été 2018, INSPQ. Online: https://www.inspq.qc.ca/bise/surveillance-des-impacts-des-vagues-de-chaleur-extreme-sur-la-sante-au-quebec-l-ete-2018#ref

2 Chebana F, Martel B, Gosselin P, Ouarda T, Giroux JX. A general and flexible methodology to define thresholds for heat health watch and warning systems, applied to the province of Québec (Canada). International Journal of Biometeorology. Oct. 2012. Epub DOI : 10.1007/s00484-012-0590-2

3 Lebel G, Bustinza R, Dubé M (2019) Analyse des impacts des vagues régionales de chaleur extrême sur la santé au Québec de 2010 à 2015, INSPQ, 2017. Online: https://www.inspq.qc.ca/sites/default/files/publications/2221_impacts_vagues_chaleur_extreme_sante.pdf

4 Ministère de l’Environnement et de la Lutte contre les changements climatiques [Online]. Québec : Gouvernement du Québec; 2019. Septembre 2018 : l’été le plus chaud en 146 ans d’observations au sud du Québec se confirme. Online: http://www.environnement.gouv.qc.ca/climat/Faits-saillants/2018/septembre.htm

5 Bustinza et al.: Health impacts of the July 2010 heat wave in Québec, Canada. BMC Public Health 2013 13:56. Online: https://bmcpublichealth.biomedcentral.com/articles/10.1186/1471-2458-13-56

6 Bélanger D, Gosselin P, Abdous B, Valoir P, (2016) La climatisation à domicile dans les secteurs les plus défavorisés des grands centres urbains du Québec, INSPQ. Online: https://www.inspq.qc.ca/bise/resume-la-climatisation-domicile-dans-les-secteurs-les-plus-defavorises-des-grands-centres-urbains-du-quebec

7 Centre intégré universitaire de santé et de services sociaux du Centre-Sud-de-l’île-de-Montréal. Canicule: juillet 2018 – Montréal, Bilan préliminaire. Montréal : Centre intégré universitaire de santé et de services sociaux du Centre-Sud-de-l’île-de-Montréal; 2018. Online: https://santemontreal.qc.ca/fileadmin/fichiers/actualites/2018/07_juillet/BilanCanicule2018.pdf

8 The Montreal heat response plan: evaluation of its implementation towards healthcare professional and vulnerable populations. Online: https://www.ncbi.nlm.nih.gov/pubmed/29981064

9 Bustinza R,  Lebel G,  Dubé M, Évaluation de la performance des avertissements de chaleur extrême par le système SUPREME de 2010 à 2016, INSPQ. Online: https://www.inspq.qc.ca/sites/default/files/publications/2291_evaluation_performance_avertissement_chaleur_supreme.pdf

10 Gosselin P, Bustinza R, (2016) INSPQ, Impacts organisationnels de SUPREME. Online: https://adaptationcanada2016.ca/wp-content/uploads/2016/04/W2B-Gosselin.pdf

11 Environnement Canada (2014). Étude de performance de projets de lutte aux îlots de chaleur urbains dans la région de Montréal, Service météorologique du Canada – Région du Québec (SMC-QC), 142 pages