Climate Change and Strong Winds

Introduction

Strong winds can damage buildings, disrupt industries like construction and wind power generation, and lead to higher insurance costs.[1]  Many users of climate services are interested in the effect of climate change on the frequency and intensity of high-wind events. Between 2018 and 2024, the CCCS Support Desk received almost 300 requests for future projections of wind speed. Unfortunately, climate change projections of wind speed for Canada, suitable for informing adaptation actions, are limited. This blog examines how wind speeds in Canada may be affected by a warming climate, with a focus on the main weather systems that cause extreme winds. The blog also describes some of the limitations associated with historical and future wind datasets, with a particular focus on the utility of these data for climate change risk assessments. Special attention is given to confidence levels for projected changes in wind speeds, as confidence in future projections of high wind speed events is generally lower than for variables such as temperature and precipitation.

Weather Systems that Cause Strong Winds

In Canada, extreme winds primarily arise from two types of weather systems: extratropical cyclones (ETCs) and convective storms. These systems occur under different weather conditions. Climate change affects the frequency and intensity of the weather conditions that can lead to ETCs and convective storms. For more details about winds that arise from these two types of storms, including how they are affected by climate change, check out the boxes below.

Extratropical Cyclones (ETCs)

What are ETCs?

An ETC is a large-scale, rotating weather system centered on an area of low atmospheric pressure. ETCs are very large storms, usually around 1000 km in size. They typically form during the colder months. These systems are major contributors to strong wind events in Canada, as well as heavy precipitation events.

ETCs develop because of the strong north-south temperature differential between polar and tropical regions. This temperature contrast creates a large-scale source of energy in the middle latitudes (40ºN to 60ºN). Small disturbances in the atmosphere can draw from this energy to grow into large-scale storms called ETCs.

ETC winds and climate change

As the Arctic warms more quickly than other regions, the north-south temperature contrast is weakening. This is likely to reduce the frequency of ETCs over time, which may lead to fewer strong-wind events overall.[2],[3] Changes in ETC intensity, however, are less certain. ETC intensity could decrease for the same reason that ETCs might become less frequent: reduced available energy from the weaker north-south temperature contrast. However, there is another important mechanism that could cause ETC winds to become stronger. When matter changes from a gaseous to liquid state, energy is released to the surroundings. This happens in ETCs when water vapour condenses into liquid rain. This energy can accelerate the ETC wind speed. As the atmosphere warms under climate change, it can hold more water vapour.  Therefore, there could be more energy available to intensify ETC winds. Studies using high-resolution climate models indicate that additional moisture can intensify ETCs that are already strong. This could potentially lead to more powerful high wind events.[4],[5] Overall, scientific consensus on the impacts of a warming climate on ETC intensity remains mixed: depending on the details considered, climate change could either weaken or strengthen ETC-driven winds.[6],[7]

Convective  Storms

What are convective storms?

Convective storms, including thunderstorms, are the primary source of strong winds in Canada’s warmer months.  Convective storms are more localized than ETCs. They are usually less than 100 km in size.

Convective storm winds and climate change

Convective winds often occur in the form of gusts, which are brief but intense bursts of wind. Research suggests that the frequency of conditions conducive to convective storms is likely to increase as the climate warms.[8]

A Canada-focused study concluded that strong wind gusts (with wind speed exceeding 70 km/h) are likely to become more common in a warming climate.[9] However, the fact that convective storms are often very localized makes them difficult to simulate using global or regional climate models (GCMs and RCMs).  The limited ability of GCMs and RCMs to simulate convective storms means we cannot be certain how much stronger convective winds may become under a warming climate, or if they will change at all.

For more information on this topic, an in-depth analysis of thunderstorms and climate change is available in this blog post.

Tornadoes and hurricanes are also characterized by high wind speeds, but these events are less common in Canada compared to ETCs and convective storms. If you are interested in learning more about these types of extreme weather, check out our blogs on tornadoes and hurricanes.

Wind Data for Canada

Historical Observations

Two main types of observational data of wind speeds are available for Canada. Both are based on weather station observations.  The Adjusted and Homogenized Canadian Climate Data (AHCCD) dataset is a source of high-quality wind speed observational data. You can access AHCCD using the Climate Data Extraction Tool. The AHCCD dataset is quality-controlled to remove any inconsistencies due to non-climatic factors, such as a change in measurement technology. As such, AHCCD is the dataset best suited for assessing long-term trends.  The AHCCD dataset includes monthly mean (average) wind speeds. This periodicity is useful for assessing multiyear, seasonal and annual trends in average winds.  However, monthly mean (average) wind speeds are of limited use for assessing extreme wind speeds, which occur on daily or hourly timescales. Read more about AHCCD observations and how the data is developed.

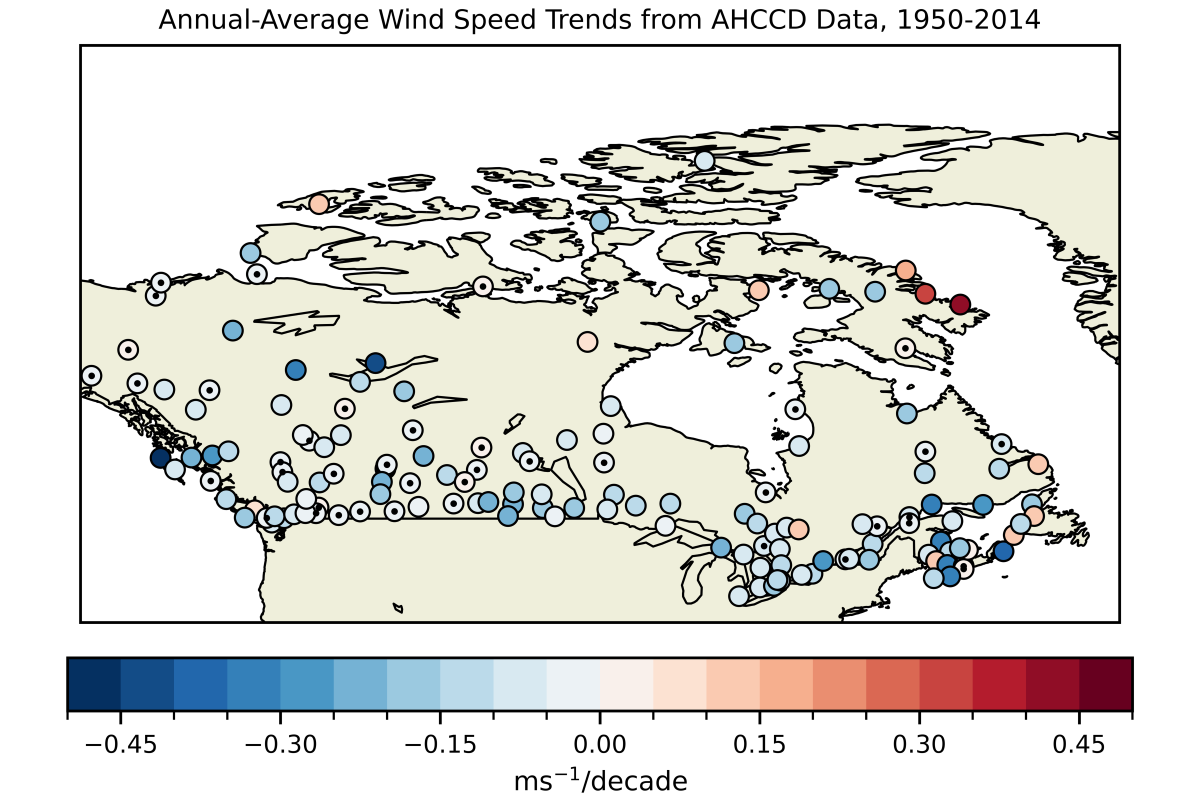
An analysis of AHCCD wind observations from 1950 to 2006 found decreasing trends in average seasonal wind speeds in all seasons over most regions of Canada.[10] The exception was the Arctic, where the data indicated increased average wind speeds in all seasons, and the Maritime region, where seasonal-average wind speeds increased in spring and autumn. The trend of decreased average wind speed in most regions of Canada supports the theory of “Global Terrestrial Stilling”, which describes an overall trend of weaker wind speed over land.[11] However, recent studies challenge this hypothesis and suggest that recently observed wind speed trends are mostly caused by natural climate variability.[12] Therefore it has been difficult to determine whether the trend towards weaker wind speed is influenced by human-induced climate change.

Research shows mixed trends in Canada’s historical wind speeds: while observational data shows that wind speeds have decreased in most regions of Canada since middle of last century, parts of Northern and Atlantic Canada have seen increased wind speeds.

high wind fig 1

Figure: Trends (m/s per decade) in annual average wind speed over the period 1950-2014 from the AHCCD wind speed observations. Blue colors indicate decreasing wind speeds, red colours indicate increasing trends. Markers with dots are stations where the historical trends are small compared to variability (not statistically significant).

The second type of wind speed data is unadjusted, or “raw” weather station observations. This data can be used to assess extreme wind speeds since hourly and daily data are available. Raw station data is not adjusted using the homogenization procedure applied to AHCCD.  For most stations, this data can be accessed using the Climate Data Extraction Tool. Read more about how to access hourly data at all available stations.

Hourly station observations have been used to assess historical trends of extreme wind speed in Canada. The results indicate increases in extreme wind speeds in the North and minor decreases in most other Canadian cities. However, most analyses of historical extreme wind speeds in Canada find that trends are weak or not robust. [13],[14] Consequently, it is difficult to determine how climate change may be affecting extreme wind speeds.

Reanalysis

Station observations represent historical observations and are limited by the number of stations, the longevity of the stations, and the periodicity of the measurements. Stations are sparsely located in many parts of Canada, especially in Northern Canada.

An alternate source of historical wind speed data is reanalysis. Reanalysis is weather data produced by a weather forecast model that is blended with observations, making it consistent with the real-world historical record and spatially complete. It is available on a regular grid, so no locations are missing. Reanalyses can be used to “fill gaps” where observations are not available. Reanalysis typically has higher spatial resolution than most climate model data because reanalyses are usually produced with weather models, which generally resolve finer spatial scales than climate models. The size of the model  Most Global Climate Models (GCMs) have spatial resolution ranging from 250 km to 100 km, whereas state-of-the art reanalysis have spatial resolution of 30 km or finer.

Several reanalysis datasets exist. The most widely used reanalysis dataset is ERA5 [15], produced by the European Centre for Medium-Range Weather Forecasts (ECMWF). ERA5 provides global hourly data at ~30 km resolution from 1940 until almost the present day (new data is added on a daily basis with a delay of only about 5 days).

The Canadian Surface Reanalysis (CaSR, formerly named RDRS), developed by the Meteorological Research Division at ECCC, focuses on Canada.[16] The CaSR has ~10 km spatial resolution and provides hourly data for the period 1980 to 2018. Read more about the CaSR, including how to access the data.

Like all model outputs, reanalysis data are not always perfectly consistent with observations. Several studies have found that ERA5 wind speed data underestimate extreme values in Canada.[17], [18], [19] The developers of the CaSR note that the average difference between the reanalysis and observed wind speed data (the root mean squared error, or RMSE) is about 2 m/s. This difference is slightly larger in winter and spring, and smaller in summer and autumn. A detailed analysis of extreme winds using the CaSR has not yet been carried out.

Climate Model Projections

Global climate models (GCMs) are important tools for understanding many aspects of the future climate, but they are not ideally suited to simulate near-surface wind speed, in part due to their coarse spatial resolution (100 km to 250 km). Many of the processes driving extreme winds, such as convection, require spatial resolution of 4 km or smaller to be modelled directly.[8]  GCMs also tend to underestimate the frequency of intense ETCs compared to higher-resolution models.[21],[22]

To refine GCM projections, climate scientists employ downscaling techniques that produce finer-scale information. Statistical downscaling combines high-resolution observational data with data from GCMs. Daily, high-resolution wind speed observations are not available for Canada. This limits the ability to apply statistical downscaling techniques to GCM data.

An alternate approach to statistical downscaling is dynamical downscaling using Regional Climate Models (RCMs). RCMs are similar to GCMs but have finer spatial resolution (smaller grid boxes) and simulate the climate for a limited geographical area, like North America. RCMs combine GCM data with improved representation of topography and physical climate processes. Most available RCM simulations for Canada have spatial resolution between 25 km and 50 km.  Resolution in this range can improve representation of intense ETCs but cannot simulate convective storms.[23] RCMs that directly simulate convective storms require a large amount of computer power to run, so they are primarily used for research purposes only.

Global climate models are designed to project climate change, but are not suited for projecting extreme wind speeds with high skill due to their coarse spatial resolution. As a result, projections of future wind speeds are not consistent between GCMs, and confidence in projections of wind speed is lower than for other variables like temperature. This makes GCM projections of wind speed poorly suited for use in climate change impact and risk assessments.

Regional climate models also produce wind speed projections. RCMs have finer spatial resolution than GCMs but have similar limitations. RCM wind speed data can be suitable for informing long term plans but should be used with caution. For example, it would be prudent to consider the possibility of higher wind speeds in a warming climate, even if RCMs project little or no change to extreme wind speeds.

Where to Find Extreme Wind Projections

Stakeholders may still need to consider how extreme winds might be affected by climate change, even though there is high uncertainty and low confidence in the available projections. One potentially useful tool is the Design Value Explorer (DVE) developed by the Pacific Climate Impacts Consortium (PCIC). The DVE provides projections of design wind pressures for 10-year and 50-year return periods for global warming levels between 0.5 ºC and 3.5 ºC (relative to the 1986-2016 baseline average). The projections have been developed using the regional climate model CanRCM4, bias-adjusted using interpolated station observations. The same data was used to develop the Government of Canada report on Climate-Resilient Buildings and Core Public Infrastructure (the CRBCPI).[24] The DVE and the CRBCPI describe design wind pressure as a “Tier 3” variable, meaning that confidence in projections is very low. The authors recommend taking a cautious approach to estimating how climate risks may change when there is substantial uncertainty. For extreme winds, this means considering the possibility of increased hazards, especially since there are multiple ways by which climate change could plausibly strengthen extreme winds.

Recognizing the challenge of providing curated design data, and the need for advisory guidance language on its use, the Canadian Centre for Climate Services (CCCS) undertook work, in close collaboration with the CRBCPI team, to produce a set of Future Building Design Value Summaries.

These summaries, available for over 660 locations in Canada, include many of the future climate design values accessible through PCIC’s Design Value Explorer, including driving wind rain pressure, design snow loads, hot day design temperatures, and more. The summaries incorporate advisory guidance language on how buildings professionals can use the data, including their presentation by levels of global warming, in language designed to align with the release of future standards and codes. The Summaries also include helpful links to sources where readers can find more in-depth guidance.

Read more…

Conclusion

The impact of climate change on extreme winds at locations across Canada is difficult to quantify explicitly due to the complexity of atmospheric processes and limitations of climate models. There is evidence to indicate that some weather systems, such as ETCs and convective storms, could become stronger with climate change, though it’s unclear if extreme winds will become more frequent or intense as a result. Improved models and high-resolution simulations may reduce uncertainty over time. Tools like the Design Value Explorer offer current estimates of future wind pressures, helping stakeholders assess potential risks and prepare for the possibility of stronger winds. Considering the low level of confidence in wind projections, it is prudent to plan for possibility of increases in wind extremes in future, even in locations where current projections indicate little to no increase.

References

[1] Sandink, D., Kopp, G., Stevenson, S., & Dale, N. (2019). Increasing High Wind Safety for Canadian Homes: A Foundational Document for Low-Rise Residential and Small Buildings (62; ICLR Research Paper Series, p. 128). Institute for Catastrophic Loss Reduction.

[2] Wang, X. L., Wan, H., & Swail, V. R. (2006). Observed Changes in Cyclone Activity in Canada and Their Relationships to Major Circulation Regimes. Journal of Climate, 19(6), 896–915. https://doi.org/10.1175/JCLI3664.1

[3] Priestley, M. D. K., & Catto, J. L. (2022). Future changes in the extratropical storm tracks and cyclone intensity, wind speed, and structure. Weather and Climate Dynamics, 3(1), 337–360. https://doi.org/10.5194/wcd-3-337-2022

[4] Booth, J. F., Wang, S., & Polvani, L. (2013). Midlatitude storms in a moister world: Lessons from idealized baroclinic life cycle experiments. Climate Dynamics, 41(3–4), 787–802. https://doi.org/10.1007/s00382-012-1472-3

[5] Sinclair, V. A., Rantanen, M., Haapanala, P., Räisänen, J., & Järvinen, H. (2020). The characteristics and structure of extra-tropical cyclones in a warmer climate. Weather and Climate Dynamics, 1(1), 1–25. https://doi.org/10.5194/wcd-1-1-2020

[6] Kar-Man Chang, E. (2018). CMIP5 Projected Change in Northern Hemisphere Winter Cyclones with Associated Extreme Winds. Journal of Climate, 31(16), 6527–6542. https://doi.org/10.1175/JCLI-D-17-0899.1

[7] Seiler, C., & Zwiers, F. W. (2016). How will climate change affect explosive cyclones in the extratropics of the Northern Hemisphere? Climate Dynamics, 46(11–12), 3633–3644. https://doi.org/10.1007/s00382-015-2791-y

[8] Prein, A. F. (2023). Thunderstorm straight line winds intensify with climate change. Nature Climate Change, 13(12), 1353–1359. https://doi.org/10.1038/s41558-023-01852-9

[9] Cheng, C. S., Lopes, E., Fu, C., & Huang, Z. (2014). Possible Impacts of Climate Change on Wind Gusts under Downscaled Future Climate Conditions: Updated for Canada. Journal of Climate, 27(3), 1255–1270. https://doi.org/10.1175/JCLI-D-13-00020.1

[10] Wan, H., Wang, X. L., & Swail, V. R. (2010). Homogenization and Trend Analysis of Canadian Near-Surface Wind Speeds. Journal of Climate, 23(5), 1209–1225. https://doi.org/10.1175/2009JCLI3200.1

[11] Vautard, R., Cattiaux, J., Yiou, P., Thépaut, J.-N., & Ciais, P. (2010). Northern Hemisphere atmospheric stilling partly attributed to an increase in surface roughness. Nature Geoscience, 3(11), 756–761. https://doi.org/10.1038/ngeo979

[12] Zeng, Z., Ziegler, A. D., Searchinger, T., Yang, L., Chen, A., Ju, K., Piao, S., Li, L. Z. X., Ciais, P., Chen, D., Liu, J., Azorin-Molina, C., Chappell, A., Medvigy, D., & Wood, E. F. (2019). A reversal in global terrestrial stilling and its implications for wind energy production. Nature Climate Change, 9(12), 979–985. https://doi.org/10.1038/s41558-019-0622-6

[13] Li, S., Irwin, P., Kilpatrick, J., Gibbons, M., & Valerie, S. (2017). A Review of Historical Extreme Wind Speeds in a Changing Climate At Some Major Canadian Cities. Leadership in Sustainable Infrastructure. CSCE Annual Conf. and Annual General Meeting, Montreal. https://legacy.csce.ca/elf/apps/CONFERENCEVIEWER/conferences/2017/pdfs/ENV/FinalPaper_850.pdf

[14] Leung, A. C. W., Gough, W. A., Butler, K. A., Mohsin, T., & Hewer, M. J. (2022). Characterizing observed surface wind speed in the Hudson Bay and Labrador regions of Canada from an aviation perspective. International Journal of Biometeorology, 66(2), 411–425. https://doi.org/10.1007/s00484-020-02021-9

[15] Hersbach, H., Bell, B., Berrisford, P., Hirahara, S., Horányi, A., Muñoz‐Sabater, J., Nicolas, J., Peubey, C., Radu, R., Schepers, D., Simmons, A., Soci, C., Abdalla, S., Abellan, X., Balsamo, G., Bechtold, P., Biavati, G., Bidlot, J., Bonavita, M., … Thépaut, J. (2020). The ERA5 global reanalysis. Quarterly Journal of the Royal Meteorological Society, 146(730), 1999–2049. https://doi.org/10.1002/qj.3803

[16] Gasset, N., Fortin, V., Dimitrijevic, M., Carrera, M., Bilodeau, B., Muncaster, R., Gaborit, É., Roy, G., Pentcheva, N., Bulat, M., Wang, X., Pavlovic, R., Lespinas, F., Khedhaouiria, D., & Mai, J. (2021). A 10 km North American precipitation and land-surface reanalysis based on the GEM atmospheric model. Hydrology and Earth System Sciences, 25(9), 4917–4945. https://doi.org/10.5194/hess-25-4917-2021

[17] Betts, A. K., Chan, D. Z., & Desjardins, R. L. (2019). Near-Surface Biases in ERA5 Over the Canadian Prairies. Frontiers in Environmental Science, 7, 129. https://doi.org/10.3389/fenvs.2019.00129

[18] Morris, M., Kushner, P. J., Moore, G. W. K., & Mercan, O. (2023). Atmospheric Circulation Patterns Associated with Extreme Wind Events in Canadian Cities. Journal of Climate, 36(13), 4443–4460. https://doi.org/10.1175/JCLI-D-22-0719.1

[19] Chen, T., Collet, F., & Di Luca, A. (2024). Evaluation of ERA5 precipitation and 10‐m wind speed associated with extratropical cyclones using station data over North America. International Journal of Climatology, 44(3), 729–747. https://doi.org/10.1002/joc.8339

[21] Jiaxiang, G., Shoshiro, M., Roberts, M. J., Haarsma, R., Putrasahan, D., Roberts, C. D., Scoccimarro, E., Terray, L., Vannière, B., & Vidale, P. L. (2020). Influence of model resolution on bomb cyclones revealed by HighResMIP-PRIMAVERA simulations. Environmental Research Letters, 15(8), 084001. https://doi.org/10.1088/1748-9326/ab88fa

[22] Seiler, C., Zwiers, F. W., Hodges, K. I., & Scinocca, J. F. (2018). How does dynamical downscaling affect model biases and future projections of explosive extratropical cyclones along North America’s Atlantic coast? Climate Dynamics, 50(1–2), 677–692. https://doi.org/10.1007/s00382-017-3634-9

[23] Pryor, S. C., Nikulin, G., & Jones, C. (2012). Influence of spatial resolution on regional climate model derived wind climates. Journal of Geophysical Research: Atmospheres, 117(D3), 2011JD016822. https://doi.org/10.1029/2011JD016822

[24] Cannon, A. J., Jeong, D. I., Zhang, X., & Zwiers, F. (2020). Climate-resilient buildings and core public infrastructure 2020: An assessment of the impact of climate change on climatic design data in Canada (En4-415/2020E-PDF). Environment and Climate Change Canada. publications.gc.ca/pub?id=9.893021&sl=0