Exploring the new Fire Weather Projections App through three mini case studies

Note: This article was written before the wildfire events that severely impacted multiple communities across Canada, including areas around Jasper National Park during the summer of 2024.  While long-term fire weather projections are not directly relevant to the immediate management of these crises, these events highlight the importance of these data for understanding and mitigating future risks.

Introducing the Fire Weather App: Quick Start

Many regions of Canada are witnessing increased wildfire activity due to climate change. In 2023, a record 15 million hectares of land burned across Canada, an area roughly the size of New Brunswick, Nova Scotia, and seven Prince Edward Islands combined (Figure 1), or about nine times the annual average since 1990 [1].

As the risk of wildfires increases with Canada’s changing climate, there is an urgent need to prepare for and adapt to more frequent and intense wildfires. Recently, ClimateData.ca launched a Fire Weather Projections Application, providing access to long-term future projections of various fire weather components to inform planning.

Ready to jump right in? Try out the new Fire Weather App today.

This article introduces the app’s Quick Start section. Here, we demonstrate how to navigate through the app. Next, we dive into the data and explain how to interpret the data through three mini-case studies.

Figure 1: The total area burned from the 2023 wildfire season in Canada was about 15 million hectares, which is equivalent to one New Brunswick, one Nova Scotia, and nine Prince Edward Islands. See Natural Resources Canada, https://natural-resources.canada.ca/simply-science/canadas-record-breaking-wildfires-2023-fiery-wake-call/25303, for more information.

Important information to know before using the new Fire Weather Projections App

“Quick Start” versus “Deep Dive”

The app offers two levels of analysis: “Quick Start” and “Deep Dive”.

Quick Start:  The Quick Start section allows you to explore historical and future fire season length, fire weather severity, and fire weather frequency across most of the country. All maps in this section compare two 30-year time periods: 1971-2000 and 2041-2070. Only the highest emissions scenario (RCP8.5) is referenced here.

Deep Dive: If you are looking to download data for a particular area, compute a custom threshold for a specific fire weather component, analyze changes across additional future time periods, or study changes across three emissions scenarios, then you will want to visit the “Deep Dive” section. Stay tuned for a future article on the “Deep Dive” section.

Important Caveats

When conducting your analysis, it is important to remember what this application can and cannot do. Developing a full picture of wildfire danger requires considering information from across a range of sources (see Figure 2). Long-term future projections of changes to these factors (e.g., ignition sources and vegetation) have yet to be combined with fire weather into a full picture of evolving fire hazard.

Figure 2: The data in this application provides insight into one important factor related to changing fire regimes: the long-term changes to fire weather caused by climate change. However, ignition sources (e.g., lightning or human-caused fires) and wildfire fuels (e.g., vegetation type) will also be affected over time by climate change or human activities (e.g., logging, farming, or development).


Figure 2: Wildfire danger is determined by climate, ignitions, and vegetation type. Fire weather (i.e., climate) is just one component of wildfire danger.

Canada’s Forest Fire Weather Index System (FWI System)

Before you start using the app, you should familiarize yourself with the Canadian Forest Fire Weather Index System (FWI System), to have a better understanding of how these projections were made. The FWI System consists of six components that account for the effects of weather conditions on fire behaviour, all key components to fire weather (see Figure 3).

The infographic below shows all six fire weather components that account for the effects of fuel moisture and weather conditions on fire behaviour. Here you can see all weather variables (e.g., wind speed, relative humidity, rain, and temperature) that correspond with the fuel moisture codes (e.g., Fine Fuel Moisture Code, Duff Moisture Code, and Drought Code).

From there, the infographic shows the fire behaviour indices that are derived from the fuel moisture codes (e.g., the Buildup Index is a variable of the Duff Moisture Code and the Drought Code; the Initial Spread Index (ISI) is a variable of the Fine Fuel Moisture Code and wind speed). From there, the overall Fire Weather Index is calculated from the ISI and the BUI. For more detailed information on any of these components, please visit: Canadian Wildland Fire Information System | Canadian Forest Fire Weather Index (FWI) System (nrcan.gc.ca).

Figure 3: Fire Weather Infographic

Familiarizing yourself with the Fire Weather Projections app

Get Started and Learn More Tabs

In the Quick Start section, you’ll notice there is a “Getting Started” tab at the top of the application where you can read an introduction to the fire weather projections and what is presented in the Quick Start section and other tabs. If you would like more details on fire weather in general, how to interpret results in this app, or more about the technical information, click the “Guidance: Learn More” tab.

Map Tools and Functionalities

When you click on any of the tabs at the top of the Quick Start section (e.g., “Fire season length”, “Fire weather severity”, or “Fire weather frequency”), you’ll notice a map is displayed. On each map, you can toggle between historical (1971-2000) and future (2041-2070) values.

The Pan, Wheel Zoom, and Reset controls in the top-right corner can be used to explore and move the map. Select the “Wheel Zoom” button and then scroll up or down to zoom in and out on the map. To move the map without zooming, click the “Pan” button.

By default, historical and future values are displayed by hovering over the map. If you want to see the map without the values appearing, click the “Hover” button to disengage the hover function. To download the map as you see it on the screen, press the “Save” button.

Three Mini Case Studies: Study Areas

To demonstrate how to use the Quick Start section of the app, we will look at changing fire weather values across three national parks in Alberta: Waterton Lakes National Park, Elk Island National Park, and Wood Buffalo National Park (Figure 4).

Alberta is no stranger to wildfire. By the end of November, 2023, Alberta recorded 1,119 wildfires and more than 2.2 million hectares of area burned.[1]

Figure 4: Landscape types and future temperature projections (by 2041-2070 compared to the 1971 - 2000 average, in the highest emission scenario, RCP8.5) for all three “mini case studies” in this blog article (Wood Buffalo National Park, Elk Island National Park, and Waterton Lakes National Park, Alberta).

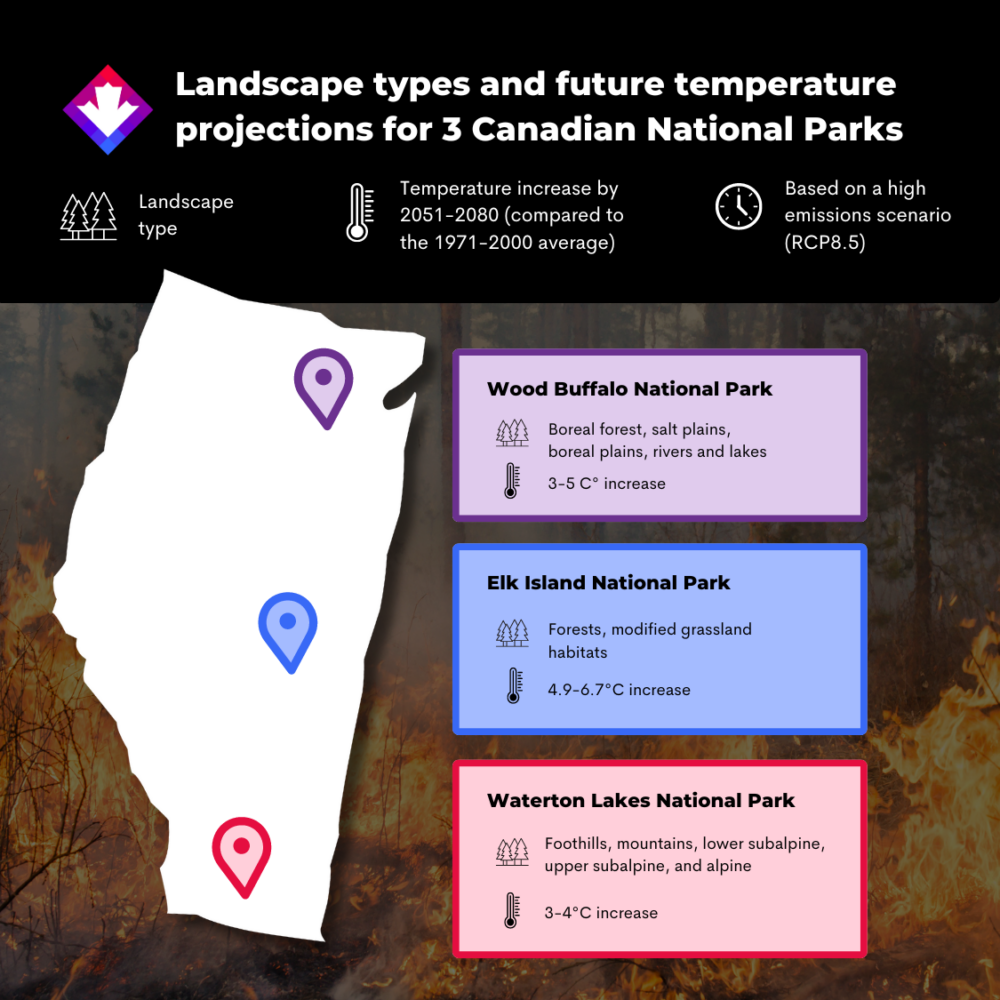
Case Study 1: Exploring projected changes in fire season length in Waterton Lakes National Park

The fire season refers to the period of the year when the weather is warm enough to support wildfire occurrence, growth and spread.

In this case, we are looking at how the fire season length is expected to change in Waterton Lakes National Park, in a high emissions scenario (RCP8.5), by mid-century (2041-2070). Zooming into the map and hovering over a region close to the park reveals the following historical map:

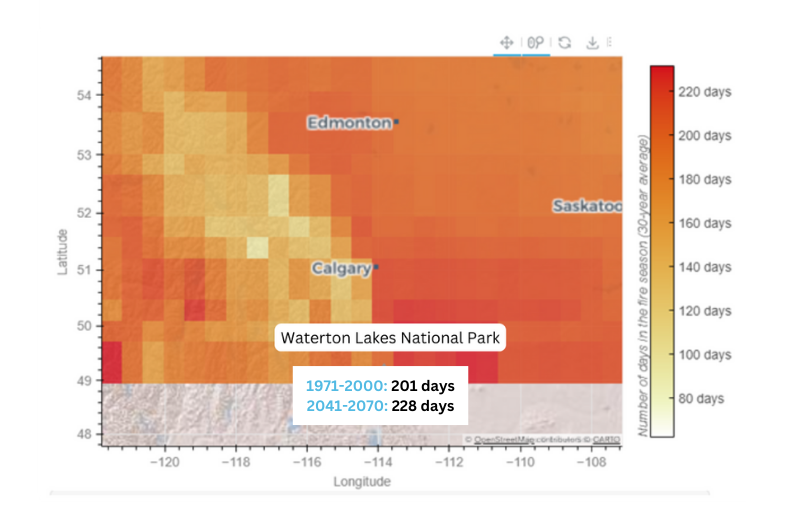
Over the modelled historical period of 1971-2000, Waterton Lakes National Park experienced a fire season length of 201 days (about 6 and a half months). Since this is a gridded historical value, it will be slightly different from the season length computed using observed weather station data. The 2041-2070 value under a high emissions scenario (RCP8.5) is 228 days (about 7 and a half months), or a 27 day (about 4 weeks) increase from the historical baseline. It is important to note that both the historical and future values are 30-year averages, meaning the years within these periods will vary from shorter to longer fire season lengths.

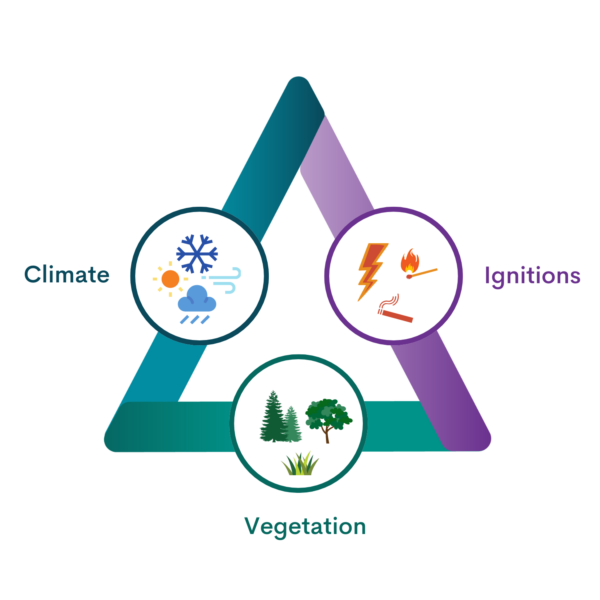
Also, as mentioned in the above section, many other factors combine to determine the pattern, frequency, and intensity of wildfires in a region, including the availability of fuel (i.e., vegetation), the land-use type (e.g., towns, topography), and ignition sources (e.g., lightning, human-caused fires). Therefore, the change in fire season length shown here does not predict with certainty that there will be more fires in the future. Instead, it is a metric for comparing two time periods to understand how fire danger may shift because of climate change.

Case Study 2: Exploring projected changes in fire weather severity in Elk Island National Park

The most severe fires tend to start and spread during the hottest, driest, and windiest times of the year. One way to visualize and understand changes in severity is with the Buildup Index, or BUI. This index describes the forest floor drought conditions, which determine how much fuel is available for combustion, which in turn can determine how damaging a fire could be and how difficult it would be to control.

In the Fire Weather Severity tab, the most extreme BUI values are mapped. This is done by calculating the 95th percentile BUI values between May and September (denoted here as BUI95). Put very simply, “95th percentile” means “the very highest BUI values you should expect in any given year”.

In this case, we want to know how fire severity is expected to change in Elk Island National Park, located near Edmonton, in a high emissions scenario (RCP8.5), by mid-century (2041-2070). Zooming into the map and hovering over a region close to the park reveals the following map:

As shown in the popup, Elk Island National Park has a historical (1971-2000) 30-year average BUI95 of 96 and a future (2041-2070) BUI95 of 115.

How do we know if a BUI95 of 96 or 115 is noteworthy? The significance of a particular BUI value depends on your region. Due to different climates and forest types in Canada, provinces and territories have different BUI severity thresholds. For example, the province of Alberta uses the values shown in Table 1 to determine if the fire hazard rating is low, moderate, high, very high, or extreme. For Elk Island National Park, a BUI of 90 or above is considered “extreme.”

Table 1: Thresholds for hazard ratings from low to extreme fire hazard for Alberta’s Fire Weather Index components. To learn more about Alberta’s FWI components, click here: Fire Weather Index Legend (alberta.ca)

Natural and human-driven fire regimes

Understanding your study region is key to using these data appropriately. Elk Island National Park consists mainly of grasslands and forests. In the past, wildfires were extinguished immediately to preserve the park. However, over time, this practice promoted the spread of invasive species and disrupted the region’s natural fire regime. Currently, Parks Canada conducts prescribed fires to more closely mimic historical fire patterns. Read more about what Parks Canada is doing in Elk Island National Park here: Fire – Elk Island National Park (canada.ca).

Table 1 shows BUI values (bolded) and the five other components of the Canadian Forest Fire Weather Index System. Combined, these components account for the effects of fuel moisture and weather conditions on fire behaviour (see Figure 3 again to see how all six fire weather components fit together).

Keep in mind, however, that here we are looking only at the BUI95 value (as a proxy for fire season severity). The average and year-to-year variability in BUI will yield different danger ratings.

To interpret BUI95 values for your region appropriately, we encourage you to research locally relevant BUI thresholds (see the Additional Resources section at the end of this article for more information).

Case Study 3: Exploring projected changes in fire weather frequency in Wood Buffalo National Park

Fire weather frequency is described here as the average number of days in a year where the BUI is above a certain threshold. Illustrated on the map below is a BUI threshold of 60, which is associated with a nationally defined “High” fire danger rating. However, as noted earlier, thresholds are defined differently across Canada.

In this case, we want to know how fire weather frequency is expected to change in Wood Buffalo National Park, in a high emissions scenario (RCP8.5), by mid-century (2041-2070). Zooming into the map and hovering over a region close to the park reveals the following map:

When you hover your mouse over the map, you will see historical and future values for the number of days where the BUI was above 40, 60, and 90. Why are there three different values? What constitutes a “high” BUI value varies across the country. In Alberta, a BUI above 40 is “high”, above 60 is “very high”, and above 90 is “extreme” (Table 1). See the Additional Resources section at the end of this article for more location-specific thresholds.

According to this map, over the historical period of 1971 to 2000, Wood Buffalo National Park experienced an average of 66 days where the BUI was 40 or more (BUI 40), 33 days where the BUI was 60 or more (BUI 60), and 9 days where BUI was 90 or more per year (BUI 90). In the future (2041-2070), under a high emissions scenario (RCP8.5), this region is projected to have 68 days with a BUI of 40 or more, 35 days with a BUI of 60 or more, and 11 days with a BUI of 90 or more.

Here, the long-term average number of days above a BUI threshold shows the influence that climate change can have on fire frequency. As stated earlier, these values represent an average over 30 years. The 30-year average count of days where BUI exceeds a specific threshold disguises the range of values experienced from one fire season to the next.

Furthermore, any actual change in fire frequency will depend on many other factors, including the presence of fuel, ignition events, and topography, and the actions we take to adapt to fires. The actions we take to prepare for more severe, frequent, and longer wildfires can influence the occurrence and behaviours of wildfires (e.g., sustainable forest management practices). Please see the Map of Adaptation Actions, and filter through all fire events to learn about what others are doing across the country to adapt to wildfires: Map — Canada in a Changing Climate

Wood Buffalo Complex fires

In 2023, Wood Buffalo National Park experienced extreme drought and had numerous large wildfires. The Wood Buffalo Complex fires were especially severe and estimated to have burned 504,490 hectares. Visit Wood Buffalo National Park’s 2023 wildfire archives to learn more about 2023’s fires, how they behaved, and how they were controlled: Fire information archives – Wood Buffalo National Park (canada.ca).

To see what the fire conditions for the park are today, please visit: Wood Buffalo National Park wildfire updates – Wood Buffalo National Park (canada.ca).

Conclusion and Remarks

The Quick Start section in the fire weather projections app can tell us a lot about long-term changes in fire weather patterns. It can be used to determine how fire season length, fire weather severity, and fire weather frequency might change in the future as the planet continues to warm. When used with local knowledge of the area, the types of vegetation present, the frequency of lightning strikes, and many other factors, these data can be used to help inform future wildfire preparedness plans. The three case studies discussed here provide a sense of how to browse, visualize, and interpret these data to better understand the impacts of climate change on fire danger in your region.

However, your journey does not end here: the Deep Dive section of the app allows you to go much further. In this section you can set your own custom thresholds, browse even more fire weather index components, and download the raw data to your computer. Stay tuned for more information on the Deep Dive section in the coming months.

Additional Resources

Below are some links to specific thresholds for Fire Weather Index System codes for various regions in Canada. Please note that this list is not exhaustive; we encourage you to conduct research on your specific province or territory’s Fire Weather Index System thresholds.

Table 2:

Region Source Link
Canada-wide Natural Resources Canada Metadata_Fire_Danger_Agency_Classes.pdf (nrcan.gc.ca)
British Columbia Government of British Columbia https://www.bclaws.gov.bc.ca/civix/document/id/complete/statreg/11_38_2005
Alberta Government of Alberta https://open.alberta.ca/dataset/527f39ff-5581-4051-b5fd-9ba303f793b3/resource/e75da590-f414-464f-9221-b0dee0a858a8/download/fp-fire-weather-index-legend.pdf
Ontario Government of Ontario An approach for defining physically based fire weather index system classes for Ontario / C.C. Hanes, B.M. Wotton, C. McFayden and N. Jurko.: Fo123-2/29-2021E-PDF – Government of Canada Publications – Canada.ca
Nova Scotia Government of Nova Scotia https://novascotia.ca/natr/forestprotection/wildfire/forecasts.asp


References

[1] Natural Resources Canada, https://natural-resources.canada.ca/simply-science/canadas-record-breaking-wildfires-2023-fiery-wake-call/25303