Climate Change and Water Levels in the Great Lakes

Date June 9, 2026
Author Eva Gnegy and Carrington Pomeroy, Canadian Centre for Climate Services
Topics Get Climate Smart
Share this post

Introduction 


Water levels in the Laurentian Great Lakes influence a wide range of activities, from commercial shipping to recreational boating to shoreline management. Fluctuations in these levels, therefore, can lead to costly disruptions.  

This blog explores the mechanisms that influence Great Lakes water levels, how these levels varied in the past, and what current knowledge can (and can’t) tell us about future changes. 

 
Figure 1: The Great Lakes and their connecting waterways

Why changing lake levels matter


Low lake levels can reduce the cargo capacity of commercial vessels, increase transportation costs (e.g., as loads must be reduced or shipments split across more trips), and raise the likelihood of shipping delays or temporary route restrictions. In some cases, low water conditions can also increase the need for dredging in harbors and navigation channels to maintain safe access. Water levels also affect hydropower and water management systems. Reduced outflows and lower headwaters can reduce hydropower potential in regulated systems, while sustained low levels can complicate municipal and industrial water intakes and shoreline infrastructure that are built around “typical” water levels [1].

At the other extreme, sustained high water levels can damage ports, marinas, and waterfront infrastructure, and high wave energy during storms can accelerate shoreline erosion. For shoreline communities, changing lake levels can accelerate erosion and increase flood risk. Recent record-high conditions in Lake Ontario in 2017 and 2019 contributed to widespread shoreline flooding and erosion, affecting homes, businesses, roads, and other critical assets along the Lake Ontario and St. Lawrence shoreline [2].

Water-level changes also have important implications for ecosystems. Great Lakes coastal wetlands expand and contract in response to water-level variability, and prolonged periods of high or low water can shift vegetation, alter fish and wildlife habitat, and degrade wetland function [3].

Did you know? Lakes Michigan and Huron are hydrologically connected by the Straits of Mackinac – so much so, that their levels fluctuate together, and, in many cases, they are treated as one lake [2].

Indigenous communities across the Great Lakes region have deeply rooted connections to the lakes, with water levels influencing access to traditional fishing areas, navigation routes and culturally important sites and practices. Water-level variability can affect when and how communities safely access these key areas and can increase risks to culturally significant shorelines and places.   


Mechanisms that influence lake levels  


Lake water levels are affected by various factors, including over-lake precipitation, runoff from the surrounding areas, evaporation over the lakes, and the flow of water from upstream and downstream lakes (Figure 2). These factors are affected by both climate and human activities, such as changes in water usage and regulations that can influence how much water flows in and out of the lakes.

The relative influence of the above factors varies by lake. The upper Great Lakes (Superior and Michigan-Huron) are more affected by runoff from surrounding basins than the lower Great Lakes (Erie and Ontario), which are more heavily influenced by inflow from the upper lakes [1]. As well, control structures at the outlets of Lakes Superior and Ontario (the St. Marys and St. Lawrence rivers, respectively) allow for some modification of the outflow of these lakes and in turn the lake levels [1].

 
Figure 2: Water balance components that affect Great Lakes water levels obtained from: https://glisa.umich.edu/sustained-assessment/lake-levels/

How does climate impact lake levels?

Climate variables such as temperature, precipitation, relative humidity, and wind play a large role in Great Lakes’ water levels.

Precipitation

Precipitation influences lake levels in two main ways. Rain and snow that fall directly onto the lake surface increase lake levels directly. Precipitation that falls on the surrounding drainage basin (i.e., the land area that drains toward the lakes) contributes indirectly. Drainage basin contributions come from water moving through the landscape as runoff, either quickly following rainfall or later as snowmelt. This water drains into the lakes via rivers, streams, and groundwater. Since the Great Lakes drainage basin spans hundreds of thousands of square kilometres, intense rainfall events that occur far from the shoreline can still affect lake levels by generating rapid runoff and temporarily boosting river inflows. Water-level responses depend on how much of the rainfall becomes runoff versus soaking into soil or returning to the atmosphere, processes influenced by land use, soil type and moisture levels, and topography.

Temperature

Temperature influences water loss from the lakes through evaporation and evapotranspiration. Evaporation occurs when the lake is much warmer than the air above it, when winds are strong, and when the air is dry (the relative humidity is low). These conditions often occur during the fall months when the lakes are still warm from summer, but the air has started to cool creating a strong temperature contrast that encourages evaporation. Over land, the dominant evapotranspiration pathway is from plants, soil, and trees, and generally peaks during the summer months. Temperature also affects the amount of ice that forms on the lake, which directly affects the amount of evaporation from the lakes.

Box 1: Calculating Water Levels – Net Basin Supply

Water levels for individual lakes are driven by Net Basin Supply (NBS), which depends on over-lake precipitation, runoff and over-lake evaporation.

NBS can be calculated using physically understood inputs from observations or from climate models.

Net Basin Supply (NBS)

NBS = P + R – E

Where:

P = over-lake precipitation.

R = runoff entering the lake from the land surface.

E = over-lake evaporation


Understanding natural cycles in Great Lake levels


Water levels in the Great Lakes fluctuate cyclically across many different timescales in response to changing natural conditions.

Short-term fluctuations occur over hours to days and are primarily due to storms and wind. Seasonally, a rise in lake levels is observed during spring due to snowmelt, peaking during summer. Lake levels start to decline during fall when evaporation is often the strongest. Lake levels are usually at their lowest during winter when precipitation falls as snow (Figure 3).

Figure 3: An overview of seasonal variations in Great Lake levels – obtained from: NOAA Great Lakes Environmental Research Laboratory via https://storymaps.arcgis.com/stories/f60be9e50c6341d6b76e62f84de43dd6

Longer-term fluctuations in lake levels occur over multiple years to decades, driven by broader climate patterns that influence the overall water balance of the basin.

Despite more than a century of continuous monitoring, there is no regular pattern in these multi-year cycles, with the timing and duration of high and low periods varying unpredictably.4 Research on Lake Michigan-Huron using geological evidence (carbon dating) spanning nearly 5,000 years suggests even longer cycles exist, with potential fluctuations occurring over 120-200-year periods [3].

Additionally, different lakes may experience highs and lows at different times depending on the local conditions and upstream inflows. Between their extreme highs and lows, water levels have fluctuated by about 1.2m on Lake Superior and over 1.8m on the other Great Lakes [4]. 


Historical lake level trends 


Federal agencies in the United States of America and Canada have continuously monitored Great Lakes water levels since the 1860s. Many historical datasets begin in 1918, when a more extensive network of gauges was established [3].

The Great Lakes have experienced cycles of high and low water levels over the past century.  Extreme lows occurred in the late 1920s, mid-1930s, and mid-1960s, while record highs occurred in the early 1970s and mid-1980s due to above-average precipitation. More recently, above-average temperatures in the late 1990s caused high evaporation rates and low runoff, leading to a prolonged period of low water levels from 1998-2013 [5].

Water levels changed when above-average precipitation returned, bringing record-high water levels in 2013-2014 and 2018-2020 [5]. In 2017 and 2019, Lake Ontario reached record highs, which led to flooding of the St. Lawrence River and caused widespread flooding and erosion of shoreline communities in Ontario [6], [7]. As of 2026, water levels are average or below average depending on the lake, with drought conditions accelerating the decline in water levels from the record high in 2019 [8].

Box 2: Where to find historical and current data

Future climate projections


Scientists develop projections of Great Lakes water levels for future decades using a range of modelling approaches. Most studies combine climate models with hydrological models to simulate the key drivers of lake levels: precipitation, evaporation, and runoff. Climate model output is used to estimate the water-balance components that determine net basin supply (see above), often with additional watershed hydrology models to better represent runoff processes. A Great Lakes routing/lake system model translates net basin supply into lake levels by accounting for flows between lakes and regulatory controls at key outlets.

Box 2: Future climate projections available on ClimateData.ca

ClimateData.ca does not currently provide projections of Great Lakes water levels in a changing climate. However, the platform includes projections of many of the key climate drivers that influence lake levels – notably precipitation, temperature, snow/ice conditions, and the likelihood of extreme events. These variables can help users explore how lake levels could change in a changing climate.

Examples of relevant variables and indices include:

  • Total precipitation (annual/seasonal change): A core driver of net basin supply, influencing both over-lake precipitation and watershed runoff.
  • Heavy precipitation indices (e.g., very wet days / extreme rainfall events): Useful for considering how changes in shorter-lived but intense events could increase runoff and inflows.
  • Mean temperature / maximum temperature: Strongly influences evaporation over lakes and evapotranspiration over land. It also affects whether precipitation falls as rain or snow.
  • Freezing-related indices (e.g., freezing days / thaw patterns): Relevant to ice cover conditions and cold-season processes that affect evaporation and spring runoff timing.
  • Wet/dry spell indices (e.g., consecutive dry days): Influences climatological drought risk.


Putting it all together


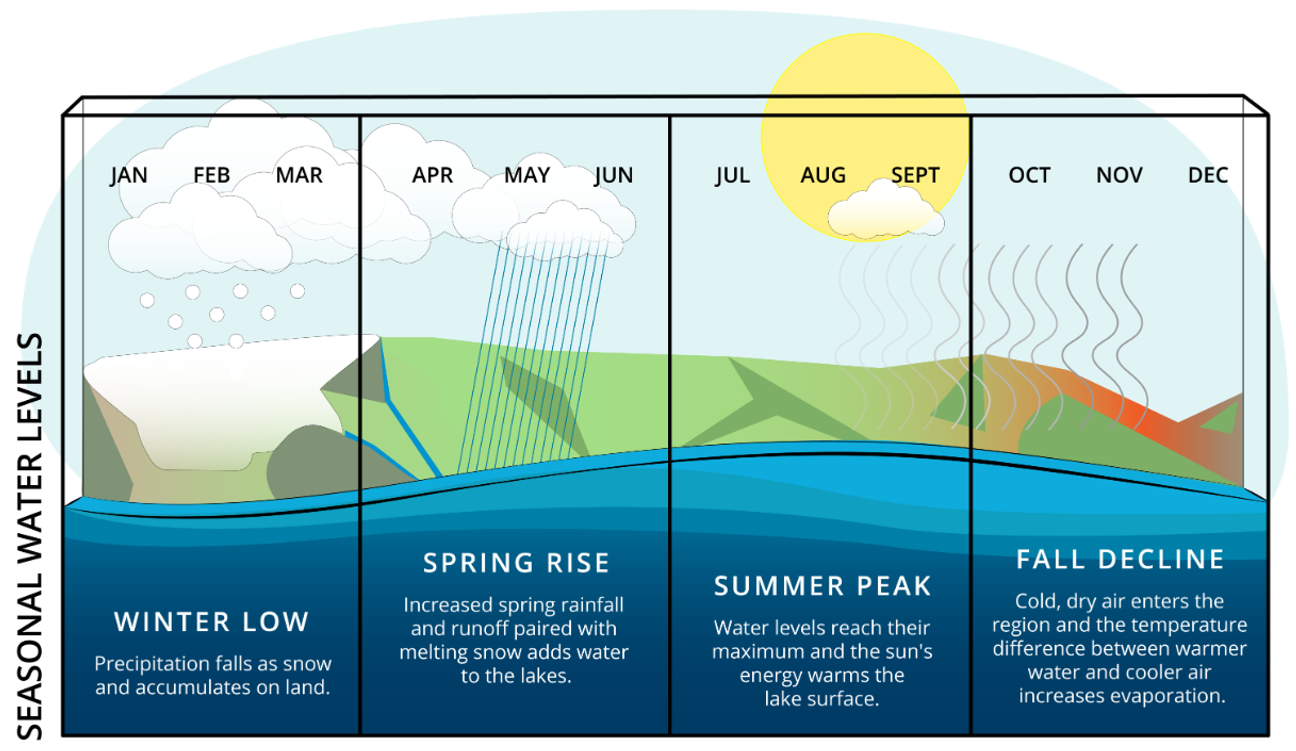
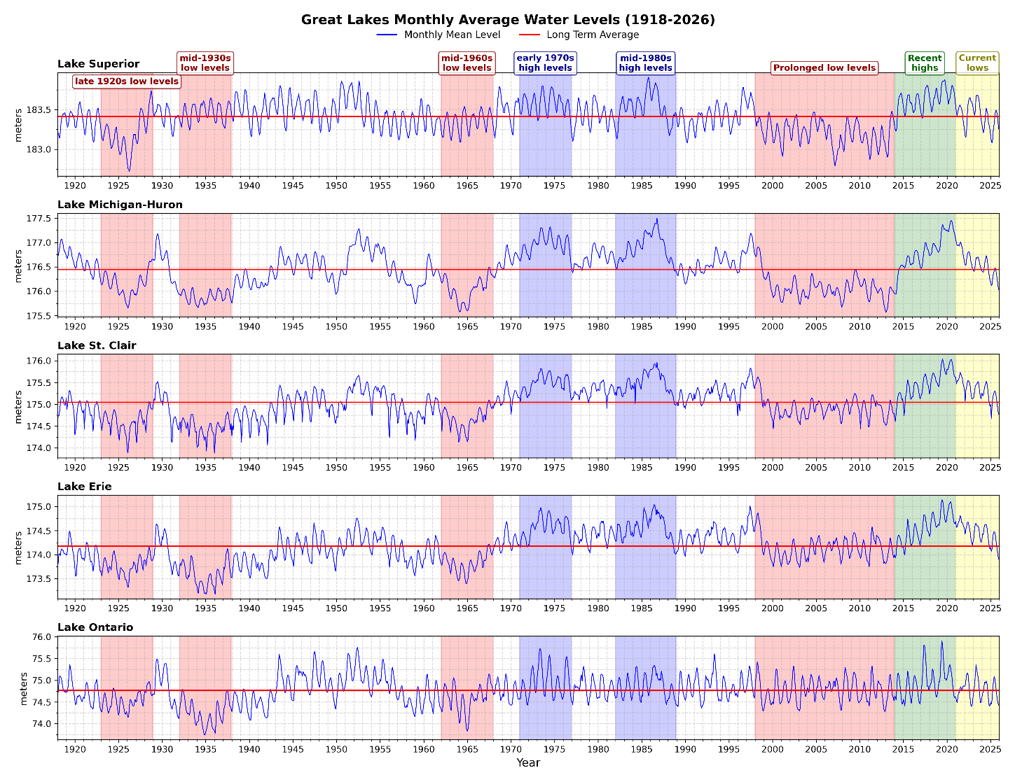
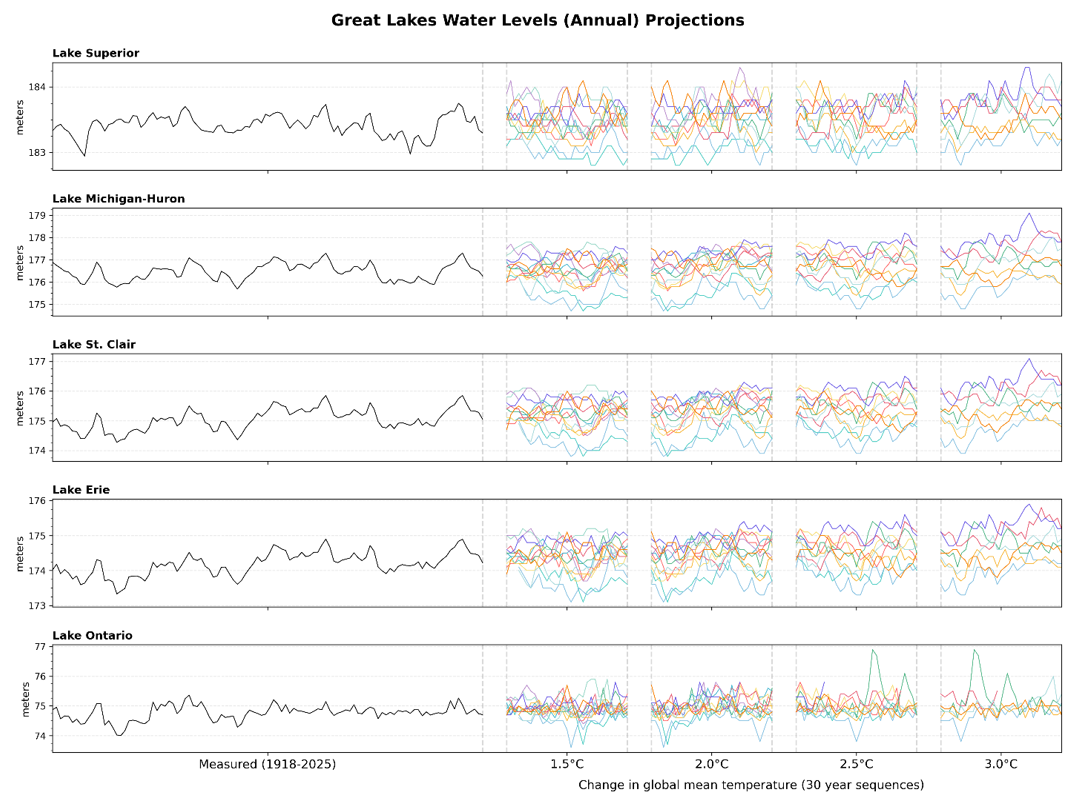
Taken together, the historical record and climate-based projections show that Great Lakes water levels are dynamic, and future conditions are likely to include greater variability and more pronounced extremes. Rather than a consistent long-term rise or fall, research points toward greater variability in water levels, with a higher frequency of extreme highs and lows expected in the future [13], [14]. Higher emissions scenarios amplify this variability, “leading to a wider range of possible water levels and more extreme conditions” [13]. Seasonal patterns may also shift as snowmelt timing, precipitation, and evaporation rates change due to a warming climate, building on observed changes in the timing and amplitude of seasonal water level cycles over the past century [15], [16], [17].

At the same time, it is important to interpret future projections carefully. Great Lakes water level projections share the same broad sources of uncertainty as other climate projections, but they also carry added uncertainty because global climate models operate at spatial resolutions that do not necessarily simulate the local and regional processes that affect Great Lakes water levels. Until recently, most climate models used simplified, one-dimensional (1D) lake models that represent lakes as vertical columns of water, which can introduce biases because these 1D representations do not capture the circulation and mixing processes that occur in the Great Lakes [5], [9], [10]. Early modelling approaches also used one-way coupling between the climate and hydrological models, missing important lake–atmosphere feedback; more recent studies [5], [9] using three-dimensional lake models with two-way coupling have reduced some of these biases.

Although there is uncertainty in long-term future projections of water levels in the Great Lakes, projections should still be considered alongside the historical record of water levels to support planning and adaptation. For example, projections suggest that future water levels will be more variable [13], [14].


Conclusion


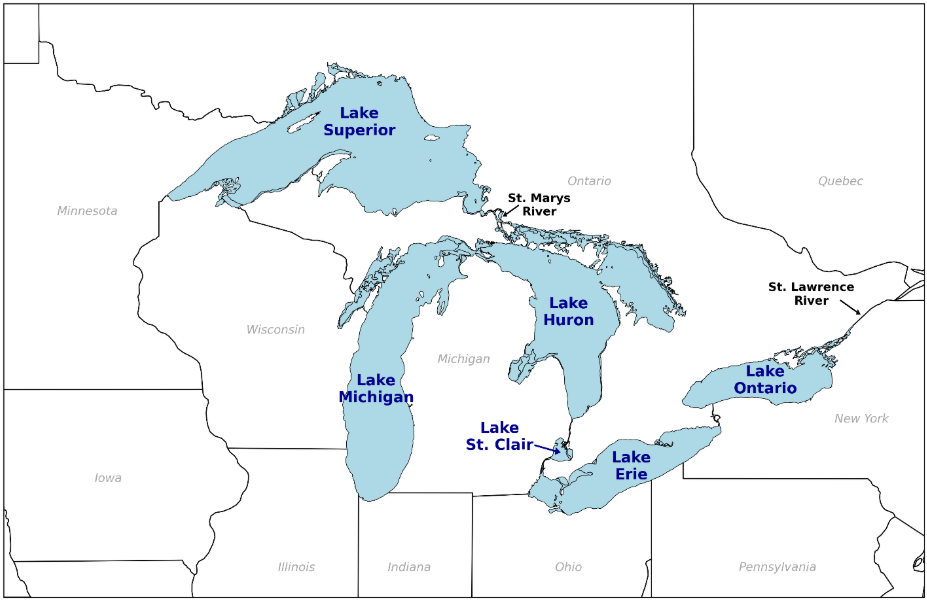
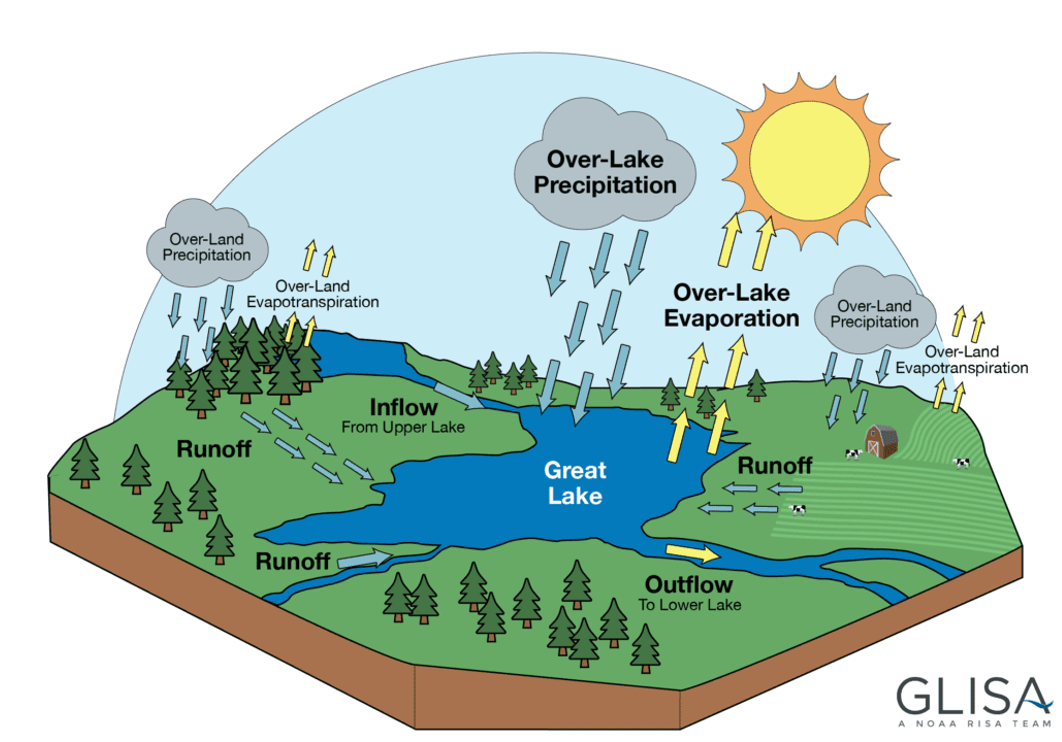
Great Lakes water levels matter because they impact human activities, infrastructure, and ecology in the basin – from shipping and hydropower to shoreline infrastructure, recreation, and wetlands. This article describes the factors influencing lake levels, including the balance between precipitation, runoff, and evaporation. At the same time, water levels vary naturally over seasons and decades and are also influenced by basin characteristics and regulation at key outlets – meaning future changes cannot be understood through temperature or precipitation trends alone.

Despite advances in modelling, there is no scientific consensus on how Great Lakes water levels will change throughout the 21st century. Studies [5], [11], [12], [13], [14]. project different long-term trends, reflecting both the complexity of the Great Lakes system and key methodological differences between studies. These studies are consistent however in their projections of a wider range of plausible future lake-level conditions [13], [14]. For planning, considering strategies that perform well across both high- and low-water extremes is prudent based on science. ClimateData.ca supports this work by providing access to local climate data and guidance to help users explore projected changes in some of the key drivers of variability in lake levels, namely, temperature and precipitation.

 
Figure 5: Projected Great Lakes water levels through the 21st century under different global warming levels. Data from Future water levels of the Great Lakes under 1.5° C to 3° C warmer climates [13].

References

[1] GLISA. Lake Levels Overview.

[2] NOAA. Water Levels in the Great Lakes.

[3] USGS. Lake-Level Variability and Water Availability in the Great Lakes.

[4] DFO. Fluctuations in Great Lakes levels.

[5] Kayastha, M. B., Ye, X., Huang, C., & Xue, P. (2022). Future rise of the Great Lakes water levels under climate change. Journal of Hydrology, 612, 128205.

[6] International Lake Ontario-St. Lawrence River Board. Observed Conditions & Regulated Outflows in 2017.

[7] International Lake Ontario-St. Lawrence River Board. Observed Conditions & Regulated Outflows in 2017.

[8] International Joint Commission. Great Lakes Water Levels Boards – Winter Update 2024-2025. (14).

[9] Xue, P., J. S. Pal, X. Ye, J. D. Lenters, C. Huang, and P. Y. Chu (2017). Improving the Simulation of Large Lakes in Regional Climate Modeling: Two-Way Lake–Atmosphere Coupling with a 3D Hydrodynamic Model of the Great Lakes. Journal of Climate, 30, 1605–1627.

[10] Briley, L. J., Rood, R. B., & Notaro, M. (2021). Large lakes in climate models: A Great Lakes case study on the usability of CMIP5. Journal of Great Lakes Research, 47(2), 405-418.

[11] MacKay, M., & Seglenieks, F. (2013). On the simulation of Laurentian Great Lakes water levels under projections of global climate change. Climatic Change, 117(1), 55-67.

[12] Notaro, M., Bennington, V., & Lofgren, B. (2015). Dynamical downscaling–based projections of Great Lakes water levels. Journal of Climate, 28(24), 9721-9745.

[13] Seglenieks, F., & Temgoua, A. (2022). Future water levels of the Great Lakes under 1.5° C to 3° C warmer climates. Journal of Great Lakes Research, 48(4), 865-875.

[14] Lofgren, B. M., & Rouhana, J. (2016). Physically plausible methods for projecting changes in Great Lakes water levels under climate change scenarios. Journal of Hydrometeorology, 17(8), 2209-2223.

[15] GLISA. Lake Levels. https://glisa.umich.edu/resources-tools/climate-impacts/lake-levels/.

[16] Lenters, J. D. (2001). Long-term trends in the seasonal cycle of Great Lakes water levels. Journal of Great Lakes Research, 27(3), 342-353.

[17] Lenters, J. D. (2004). Trends in the Lake Superior water budget since 1948: A weakening seasonal cycle. Journal of Great Lakes Research, 30, 20-40.

[18] Gronewold, A. D., & Stow, C. A. (2014). Unprecedented seasonal water level dynamics on one of the Earth’s largest lakes. Bulletin of the American Meteorological Society, 95(1), 15-17.