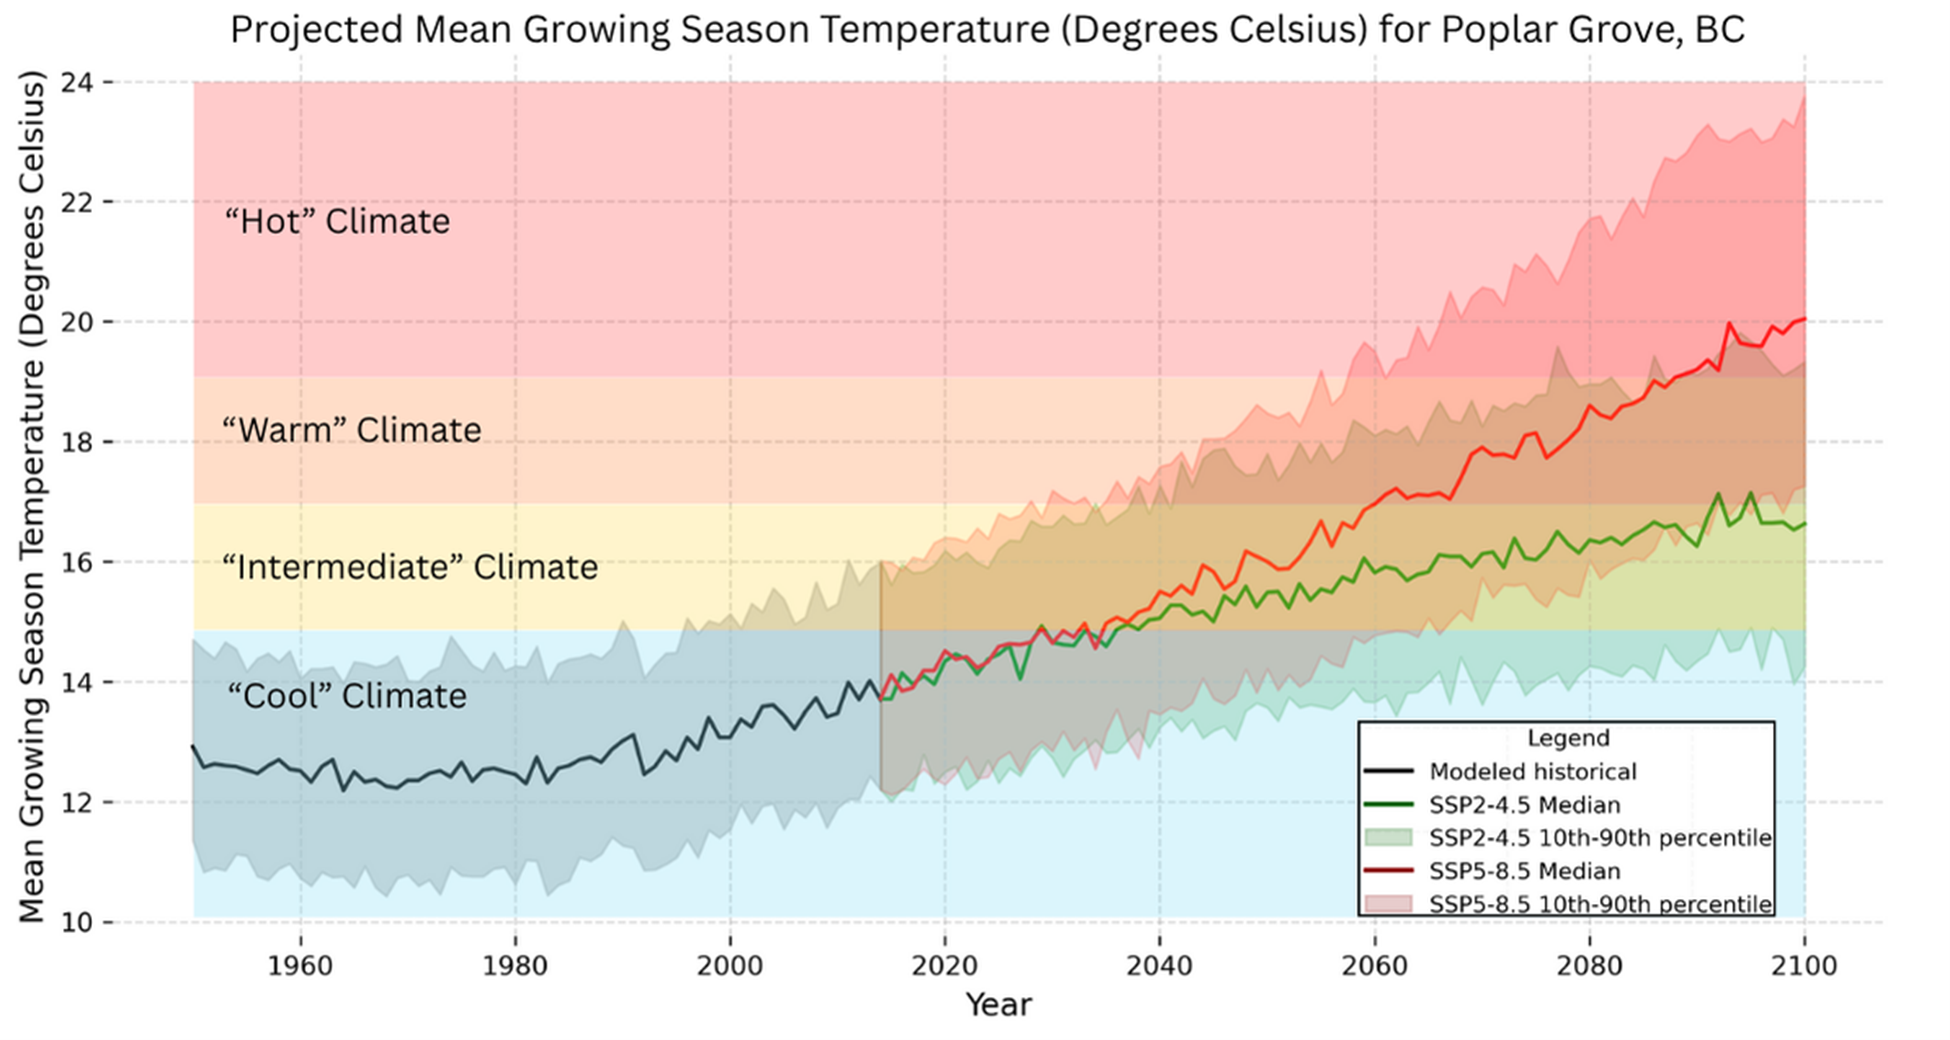
The graph shows that growing season temperatures in Poplar Grove are expected to rise in the coming decades under both emissions scenarios. The black line shows past climate conditions based on model simulations, and the coloured lines represent the range of possible futures, with the middle lines showing the median, or “most likely,” pathway and the shaded areas showing the range of variability we could expect.
Looking at the variability for the past period, the warmer end of the modeled range suggests that Poplar Grove may already have experienced years shifting from a “cool” to an “intermediate” climate since about 2000. Early on, such years would have been rare, if they happened at all, but they become more plausible as a larger portion of the shaded range moves into the “intermediate” zone. This aligns with the findings of Hewer and Gough (2021), who reported that the Okanagan Valley has already made this shift based on observed data.
It’s important to note that modeled historical data do not reproduce daily or yearly weather exactly as it occurred—this data provides a simulated version of past climate that captures the overall patterns and variability of the observed weather. Because of this, the “most likely” (median) pathway in the modelled results will not match observed historical data exactly. Instead, it is the variability shown in the model that encompasses the outcomes seen in real-world records, which explains why the upper end of the modelled range aligns with the observed shift from “cool” to “intermediate” zone. (Read more about modeled historical data here: Modelled Historical Data — ClimateData.ca.)
Building on this, the projections show that the shift toward warmer climate categories in Poplar Grove is not temporary—it is here to stay. The median, or “most likely,” pathway under both emissions scenarios reaches the “intermediate” climate category by about 2030, meaning that what was once only seen at the warmer edge of variability becomes the typical climate for the region.
From there, the range of possibilities widens. The median under a lower emissions scenario continues to rise gradually, reaching about 16.5°C by the end of the century. Poplar Grove remains in the “intermediate” category under this scenario. Under a high emissions scenario, the median increases much more sharply, crossing into the “warm” category by the 2060s and approaching 20°C by century’s end—placing the region in the “hot” category and making it suitable for grape varieties adapted to the warmest climates.
These figures reflect the 10 km by 6 km grid cell for Poplar Grove. Within that grid, “microclimates” shaped by elevation, slope, water bodies, and other local features may result in more than one climate category within a grid cell. In this case, using change values (also known and labelled on ClimateData.ca as “delta” values) in conjunction with site-specific historical data can provide more locally-specific projections of future climate.
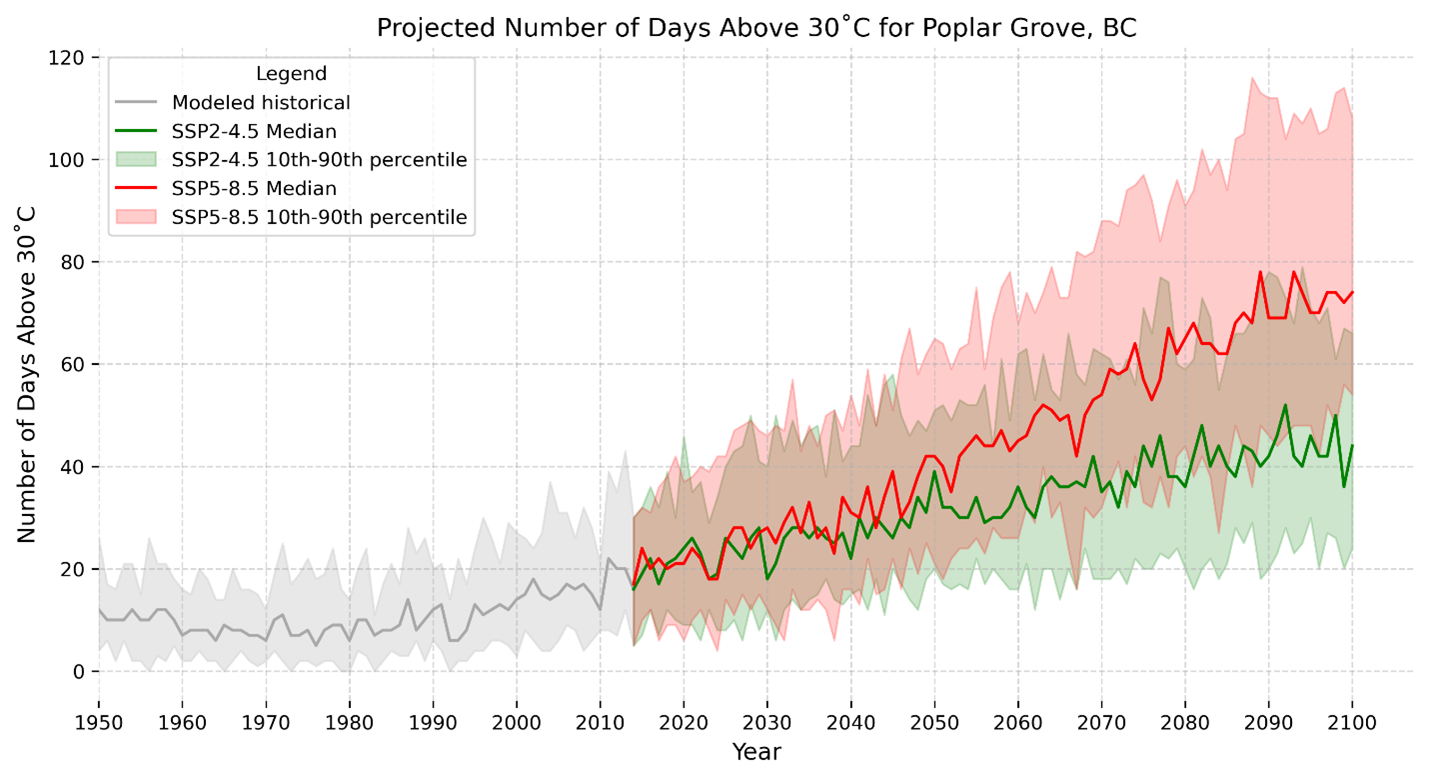
2. Extreme Heat
To assess heat stress, we looked at how many days above 30°C Poplar Grove could experience by 2100.