Feeling the Heat: Climate Change, Climate Variability, and the 2026 FIFA World Cup in Canada

Date April 22, 2026
Author Edward Beard; Pacific Climate Impacts Consortium
Topics Climate Data in Action, Health, Seasonal to decadal forecasts
Share this post

Introduction

It’s July 17, 1994. All-4-One’s “I Swear” is topping global music charts. Bill Clinton is President of the United States. And Roberto Baggio, Italy’s star striker, is standing with his hands on his hips, staring down at the grass, with the baking Californian sun and the eyes of over 94,000 people on the back of his head. He has just missed the last penalty kick of the 1994 FIFA World Cup Final at the Rose Bowl Stadium in Pasadena, and in doing so, handed opponents Brazil their fourth World Cup victory.

This was the defining moment of the last men’s FIFA World Cup played in North America. However, as we approach the 2026 FIFA World Cup – co-hosted by Canada, the United States and Mexico –another feature of USA ‘94 is getting all the attention: the heat [1, 2, 3].

During USA ’94, players described the conditions as “dangerous” [4]. In the decades since, the threat has only intensified; just last year, the World Economic Forum labeled extreme heat the “deadliest climate risk of our time” [5]. This global shift explains the growing concern surrounding this summer’s tournament. But what impact has climate change actually had on temperatures in Canada’s host cities? How much hotter are they today than they were in the 1990s, and does that mean this summer is destined to be a scorcher?

Long-term temperature changes in Toronto and Vancouver

On Friday, June 12, 2026, the first-ever men’s World Cup match to be played on Canadian soil will kick off at Toronto Stadium. Five further games will take place in Toronto and seven in Vancouver.

AHCCD station data shows that in both cities the average daytime high temperature across June and July is about 1ºC warmer now (2001-2025) than it was 30 years ago (1971-2000). That might sound like a small increase, but rising average temperatures are accompanied by increases in the frequency and intensity of extreme temperatures. For example, the Pacific Climate Impact Consortium (PCIC)’s Climate Explorer shows that between 1971-2000, temperatures during a 1-in-20-year extreme heat event were expected to reach about 33 ºC in Vancouver and 36.5 ºC in Toronto. Between 2011-2040, those temperatures increase to around 35ºC and 38.5 ºC respectively (under all emissions scenarios). Therefore, due to climate change, average and extreme temperatures in Canada’s host cities have increased since the 1990s, and climate models project this trend will continue in the near term.

However, because the climate is naturally variable (see Box 1), a long-term increase in average and extreme temperatures doesn’t necessarily mean that temperatures in June and July 2026 will be any hotter than they were in recent decades. To best evaluate that, we need to look at a different type of climate data: seasonal forecasts.

Box 1: Natural climate variability

PCIC’s Climate Anomaly Viewer tells us that while Baggio was baking at the Rose Bowl Stadium in July 1994, British Columbia (BC) was also experiencing an especially hot July. However, as shown in Figure 1, temperatures in July 1993 and July 1995 were both cooler than normal in BC. This is because the climate is naturally variable, meaning temperatures (and other conditions, like precipitation) fluctuate from year to year and season to season (a bit like the form of soccer players). To account for this and discern clear signals from the noise, scientists typically use 30-year averages to distinguish climate change from natural variability. As a result, climate projections provide robust information on long-term changes in climatic conditions, but they can’t be used to determine conditions for specific days, months, seasons, or years in the future. For more information about the difference between weather and climate, natural climate variability, and climate change detection, check out the Climate Science 101 section of the Learning Zone on ClimateData.ca.

Figure 1: Screenshots from PCIC’s Climate Anomaly Viewer showing average maximum temperature anomalies in BC for July 1993, 1994, and 1995 relative to the 1971-2000 baseline period.

Seasonal forecasts for summer 2026

In January 2026, seasonal forecasts were added to ClimateData.ca. Seasonal forecasts help bridge the gap between short-term weather forecasts and long-term climate projections, enabling users to obtain information about the probability of conditions in upcoming seasons being hotter, cooler, drier, or wetter than normal1. For more information about the development, availability, and application of seasonal forecasts, visit the S2D landing page on ClimateData.ca.

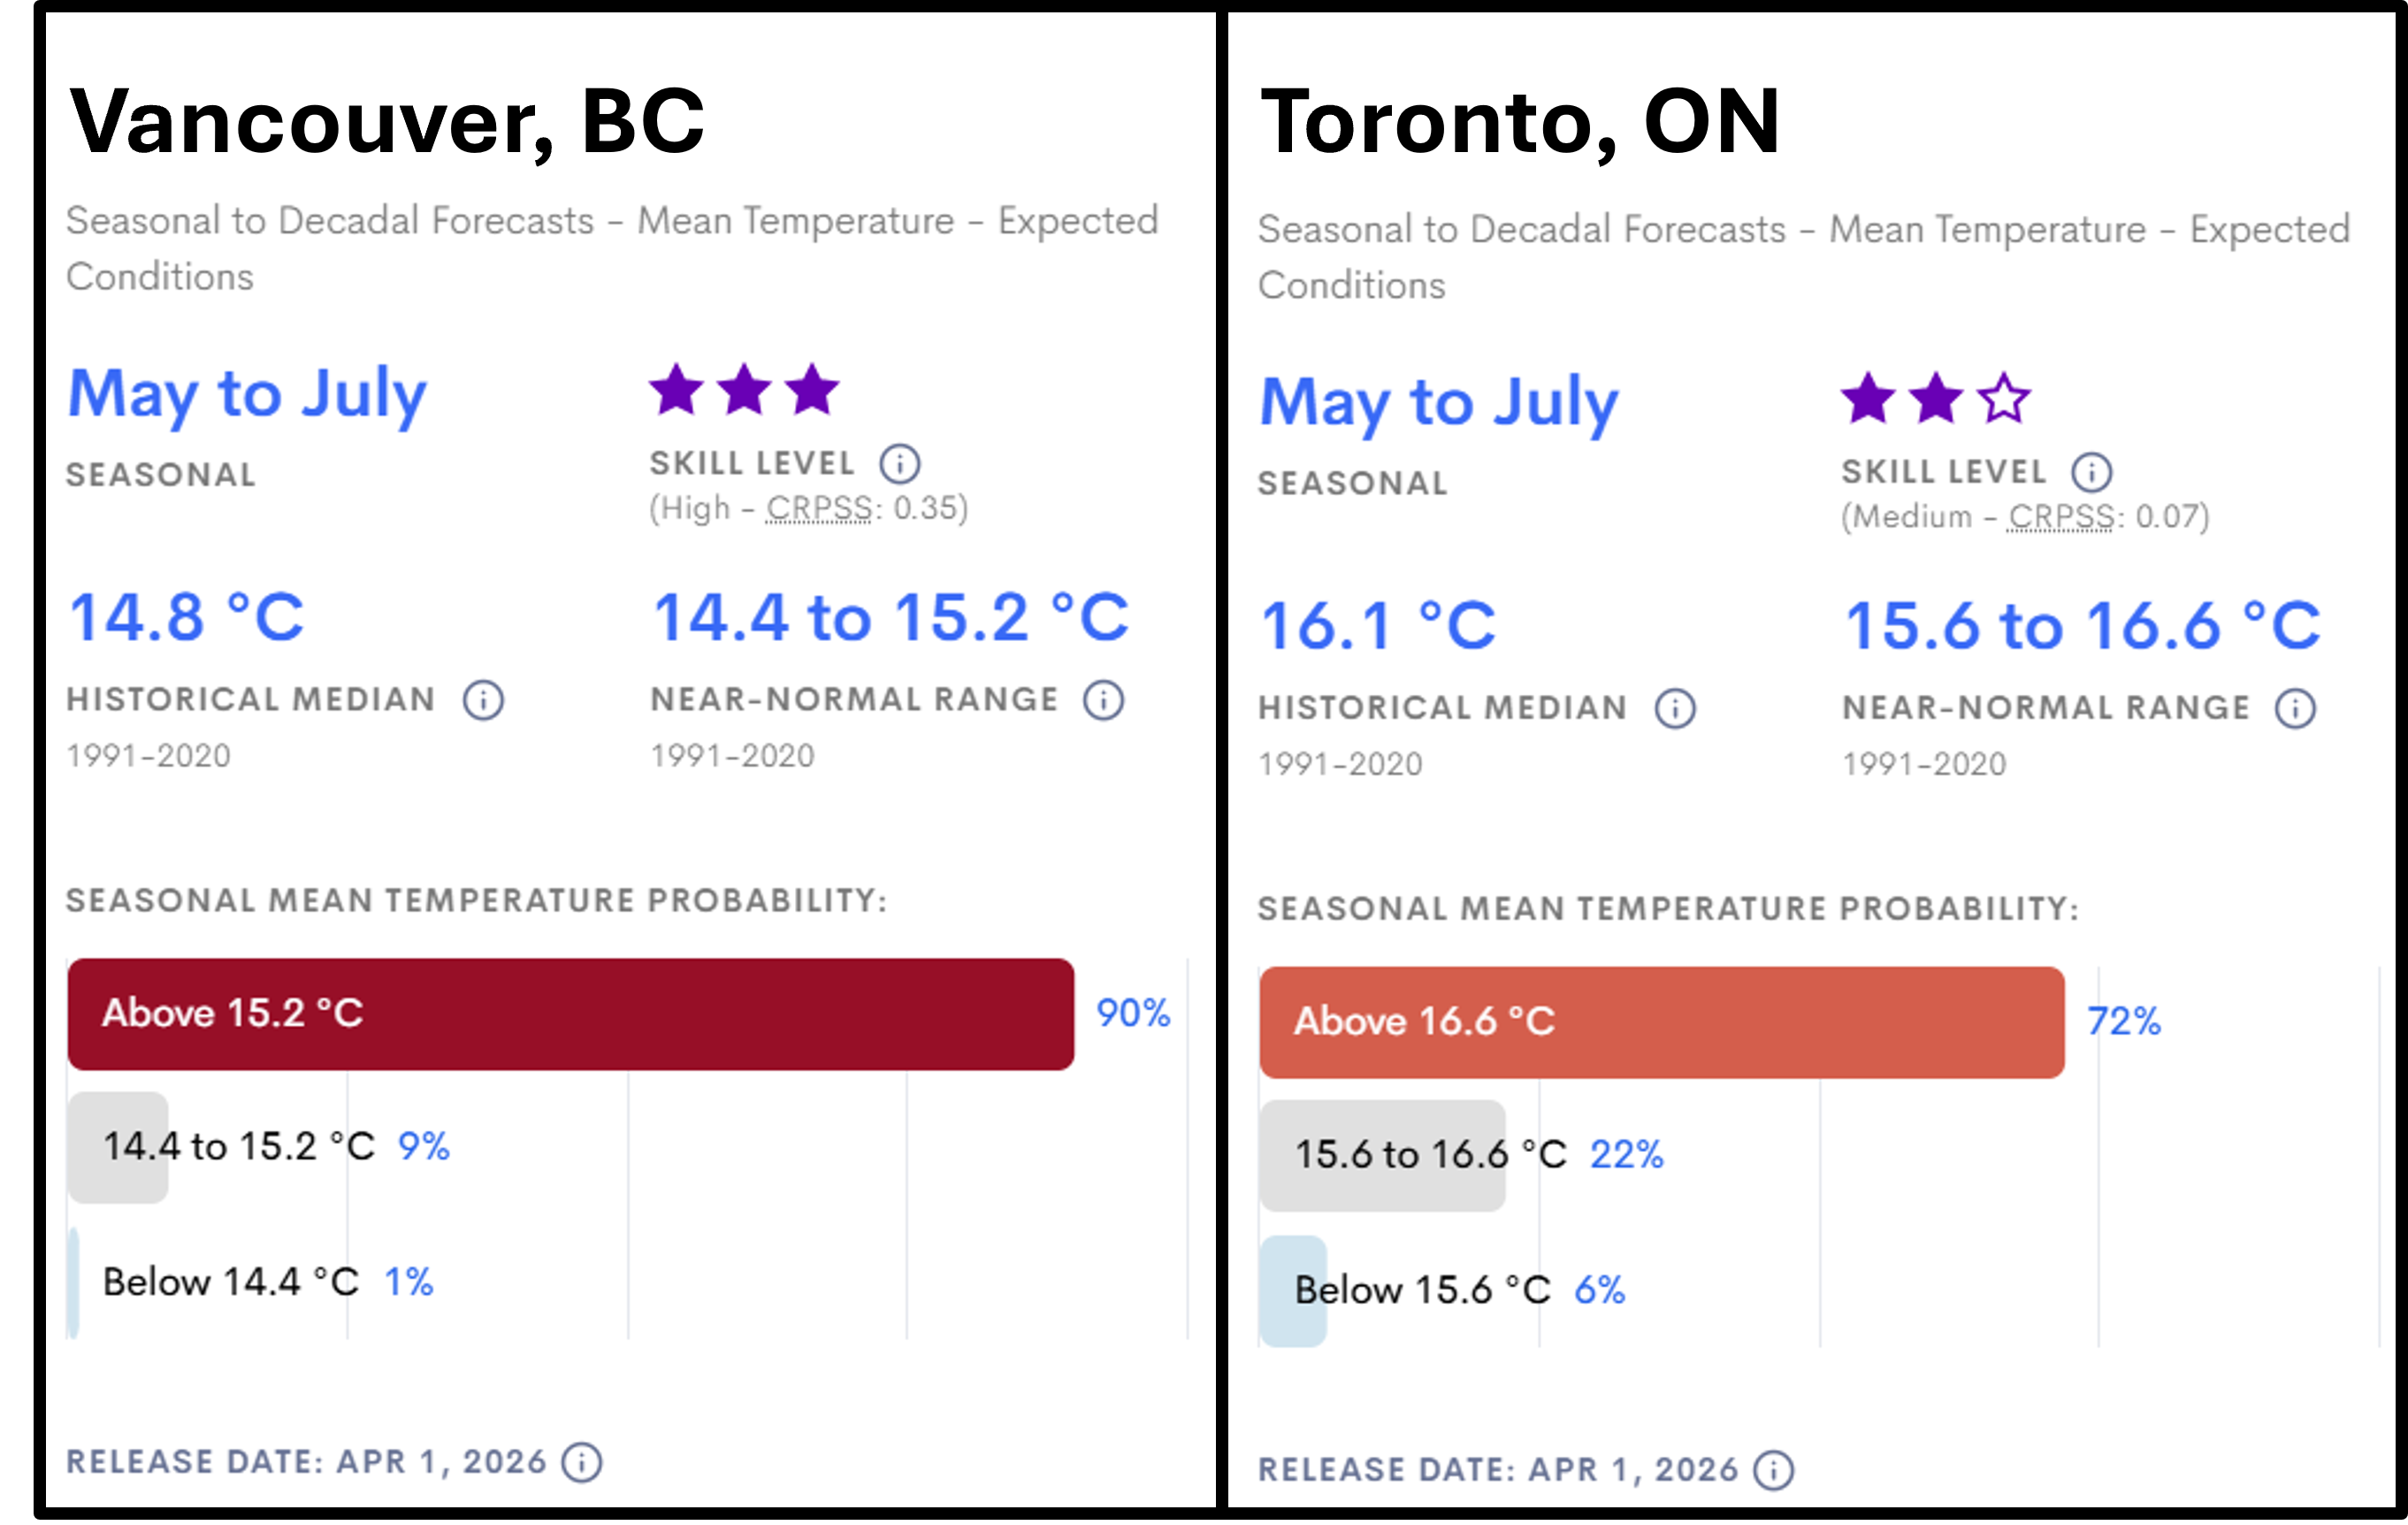
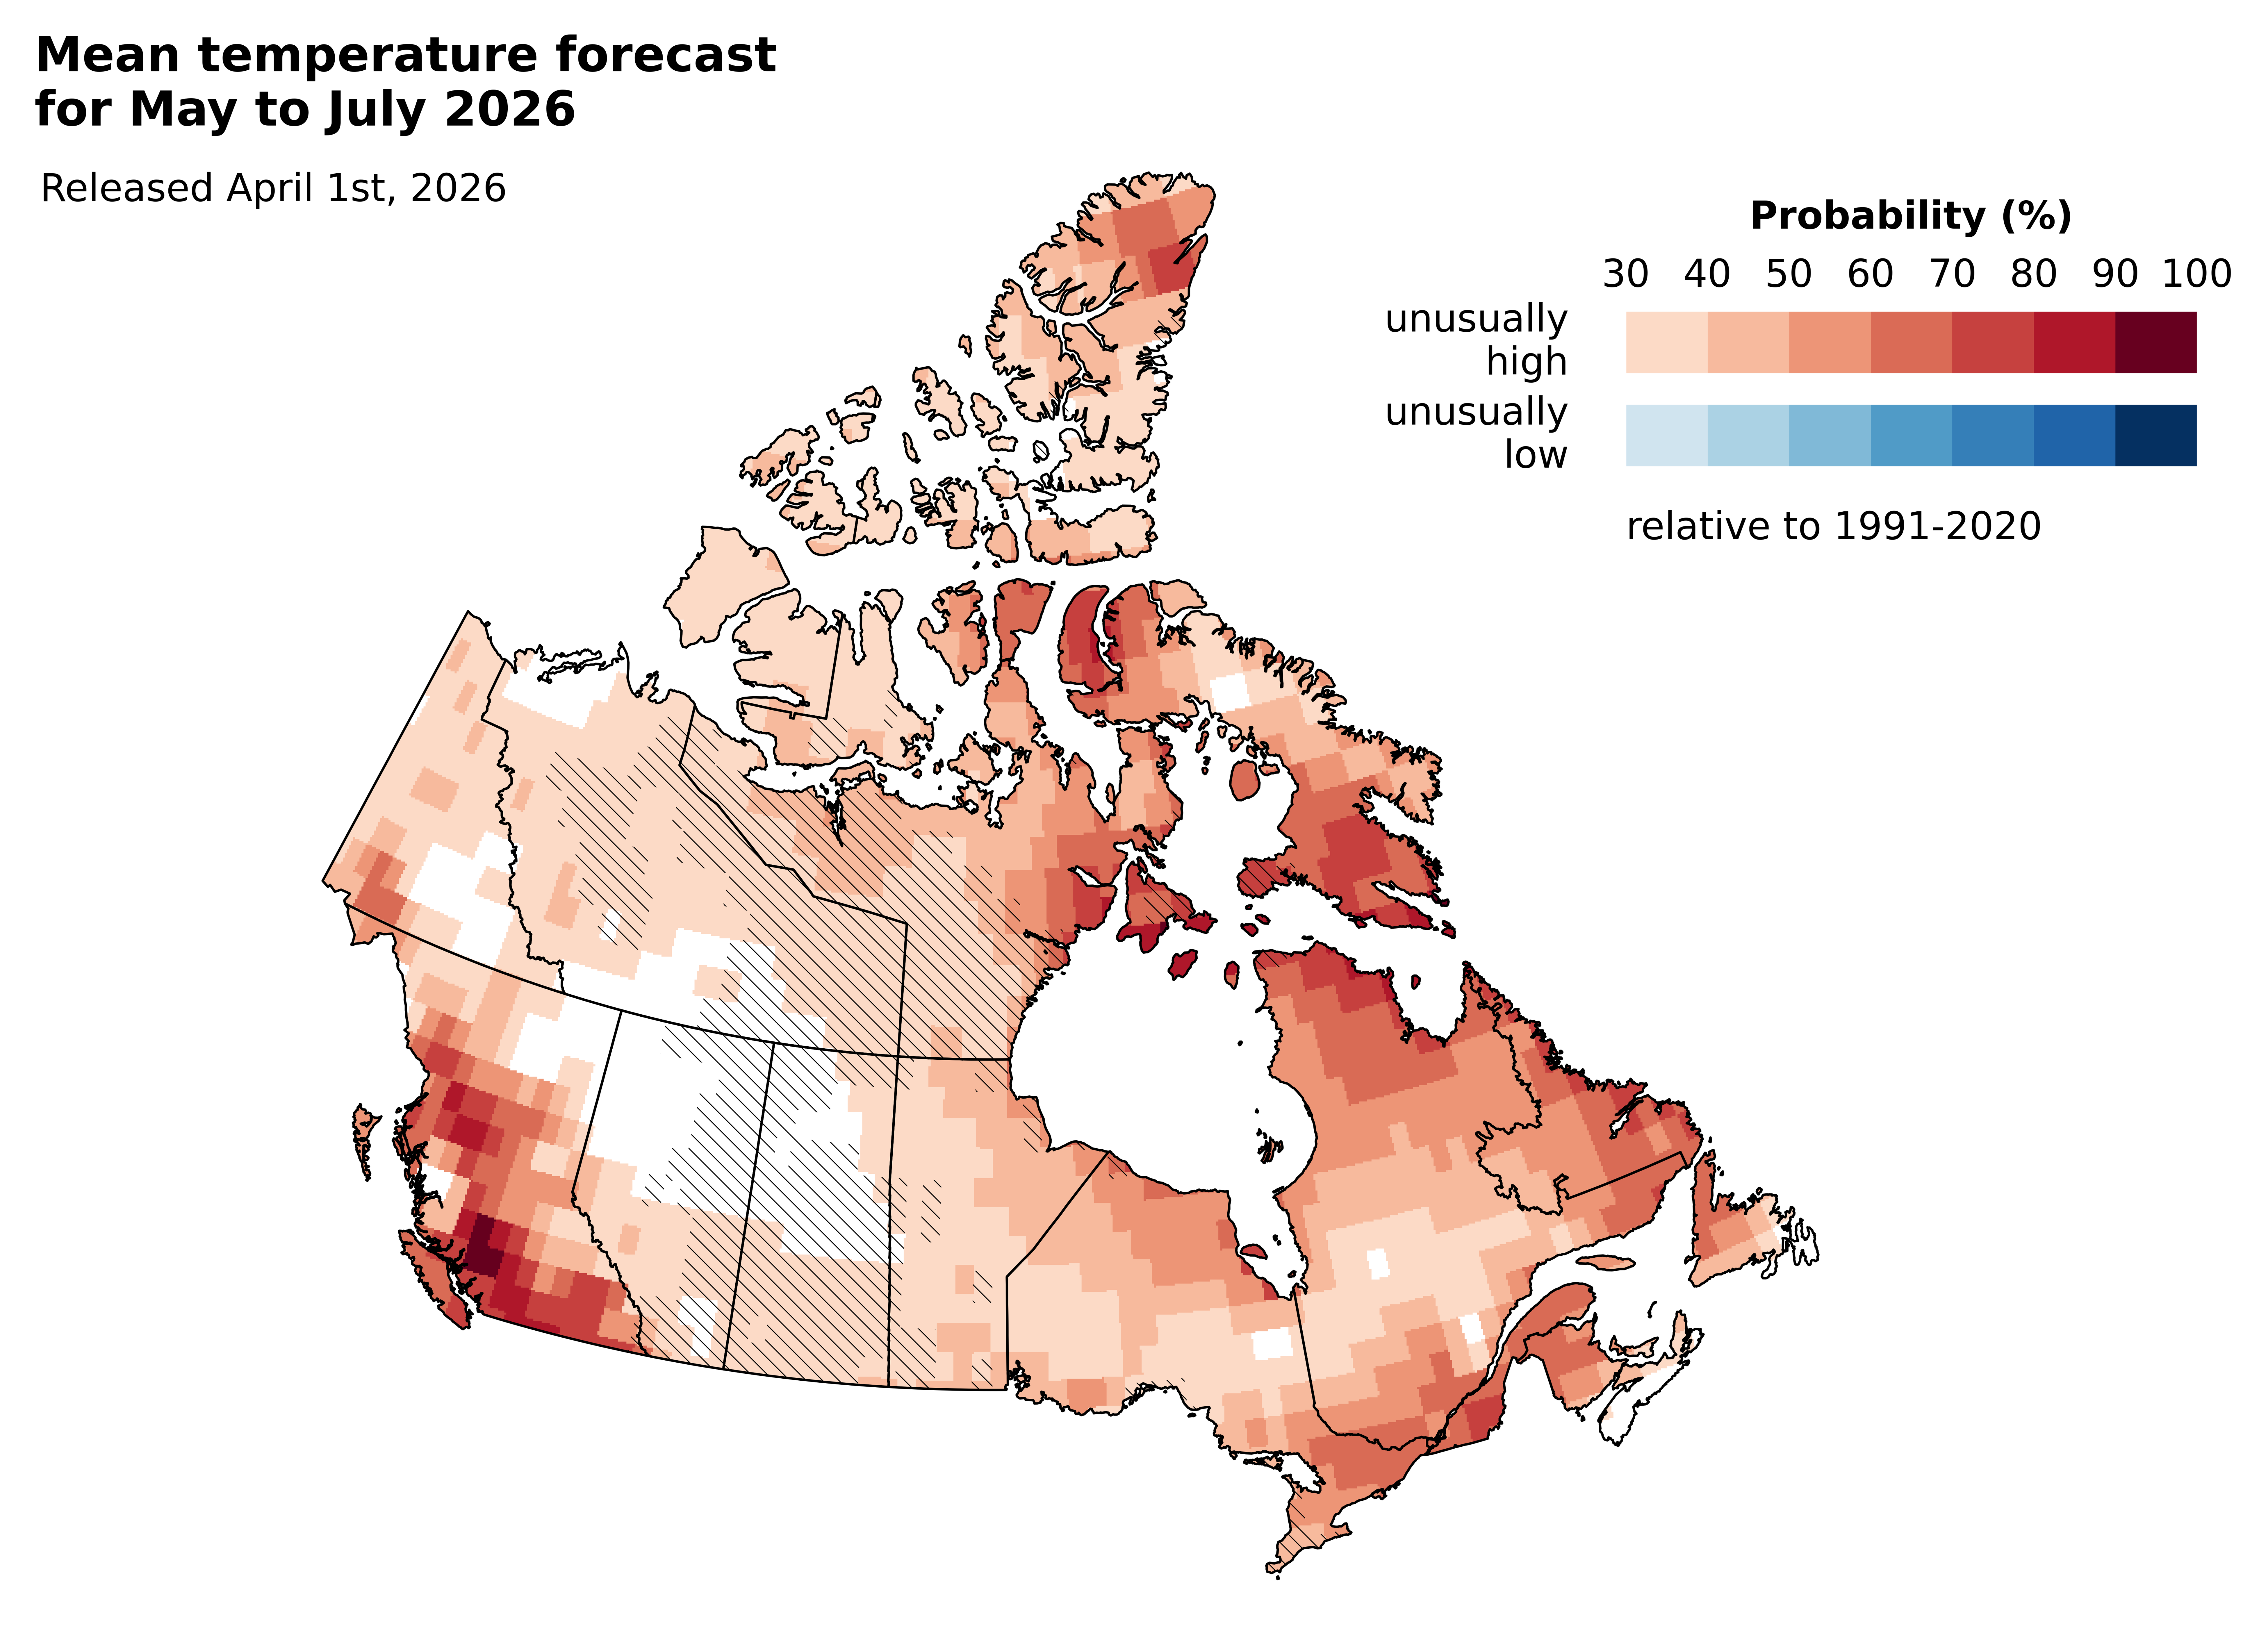
With around two months until the World Cup, the seasonal forecast for May to July 2026 tells us that there is a 90% chance that the average temperature in Vancouver will be warmer than normal2. In Toronto, the probability that the average temperature for May to July 2026 will be warmer than normal is 72% (Figure 2).

The seasonal forecasts on ClimateData.ca also enable us to determine the probability of “unusually hot” average temperatures – where “unusually hot” means at least as hot as the hottest 20% of May to July average temperatures between 1991 and 2020. In Vancouver, that probability is 77%, and in Toronto, it’s 55% (Figure 3). Therefore, it is likely that average temperatures will be unusually hot while the World Cup is taking place in Canada.

Note that the forecast skill for all the probabilities provided indicates that the seasonal forecast is a better guide than the historical climatology. As the tournament gets closer and updated forecasts are released, this skill level will stay the same or improve slightly.

Given the relationship between higher average temperatures and extreme heat, tournament organizers, participating teams, and host cities and venues may wish to consider preparing for hot temperatures affecting this summer’s World Cup. For example, proactive measures could include assessing demand for cooling infrastructure, verifying that shade and water are readily available to spectators, and participating teams evaluating potential adjustments to tactics and substitution strategies.

[1] Normal being average conditions for the 1991-2020 period.

[2] Forecast data as of April 1, 2026.

Figure 2: Screenshots from the seasonal forecast map on ClimateData.ca showing the probability of mean temperatures for May to July 2026 exceeding the normal range in Vancouver and Toronto.

Figure 3: Seasonal forecast map for May to July 2026 showing the probability of the mean temperature across Canada being unusually high or unusually low relative to 1991-2020. White areas have no clear forecast outcome. Cross-hatching indicates areas where the seasonal prediction system has no skill or low skill for May to July forecasts released in April.

Future football

Looking further into the future, PCIC’s Climate Explorer shows that with continued high global emissions, temperatures during a 1-in-20-year extreme heat event in Toronto are projected to exceed 40 ºC by mid-century (SSP5-8.5). Meanwhile, in Vancouver, PCIC’s Climate Projections for the City of Vancouver: Highlights Report shows that in the 1990s there was a 5% chance of temperatures exceeding 33 ºC in any given year, and by mid-century this will increase to almost 50% (SSP5-8.5). In addition, Humidex projections on ClimateData.ca indicate that in both cities hotter temperatures will be accompanied by rising humidity, exacerbating the impacts on human health. Therefore, climate change will test the viability of many North American cities to safely host summer sports events in the future. To pass that test, they must become resilient to rising heat.