Map Insights
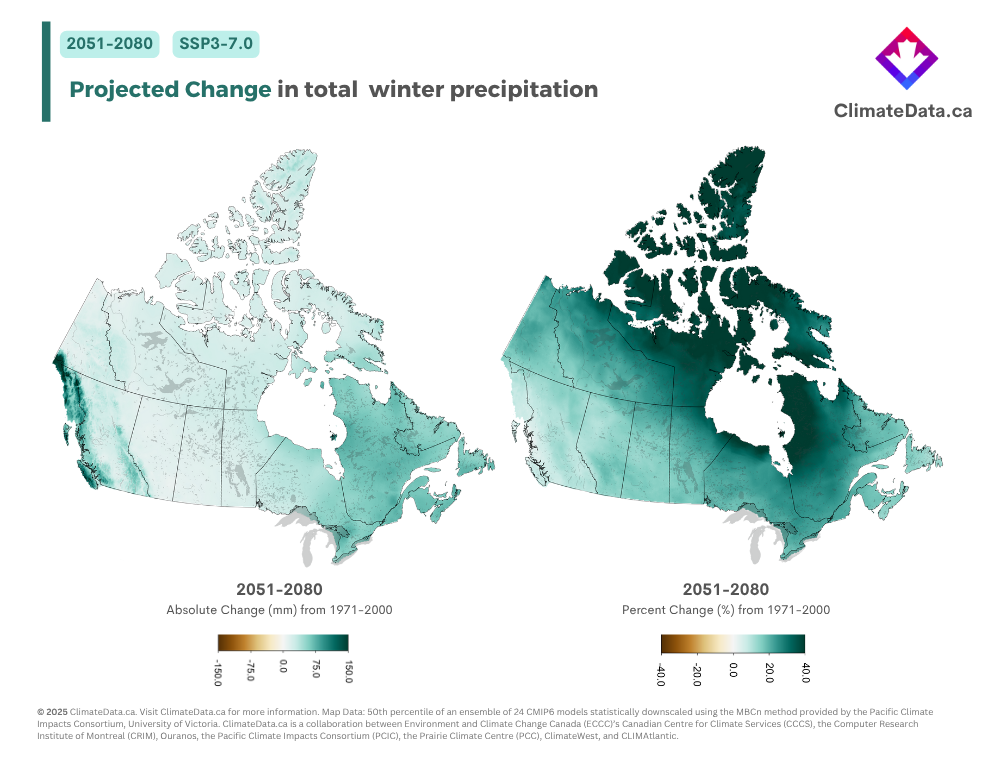
These maps reveal that winter precipitation will increase as the planet warms under the SSP3-7.0 emissions scenario. On both maps, the green shades indicate regions where precipitation is expected to increase. White indicates no change, while brown indicates a decrease in winter precipitation.
The two delta maps tell very different stories about projected changes in winter precipitation. The absolute delta map (left) indicates that the greatest absolute change in projected winter precipitation will occur along coastal and southwestern British Columbia, with secondary maxima seen over the Rocky Mountains, Ontario, Quebec, and Atlantic Canada.
Conversely, on the percent delta map (right), the greatest relative winter precipitation changes occur in northern Canada, specifically across Nunavut and regions bordering Hudson Bay. Parts of coastal British Columbia, meanwhile, appear on this map as very light green or even white, signifying very little to no change in relative winter precipitation.


