What are Shared Socioeconomic Pathways (SSPs)?
Shared Socioeconomic Pathways are a set of narratives describing possible future development pathways for human society, particularly in relation to its use of fossil fuels and the social and economic factors which drive fossil fuel use. These pathways explore a range of technological, socioeconomic and policy futures as well as consider challenges to mitigation and adaptation.1 Five pathways have been developed by the international scientific community – sustainable development (SSP1), middle-of-the-road development (SSP2), regional rivalry (SSP3), inequality (SSP4) and fossil-fueled development (SSP5) – which allow practitioners to explore climate changes across a range of very different futures.
The five SSP pathways can be characterized in terms of the socioeconomic challenges they imply for mitigating and adapting to climate change (Figure 1). SSP1 (Sustainability) has few challenges to both mitigation and adaptation. In this pathway, policies focus on human well-being, clean energy technologies, and the preservation of the natural environment. In contrast, SSP3 (Regional Rivalry) is characterized by many challenges to both mitigation and adaptation. In this pathway, which relies heavily on fossil fuels and an increased use of coal, nationalism drives policy and focus is placed on regional and local issues rather than on global issues. The other SSPs “fill in the spectrum” of possible futures. SSP4 (Inequality), which follows a similar energy future to SSP1, is defined by many challenges to adaptation and few challenges to mitigation. SSP5 (Fossil-fueled Development), also heavily reliant on fossil fuels including coal, is characterized by many challenges to mitigation and few challenges to adaptation, while SSP2 (Middle of the Road) represents moderate challenges to both mitigation and adaptation and follows a pathway of balanced energy development.
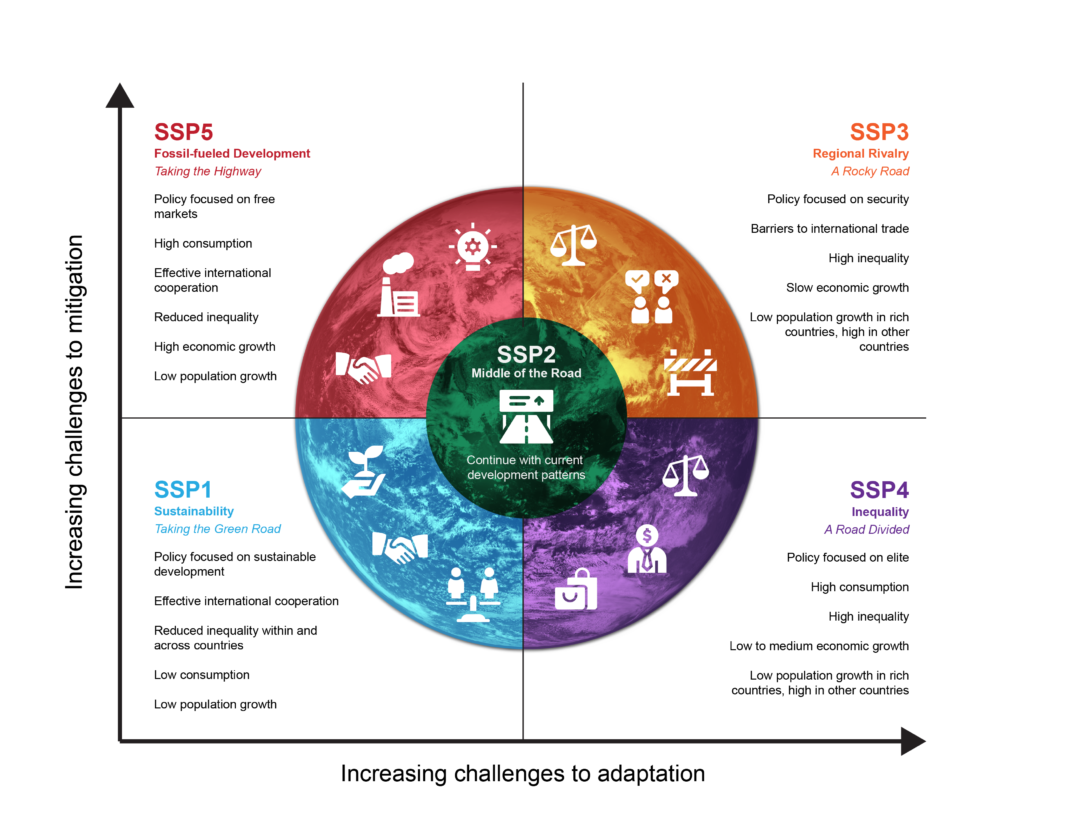
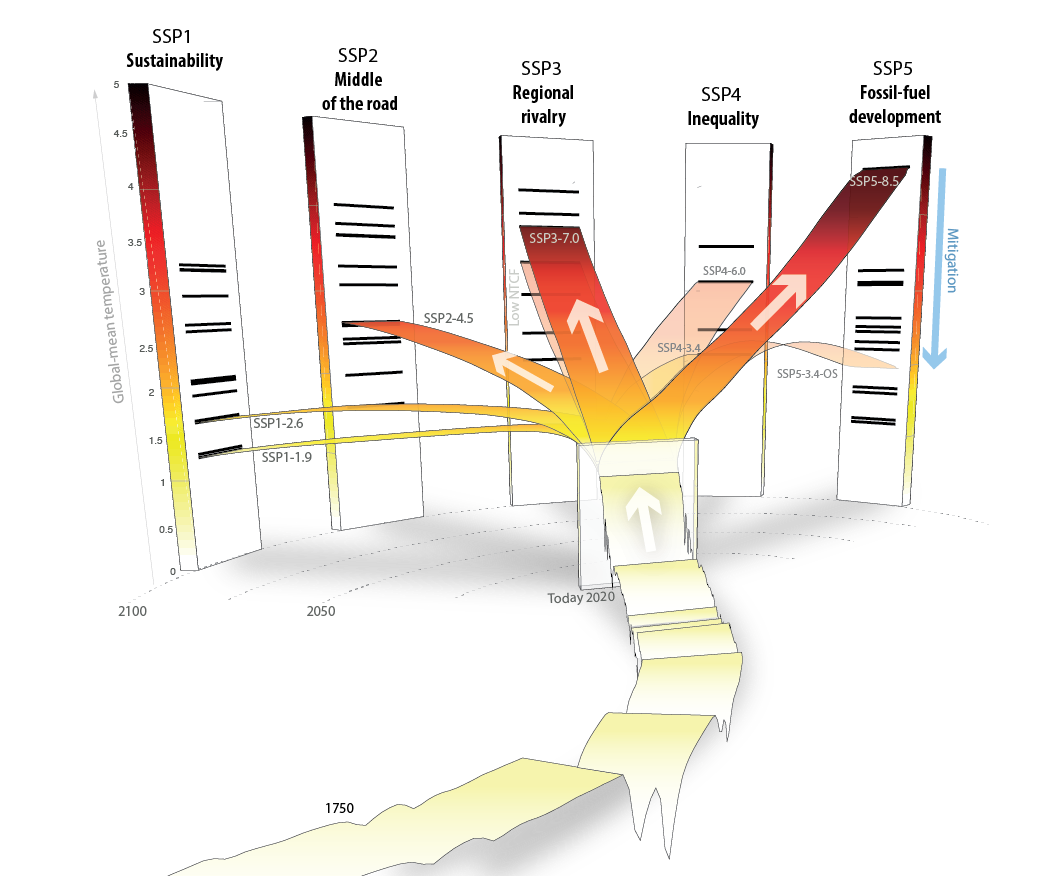
Figure 1: The Five Shared Socioeconomic Pathways
The five SSP-based scenario trajectories used in the CMIP6 models and the higher or lower challenges associated with them regarding the implementation of mitigation or adaptation strategies.
The SSP narratives give a general description of the development pathways, e.g., for SSP1 (Sustainability), “the world shifts gradually, but pervasively, toward a more sustainable path, …, consumption is oriented toward low material growth and lower resource and energy intensity”1. The narratives are internally consistent in that they describe “the major socioeconomic, demographic, technological, lifestyle, policy, institutional and other trends”1 of each pathway and they underpin how this information is quantified. Each narrative is accompanied by quantitative information about the key scenario drivers such as population, economic growth and urbanization. To turn these narratives into scenarios containing quantitative projections of energy use, land use and greenhouse gas and aerosol emissions, Integrated Assessment Models (IAMs; see Box 1) are required.