This functionality is being introduced in phases to the other prescribed area definitions (e.g., watershed, census subdivision, etc.) as ClimateData.ca continues to evolve. For the initial release, the shapefile upload option is available only for selected variables and indices that support customization (e.g., metrics based on threshold values such as the number of days above a specified temperature). This phased approach reflects system capacity considerations and allows the feature to be rolled out in a stable and reliable manner. Additional datasets and analysis options may be added to future updates.
Important considerations
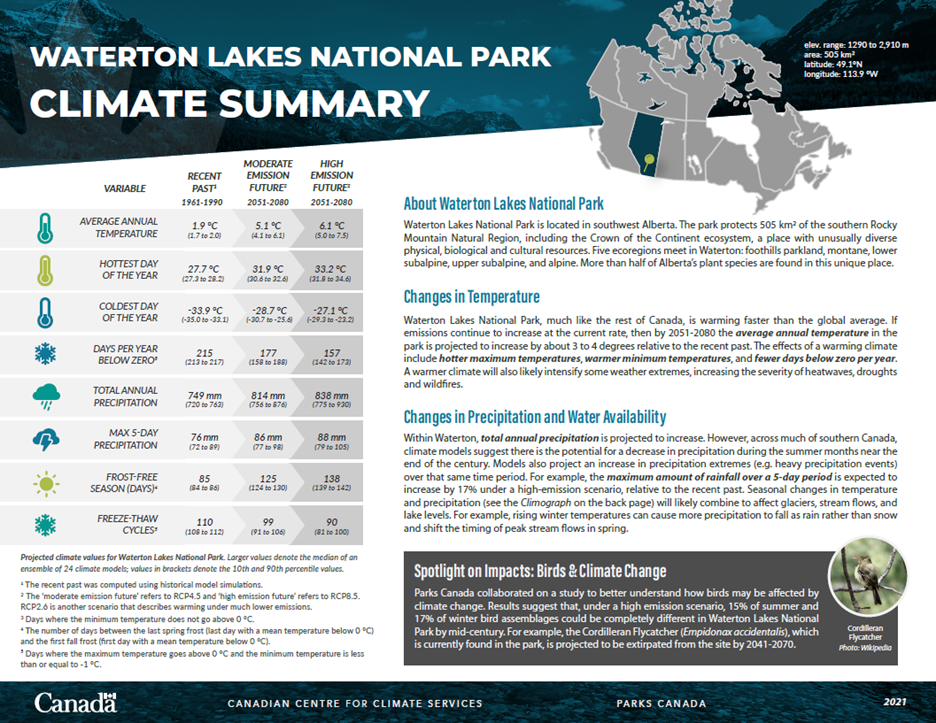
As noted in Box 1, spatially averaged climate data are most appropriate for high-level analysis, training, and communication purposes. When applied to very large or geographically diverse regions, averages can mask important local variation in climate conditions. For detailed design, impact assessment, or site-specific planning, users are encouraged to work with smaller regions or location-based data that better reflects local conditions. To support appropriate use and ensure reliable processing, shapefiles uploaded to ClimateData.ca must represent areas smaller than 500,000 km².
What’s available today?
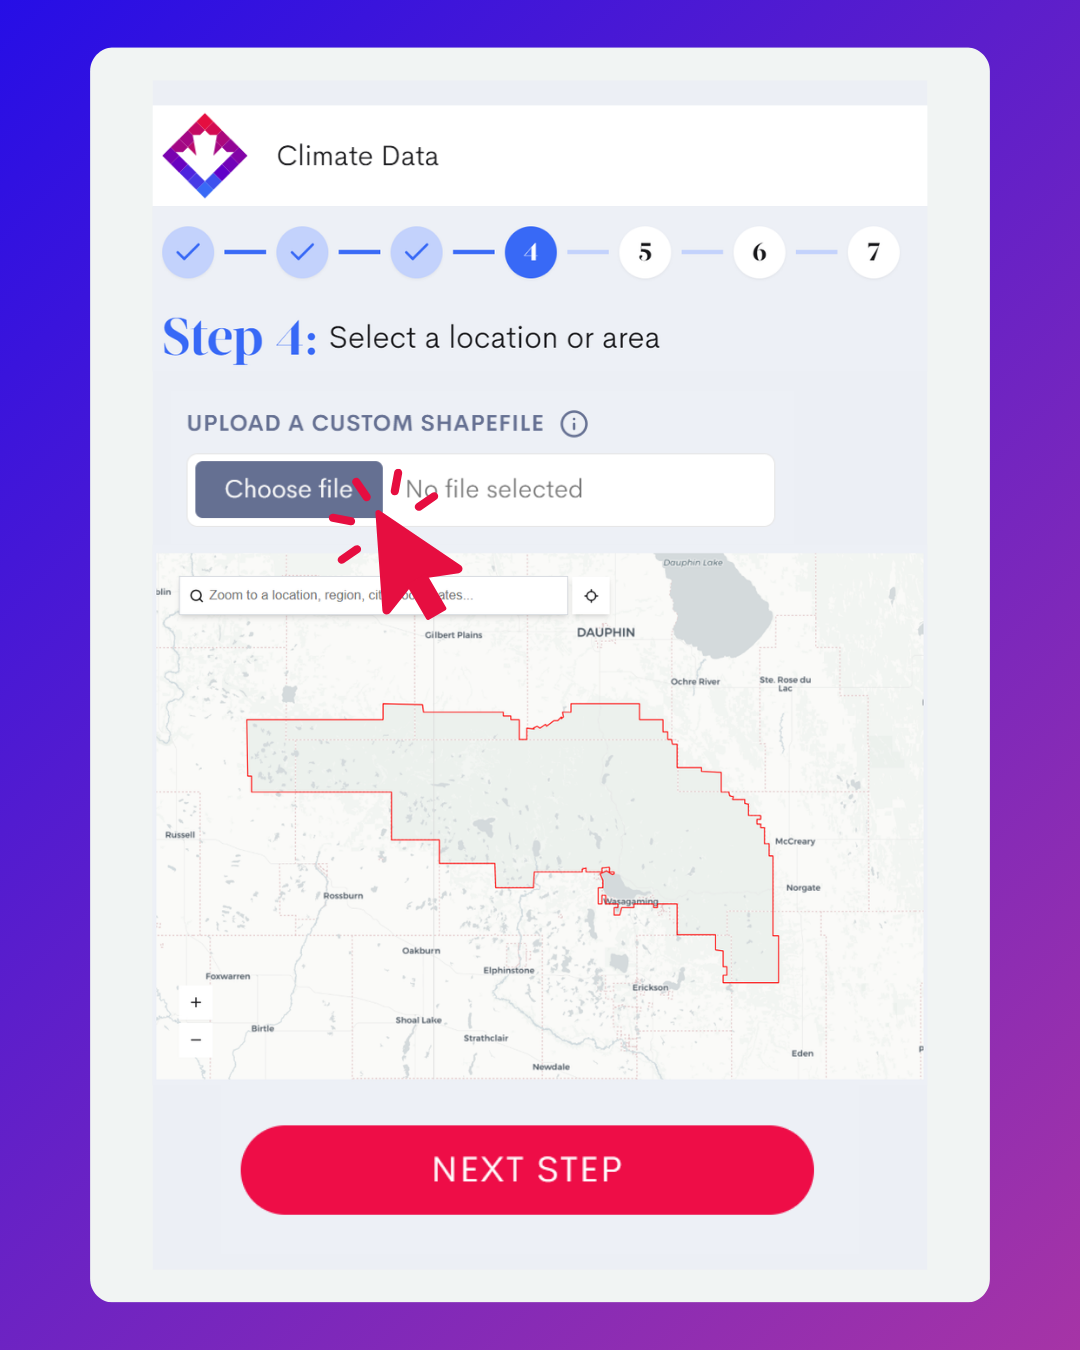
This initial release unlocks the custom shapefile feature for selected variables in the Download section of ClimateData.ca only. These include core climate projection variables commonly used in planning and assessment, including:
- Wet Days
- Average “Wet Day” Precipitation Intensity
- Maximum Consecutive Wet Days
- Maximum Consecutive Dry Days
- Days above Tmax and Tmin
- Days above Tmax
- Days above Tmin
- Days below Tmin
- Degree Days Above a Threshold
- Degree Days Below a Threshold
- Heat Wave
- Heat Wave Total Duration
- Heat Wave Frequency
- Days with a Freeze–Thaw Cycle
- Cold Spell Days
Future updates are expected to expand this capability for more datasets and variables.
Stay tuned for more updates by subscribing to the ClimateData.ca newsletter.