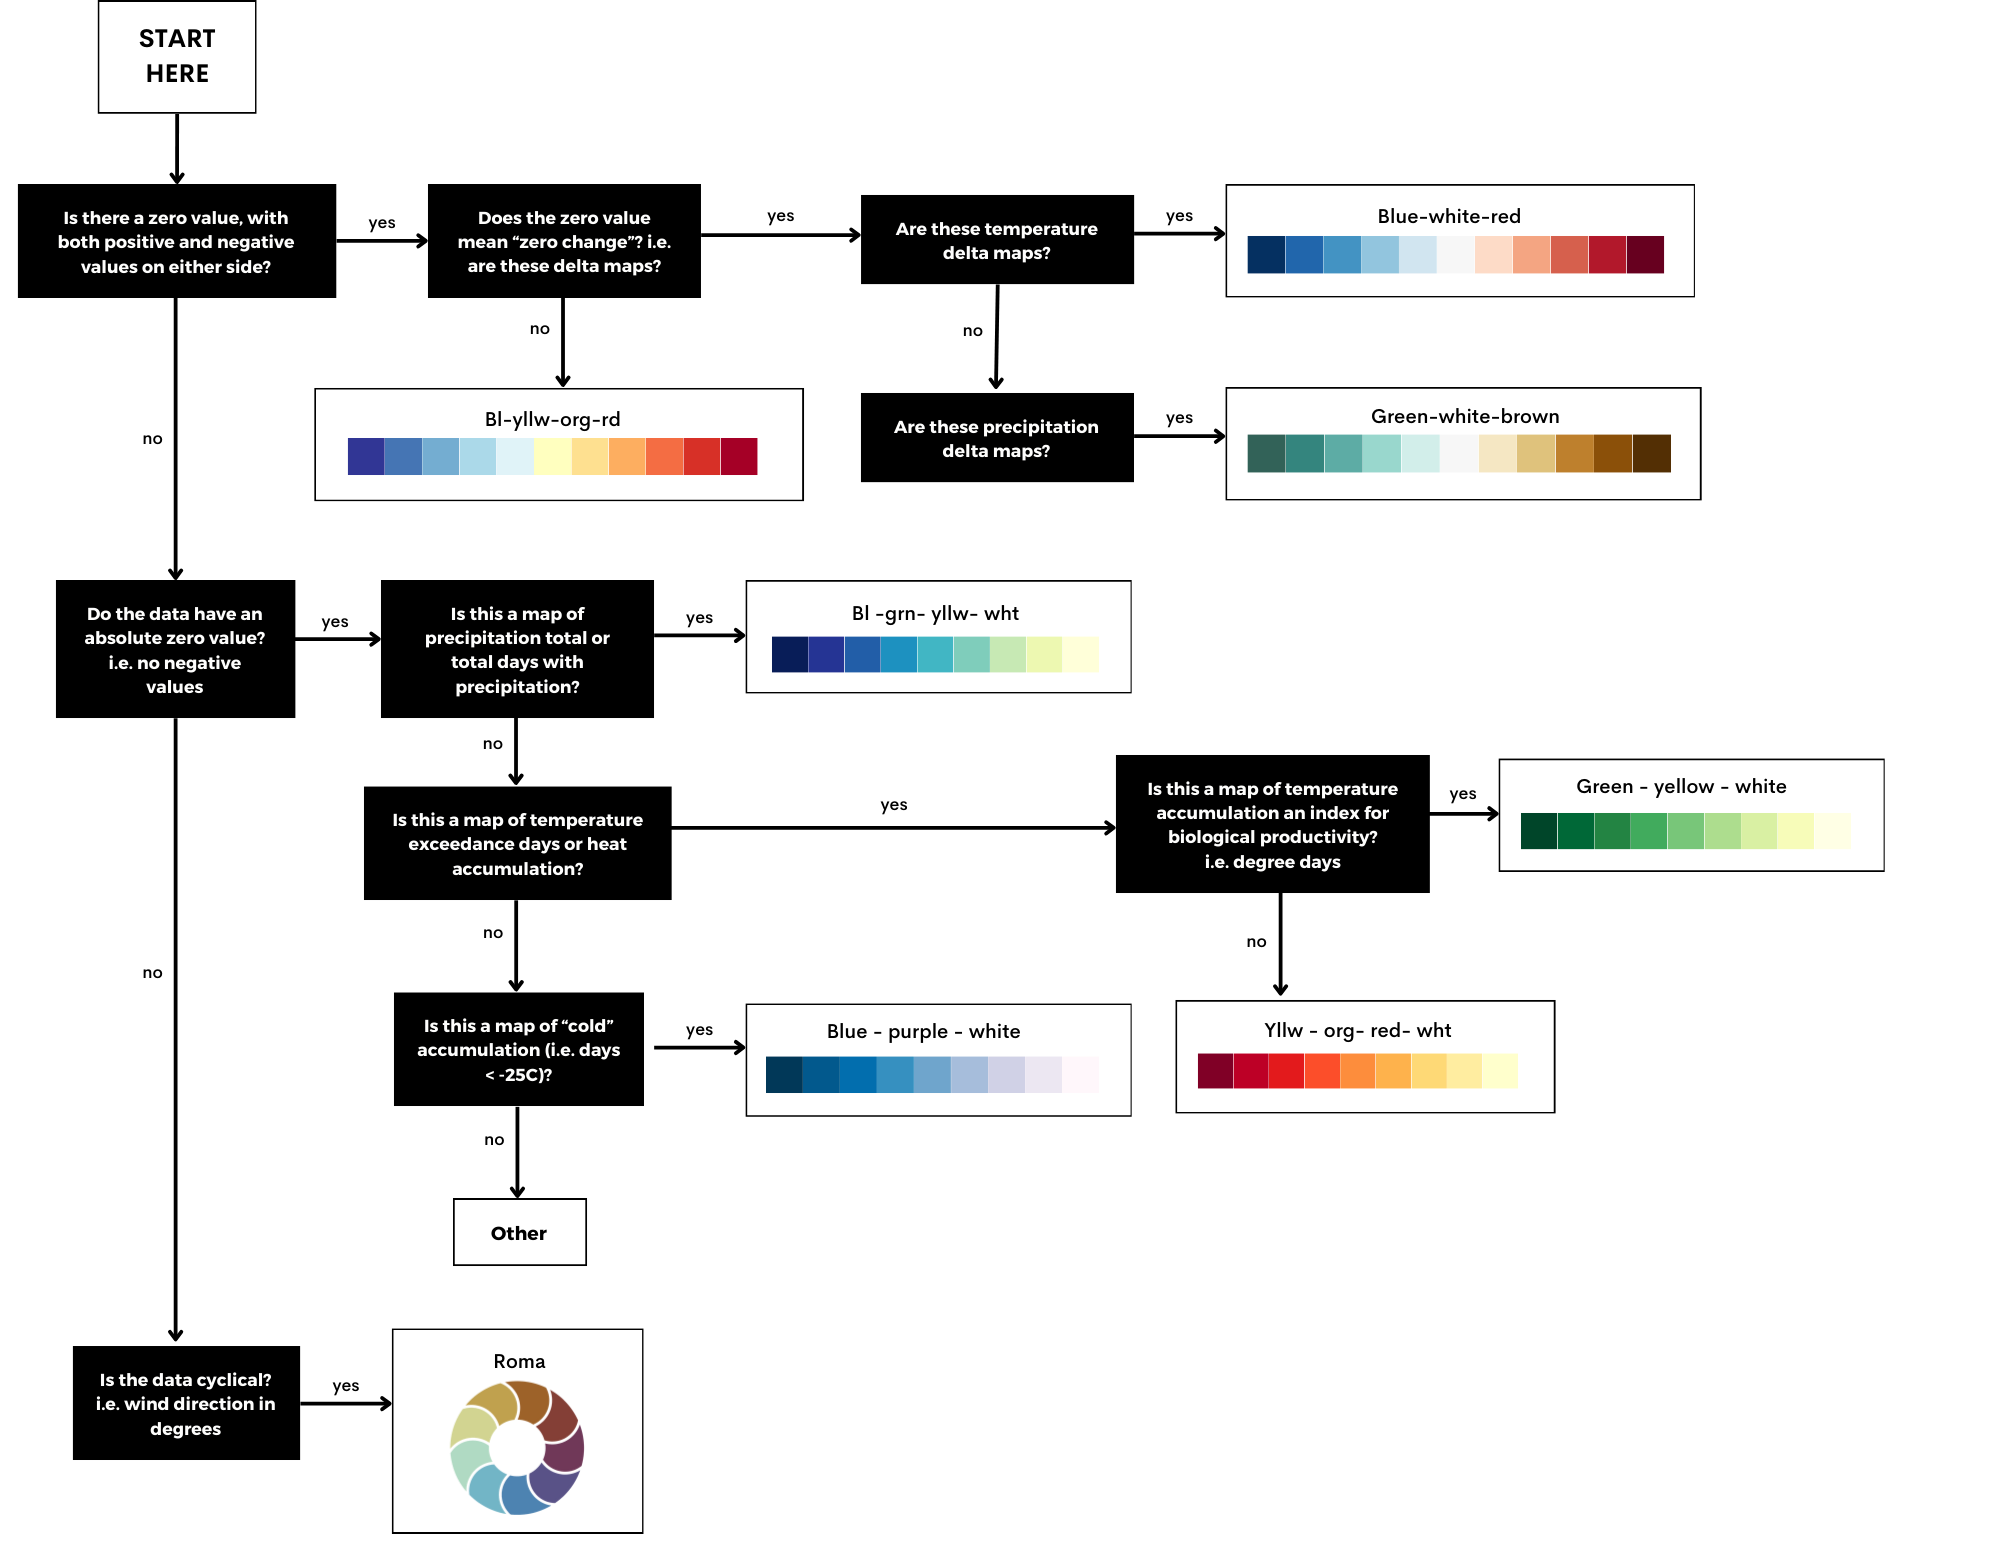
The Colour Ramp Decision Tree
Following the IPCC style guide2, ClimateData.ca approached the transition from the traditional rainbow color ramp to alternative color palettes (Figure 4). The team used the online tool ColorBrewer.org to assess various color ramps, which includes the colour ramps recommended by the IPCC. ColorBrewer provides colour ramps that focus on colour distinctiveness and readability.
Figure 4: “Before and after” example of the new colour ramps on ClimateData.ca
Subsequently, maps on ClimateData.ca underwent a kind of “story-telling” evaluation, focusing on the main points the maps are conveying and the types of colours the users expect to be tied to the different climatic changes being visualized. This involved assessing if the maps depict significant temperature changes and how these changes compare to recent historical data. It also assessed whether the visual cues, such as the color red, intuitively convey the desired meaning, such as indicating an increase in frequency or temperature, or possibly both. This “story-telling” evaluation resulted in the use of an additional colour ramp – blue-yellow-orange-red (Figure 5) to better represent some of the datasets provided.
Figure 5: The blue-yellow-orange-red colour ramp above was added to the decision-tree as a result of assessing the types of colours the users expect to be tied to the different climatic changes being visualized
By carefully considering the benefits and drawbacks of each colour ramp from a readability and accuracy point of view, a final ‘colour ramp decision tree’ was produced.
ClimateData.ca’s decision tree (Figure 6) for selecting colour ramps considers both the scientific integrity of data representation and the user experience. Almost always this constitutes a trade off, allowing the maps to be readable at a variety of scales while also trying not to mis-represent the data in any way.
The decision tree also emphasizes the importance of accessibility and inclusivity, advocating for colour schemes that are perceptible to individuals with various visual abilities. This attention to detail ensures that climate maps are not only accurate and informative but also more accessible.
Figure 6: Decision-tree for assigning new colour ramps on ClimateData.ca
Future improvements to ClimateData.ca’s maps
This evolution in map design reflects a broader commitment to enhancing public understanding of climate data, and our team is excited about what’s coming next. Soon, ClimateData.ca will be getting a major overhaul, with large improvements coming specifically to the mapping interface. Users will have the option to select different colour ramps and have the maps dynamically re-draw on the screen. In addition, we are also working on new applications that can generate Canada-wide maps on the fly using user-set maximum and minimum legend values. Powerful new cloud-based computing options are opening up all sorts of innovations, so be sure to check back in often so you can take advantage of these new tools in your line of work.
1 Scrap rainbow colour scales | Nature
2 IPCC_AR6_WGI_VisualStyleGuide_2022.pdf


