What are IDF Curves?
Intense precipitation events can deliver large amounts of rain over short periods of time. This rain, as well as related flooding, can overwhelm storm drains, flood basements, wash out bridges and roads, and trigger landslides. To reduce the risk of these impacts, engineers, hydrologists, planners and other decision makers rely on accurate information about extreme rainfall events. IDF curves are one important source of this information.
Three main elements are described in IDF curves:
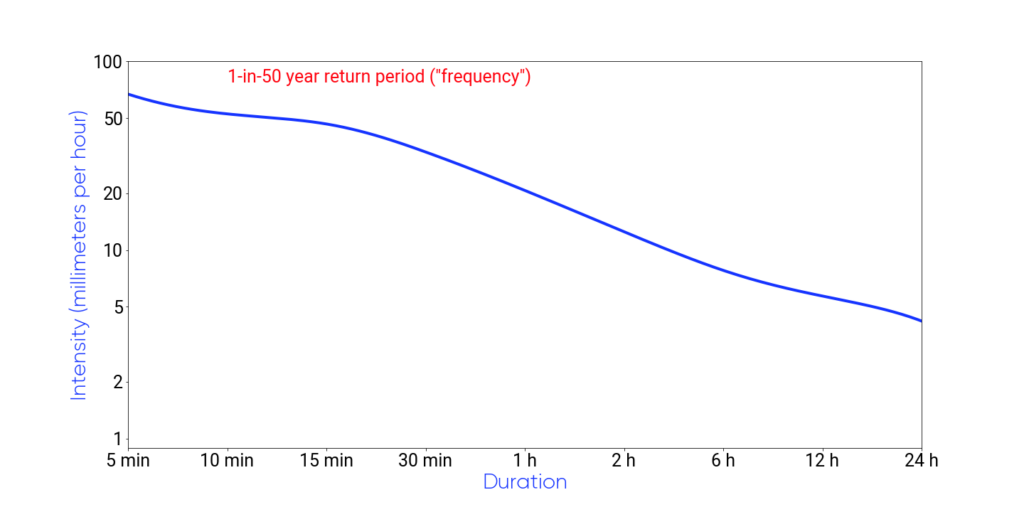
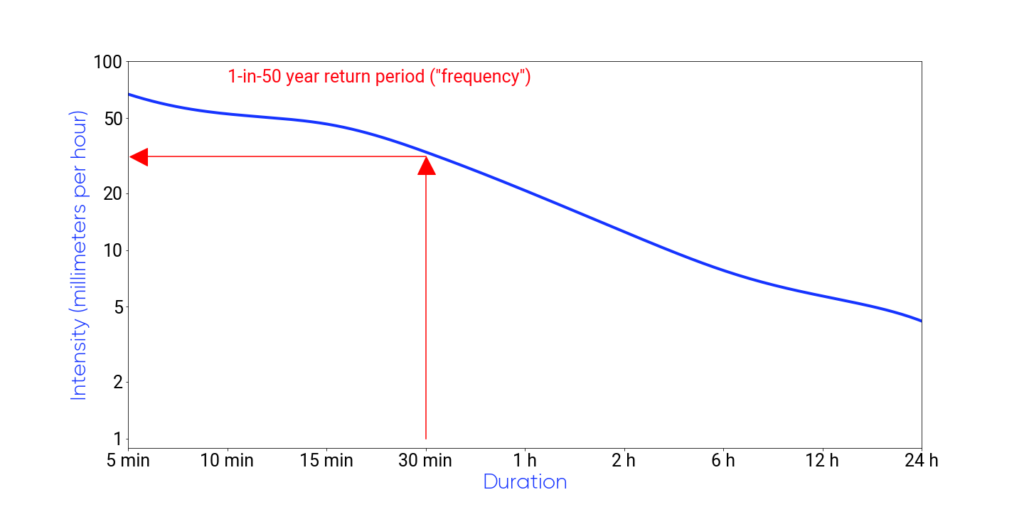
Duration: The period of time of interest. Typical IDF curves include extreme precipitation durations ranging from 5 minutes to 24 hours.
Intensity: The average rainfall rate over the specific duration of interest, in units such as mm/h.
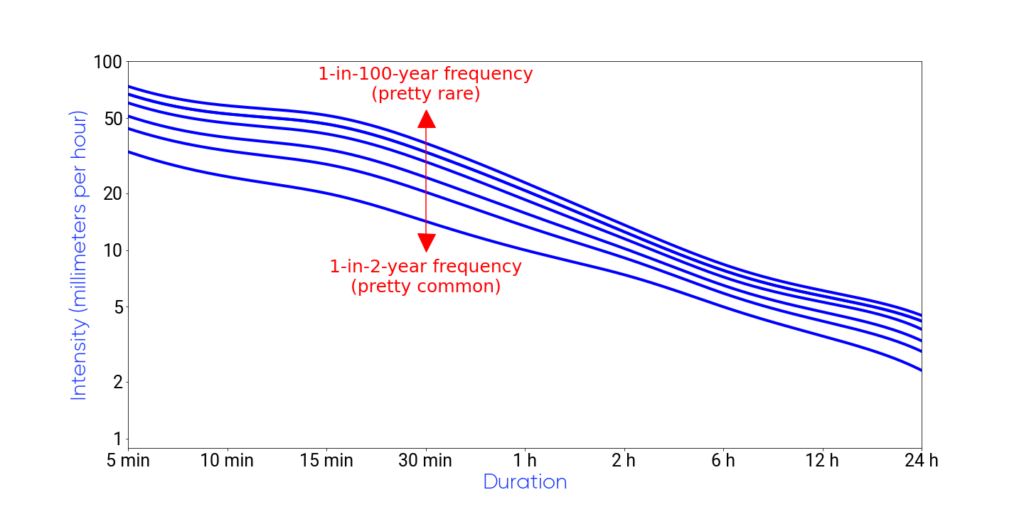
Frequency: To plan for extreme events of a specified duration and intensity, it matters how often such events occur.
This is often described as a return period, which is defined as how often, on average, the event is expected to occur. Frequency can also be thought of in terms of probability or likelihood. For example, an event with a 1-in-20 year return period will occur on average once every 20 years, and therefore has a 1-in-20, or 5%, chance of occurring each year.
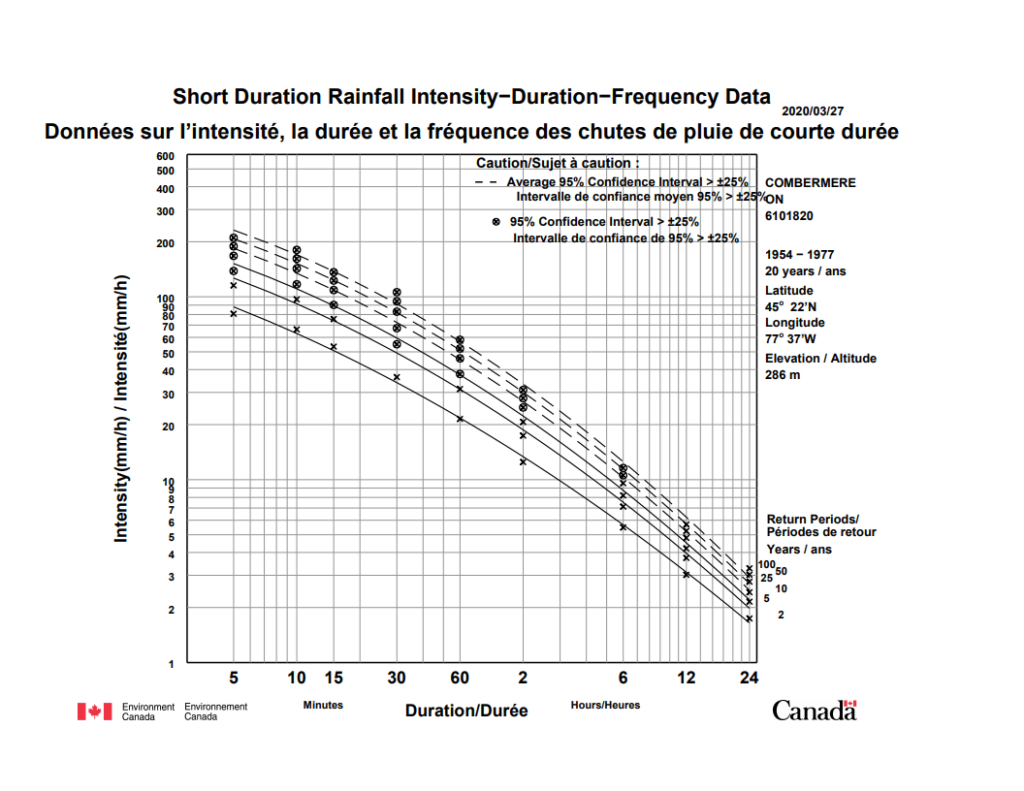
To use IDF curves, users can choose the rainfall duration (horizontal axis) and return period of interest (different lines) for their application, to determine the relevant rainfall intensity (vertical axis).
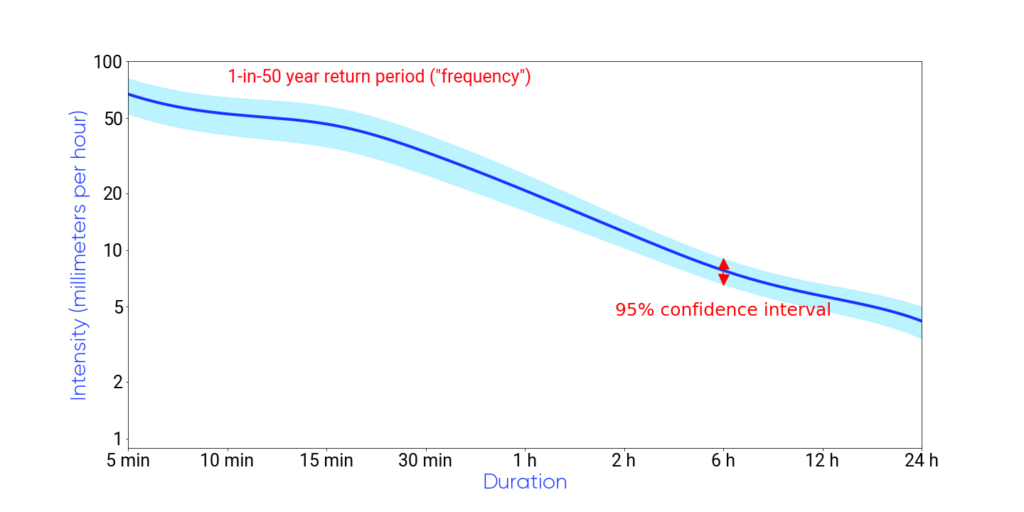
To help understand where data is most reliable, some IDF curves contain additional information known as confidence intervals, which describe the uncertainty in the IDF values that may arise from statistical chance. Simply put, users can trust that rainfall intensity values for a given duration and return period are likely to fall within the confidence interval that brackets the central IDF curve line.
Consider a 10 mm/hr rainfall intensity central value that is bracketed by a 95% confidence interval at 5 mm/hr and 15 mm/hr. This means that 95% of the time (19 times out of 20), the ‘real’ value of rainfall intensity for this duration/return period will fall between 5 and 15 mm – and, conversely, that there is only a 5% chance that the value will fall outside this range due to particularly abnormal storms or weather patterns.
It is important to note that this measure is a statistical one only and does not account for factors that have the potential to affect the IDF values such as decadal instrument errors, changes to station locations, climate variability, or long-term climate change. Other measures are taken to address each of these potential sources of uncertainty such as adjustment and homogenization of stations, using long time periods to derive IDF curves, and computing future projections of IDF curves.
ECCC IDF curves represent confidence intervals in a very specific way. Solid lines/crosses indicate that the 95% confidence interval for the curve/point in question is narrow – less than 25% of the central rainfall intensity value (in other words, uncertainty in the value is relatively low).
Conversely, dashed lines/circled crosses indicate curves/points where the 95% confidence interval is wide – more than 25% of the actual rainfall intensity value. In this situation (which occurs more often for shorter durations, and longer return periods), the central value of rainfall intensity should be treated with relatively more caution.

