Introducing Future Building Design Values: Choosing and Using Future Climatic Design Data

The Future Building Design Value Summaries on ClimateData.ca provide climatic design data and guidance for building design to complement the building code. The Design Value Explorer (DVE) tool offers access to the full suite of future climatic data from the Climate Resilient Buildings and Core Public Infrastructure report to update the National Building Code of Canada and the Canadian Highway Bridge Design Code. Together, the Future Building Design Value Summaries and the DVE tool support the design of climate-resilient buildings under various future global warming scenarios.

Key Messages

  • Designing buildings and bridges using historical climate data alone is no longer sufficient to ensure current or future resilience in the face of climate change.
  • In our warming climate, it is important to determine whether present-day or end-of-service-life design loads are adequate for withstanding the future climate conditions to which buildings could be exposed, and to design accordingly.
  • In our warming climate, it is important to determine whether present-day or end-of-service-life design loads should govern the design process, and to design accordingly.
  • The Design Value Explorer (DVE), available through the Pacific Climate Impacts Consortium (PCIC) website, provides projected future building and bridge design data for a range of global warming levels.
  • The Future Building Design Value Summaries are one-page documents that include site-specific projections for a subset of variables from the DVE accompanied by information on how to use the data in building design.
  • Future Building Design Value Summaries are available on ClimateData.ca for the more than 660 locations across Canada that are included in the National Building Code of Canada.

The National Building Code of Canada (NBC) provides the climatic data necessary for the safe design of buildings in Appendix C, Table C-2. These data have previously only been derived from historical records and therefore may no longer adequately reflect either present-day environmental loads, or future loads under a changing climate. Climate change can create life-safety risks by impacting the performance of buildings and their subsystems. As a result, to support resilient building design, the Canadian government, in collaboration with partners, has developed a new climatic design dataset that adjusts each design variable in Table C-2 of the NBC to account for climate change1. This dataset is intended to inform potential updates to the National Building Code of Canada (NBC 2015, Table C-2) and the Canadian Highway Bridge Design Code (CHBDC/ CSA S6 2014, Annex A3.1), which have traditionally relied solely on historical data. The Climate-Resilient Buildings and Core Public Infrastructure: an assessment of the impact of climate change on climatic design data in Canada (CRBCPI) report describes the climate modelling and analysis methods used to develop this information.

Box 1.1 Design for Life Cycle Stringency

As the global temperature increases, so does the magnitude of many of the climatic design variables. However, not all variables become more extreme with climate change; some climate loads will actually decrease over time. Since buildings and their systems need to withstand both present and future climates at the end of service life, the most stringent climatic design variable should be considered for each system’s anticipated service life, regardless of whether it is a historical or future value (i.e., Minimax approach).

What is the Design Value Explorer?

The Pacific Climate Impacts Consortium (PCIC) developed the Design Value Explorer (DVE) tool to provide access to the full suite of projected future climatic design data produced in the CRBCPI report. The DVE presents these data in a map-based format (gridded), complementing the previously available station-specific data across Canada. Users can access historical design variables nationwide, evaluate projected future changes in design variables, and download maps and tables. The information provided for variables such as driving wind rain pressure, design snow loads, and wind pressures is unique and not currently available from other sources.

Box 1.2 Uncertainty Associated with Climatic Design Data

The climatic design data come with some uncertainty, which is fully described for each variable in the CRBCPI report. The CRBCPI report describes three levels of confidence for the climatic design variables:

  • Tier 1: variables for which there is generally high or very high confidence in the future projections for a given level of global warming. They include:
    • Heating degree days, January 2.5% dry bulb, January 1% dry bulb, July 2.5% dry bulb, and July 2.5% wet bulb, and maximum and minimum mean daily air temperatures.
  • Tier 2: variables for which there is generally a medium level of confidence in their future projections for a given level of global warming. These include:
    • Annual total precipitation and annual total rainfall, annual maximum 1-day rain (50-yr return period), annual maximum 15-min rainfall (10-yr return period)
  • Tier 3: variables for which there is low or very low confidence in the future projections for a given level of global warming. The low confidence in these variables is due to limited studies or poor understanding of the underlying processes. As a result, these variables are best used for exploring the potential impacts of climate change on structural reliability under various warming and load combination scenarios. Tier 3 variables include:
    • Relative humidity, annual maximum hourly wind pressures for 10, 25, 50, and 100-year return periods, annual maximum driving rain wind pressures for a 5-year return period, annual maximum snow load and rain-on-snow load for a 50-year return period, permafrost extent, and ice accretion thickness for a 20-year return period.

The confidence tier of each variable in the CRBCPI report is assigned according to several factors. These factors include the state of scientific knowledge, the ability to simulate the design variable in global climate models, and the capability to apply the design variable at regional scales. Additionally, the confidence tier accounts for the uncertainty in future projections, which arises from the use of different climate models and the natural internal variability or ‘noise’ in the climate system. For more information on levels of uncertainty in projected future design data, please refer to the CRBCPI report.

Environment and Climate Change Canada has synthesized some of the information from the DVE tool into easy-to-use, one-page PDF documents called Future Building Design Value Summaries. Each summary document includes location-specific historical and future projected values of design variables for mid-century and end-of-century, in the same format as Table C-2. It also includes guidance for using future-projected design values and links to sources of additional information. The Future Building Design Value Summaries enable design professionals to incorporate the effect of climate change on environmental loads, which may help minimize the risks of long-term climate stresses.

Projected Future Design Values and Global Warming Levels

The information on design values available from the DVE and the associated summaries is not tied to a specific time horizon and greenhouse gas emissions scenario but rather to different global warming levels (GWLs). A particular GWL is the average (mean) global temperature increase from a baseline value, which can serve as a contextual background for understanding regional climate change (see Introduction to Global Warming Levels for more information). To use these climatic design data effectively, it is essential to consider the relevant GWLs for the building or system’s design service life, enabling better planning for regional climate impacts.

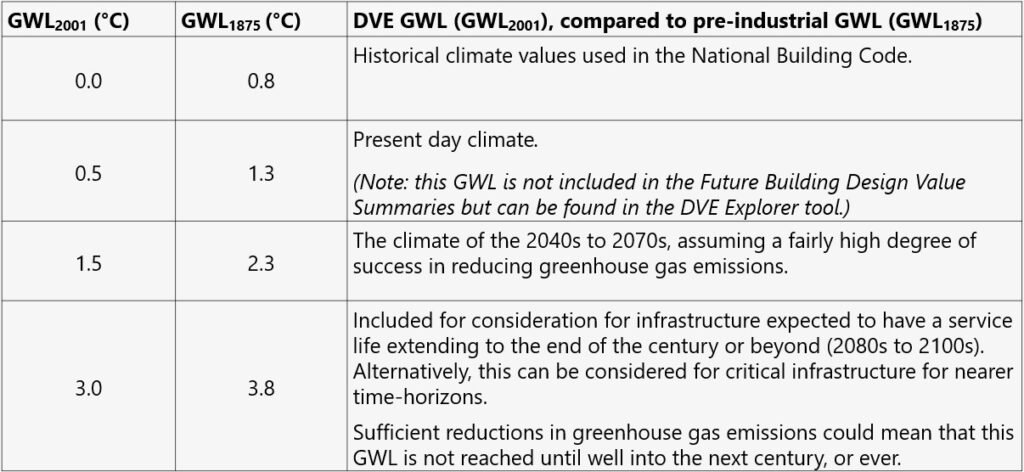
To ensure buildings are prepared for various potential greenhouse gas emissions trajectories, a range of GWLs must be considered. The one-page Future Building Design Value Summaries provide two plausible GWLs based on the considerations in Table 1. Specifically, the chosen GWLs of 1.5°C and 3.0°C relative to the 1986 to 2016 baseline were selected as the most representative of the conditions anticipated for buildings and their systems. Note that there is an approximately +0.8°C difference between pre-industrial global warming levels (GWL1875: 1850 to 1900) and the 1986 to 2016 baseline reference period (GWL2001) used within the NBC. The inclusion of these two baseline reference periods facilitates understanding of the GWLs for both contexts.

Table 1 – Summary Document’s GWLs with Descriptions (The reference to GWL2001 is for simplicity, denoting the midpoint of the 1986 to 2016 baseline; the GWL1875 reference period is 1850 to 1900).

It is important to note that future versions of the NBC and CHBD may use a different (range of) GWLs or time periods from those provided in the summaries.

The following examples are provided as ‘worked examples’ demonstrating how the future projected climate variables can be used to inform resilient building design.

Example 1: Applying the Future Building Design Value Summary for Snow Loads

Consider an example of a new residential building in North Vancouver. This contemporary building features a flat roof, typical of other buildings in the neighborhood. The designer expects this building to still be in use by the year 2100.

The design team first identifies the code values for the 1-in-50-year Snow and Rain-on-Snow loads from the BC Building Code for the required location. Next, the design team uses the Future Building Design Value Summaries on ClimateData.ca to find climatic design values for North Vancouver by looking up the row that most closely describes the time horizon of the useful design service life of the roof structure: a GWL2001:3.0°C or end-century value.

The values are shown in the following table:

Table 2 – Absolute values for Snow Loads for North Vancouver, BC, from the Future Building Design Value Summaries on ClimateData.ca.
Global Warming Level         Snow Load, kPa, 1/50
Ss Sr
Recent Historic 3.0 0.3
GWL2001:1.5°C (Mid-Century) 1.5 0.2
GWL2001:3.0°C (End-Century) 0.9 0.2


Using the snow load equation, the historic and future snow loads are calculated as:

S= CbSs + Sr

Where:

S = Specified snow load,

Cb = 0.55 for all other roofs

Ss = 1-in-50-year ground snow load in kPa

Sr = associated 1-in-50-year rain load in kPa


Historic Future
SCode=CbSs+Sr S2100=CbSs+Sr
SCode=0.55 * 3.0 + 0.3 S2100=0.55 * 0.9 + 0.2
SCode=1.95 kPa S2100=0.7 kPa


Given that the building must withstand the greatest snow-loads over its entire service life, with the possibility of heavy snowfall still occurring in the early lifetime of the roof, the most stringent snow load of SCode=1.95kPa should be used for the design load of the roof.

The Minimax approach (see Box 1.1) is an approach used when conditions are changing with time. However, it is important to recognize its limitations. In some cases, snow loads might initially increase before decreasing, so both mid- and end-century climate loads should be considered and the most stringent applied to the design case. Additionally, regional climate models (RCMs), from which these future design values have been calculated, may not capture small-scale climate variability, such as heavy snowfall events on the West Coast of BC. Therefore, while mid-century values can be informative, it is important to also account for the inherent uncertainties in these projections (See Box 1.2). Enhancing building resilience in the face of a changing climate may require extra measures to manage extreme events and hazards not currently covered by existing practices.

Example 2: Applying the Future Building Design Value Summary for Cooling Systems

Overheating in buildings is a significant concern for human health, especially for vulnerable populations. With hotter summer days, warmer nighttime lows, and lengthening heat waves projected, future cooling loads require careful evaluation. This includes considering whether some form of mechanical cooling will be needed in locations where this was not needed in the past.

Consider the example of a mechanical engineer responsible for designing the Heating, Ventilation and Air Conditioning (HVAC) system for a low-rise multi-unit residential building in Toronto, ON. Knowing that overheating is becoming a greater concern, the design team first considered reducing passive loads as much as possible before relying on the mechanical system. This would support the use of a smaller cooling system while also increasing occupant comfort, especially in the case of power outages.

Passive load reductions included measures such as using optimal building orientation and form, low solar-heat-gain windows, reduced window-to-wall ratio, shading devices, and specifying a light-colored roofing membrane. To better retain the cooled air within the building’s interior, the team looked to a high-performance enclosure with an effective wall thermal resistance greater than R-22. They are also committed to ensuring improved building air tightness levels.

With the passive gains significantly reduced, the mechanical engineer could specify an appropriately sized heat pump to manage the remaining cooling load.

Referring to the Future Building Design Value Summary on ClimateData.ca for Toronto (City Hall) ON, the engineer locates the historical 2.5% July Dry Bulb and Wet Bulb temperatures as well as the future design values for 2050 and 2100.


Table 3 – Absolute values for Dry and Wet Bulb Temperatures for Toronto (City Hall), ON, from Future Building Design Value Summaries on ClimateData.ca.
Global Warming Level 2.5% July Dry Bulb (°C) 2.5% July Wet Bulb (°C)
Recent Historic                   31                    23
GWL2001:1.5°C / Mid-Century                   33                    25
GWL2001:3.0°C / End-Century                   35                    26


Knowing that cooling plants typically last for 15 to 25 years, the engineer uses the mid-century dry bulb temperature (33°C) to ensure the system can perform adequately until the end of its service life. Using this data, the engineer can use 2050 dry bulb temperature to find the peak cooling load. The rest of the HVAC system is then designed in accordance with the required peak cooling loads.

However, the engineer’s work is not quite done, as not all the elements in the cooling system have the same 15- to 25-year lifespan. The distribution systems will have a lifespan that exceeds the heat pump: they should be sized to deliver the required amount of chilled air or refrigerant to satisfy the cooling loads for the end of century dry-bulb temperatures. The mechanical rooms should be sized for the potential need for additional cooling equipment, similarly for the placement of additional roof-top curbs if supplemental roof mounted equipment is required. The lesson here is that the cooling load calculations should also be run with the end-of-century value, to ensure that the replacement and/or upgrade systems have already been considered, minimizing future retrofit costs and installation time.

References

1. Cannon, A.J., Jeong, D.I., Zhang, X., and Zwiers, F.W., (2020): Climate-Resilient Buildings and Core Public Infrastructure: An Assessment of the Impact of Climate Change on Climatic Design Data in Canada; Government of Canada, Ottawa, ON. 106 p. https://publications.gc.ca/pub?id=9.893021&sl=0