What are Seasonal Forecasts?

Learn about seasonal forecasts coming soon to ClimateData.ca and where you can find more information about these forecasts.

Time to completion
15 min

Key Messages

  • Seasonal forecasts predict how climate conditions for an upcoming season are likely to compare to past conditions, they do not predict the weather for a particular day or week within that season. ClimateData.ca will offer forecasts that cover rolling 3-month periods over the next 12 months.
  • Seasonal forecasts coming to ClimateData.ca describe the probability of a variable (e.g., mean temperature, total precipitation) being above, near, or below normal, as defined by historical climate.
  • When making decisions using seasonal forecasts, it is important to consider both the probable conditions and the performance of the seasonal prediction system for the season, variable, and location of interest.

What are seasonal forecasts?

Seasonal forecasts predict how overall climate conditions for an upcoming season are likely to compare to past conditions. The forecasts that are coming to ClimateData.ca will cover rolling 3-month periods over the next 12 months. Seasonal forecasts are commonly presented as the probability that a variable (such as mean temperature or total precipitation) will be above, near, or below normal, as compared to the historical climate. For example, a seasonal forecast indicates whether a season will be warmer or colder than normal, and if it will be wetter or drier than normal. Normal climate conditions are defined using observations from a 30-year historical reference period (called the observed historical climatology).

Seasonal forecasts are produced using a seasonal prediction system that simulates both natural and human influences on the climate. These influences are discussed in more detail in the section below called ‘Where does predictability come from at the seasonal timescale?’.

Seasonal forecasts do not predict daily or weekly weather within a season2. For instance, locations that are forecast to have a high probability of above-normal temperatures for the season will likely experience several days with near-normal and below-normal temperatures within that season. Even in cases where the forecast includes a high probability of a particular outcome, day to day variations in weather are still expected.

Jump back to top

What are the uses and benefits of seasonal forecasts?

A key benefit of seasonal forecasts is that they provide information up to a year in advance. For planning and decision-making that can benefit from advance knowledge about the most probable seasonal conditions, these forecasts provide information that can be used to weigh the benefits and risks of different actions3. To obtain the most benefit, consider forecasts in planning and decision-making repeatedly over multiple seasons. Ideally, the probabilities for all outcomes (e.g., the probabilities of above-normal, near-normal, and below-normal seasonal conditions) should also be considered, but even decisions based on the most probable outcome from each forecast will be beneficial compared to decisions based solely on what has occurred in the past.

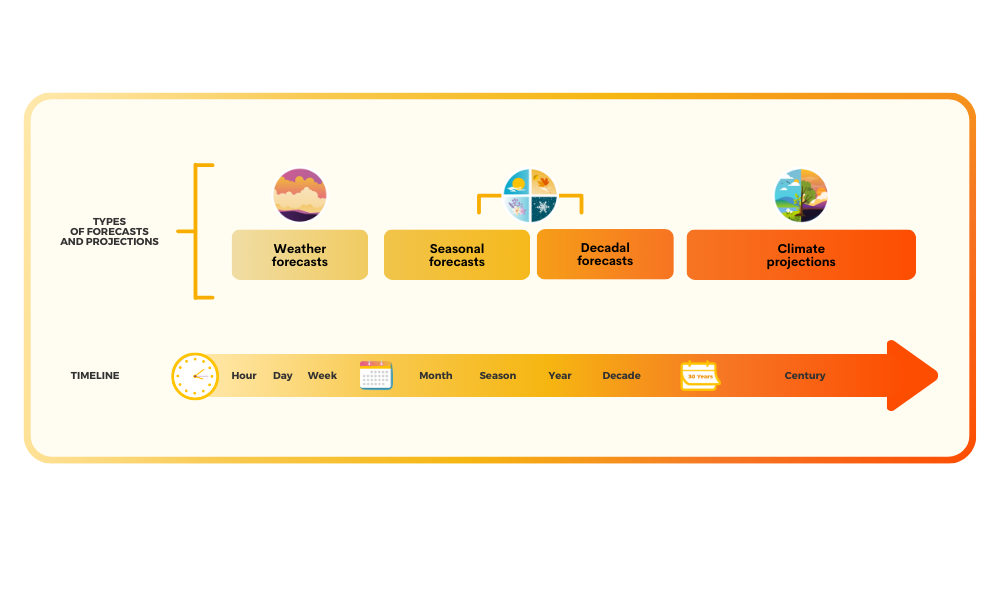
Seasonal forecasts help bridge the gap between weekly weather forecasts and longer-term climate projections that extend to the end of this century. Figure 1 shows the different timescales for weather forecasts, seasonal forecasts, and climate projections. Seasonal forecasts are useful for shorter-term planning over the upcoming year, while climate projections are useful for longer-term planning over several decades or more (until 2100). For more information about the differences between seasonal forecasts and climate projections, please refer to the Seasonal Forecasts vs. Climate Projections article.


Figure 1: Weather forecasts generally cover hours to weeks. Seasonal forecasts generally cover 3-month periods over the next 12 months. Climate projections generally cover 30-year periods until the end of the century.

Jump back to top

Why are seasonal forecasts shown as probabilities?

It is not possible to predict climate conditions for specific future periods that are weeks or months away with the same accuracy as weather forecasts. Instead, the seasonal prediction system uses a collection of model simulations called an ensemble. The ensemble for the forecasts coming to ClimateData.ca initially creates 40 predictions of possible future seasonal conditions. Instead of averaging all 40 predictions together, the full ensemble is used to calculate the probabilities of each climatic outcome at each location for each upcoming season over the next 12 months. This type of forecast is called a probabilistic forecast.

For example, say a forecast shows a 70% probability of above-normal temperatures, a 20% probability of near-normal temperatures, and a 10% probability of below-normal temperatures. This forecast can be interpreted as a 70 in 100 chance of experiencing above-normal temperatures, a 20 in 100 chance of experiencing near-normal temperatures, and a 10 in 100 chance of experiencing below-normal temperatures. The actual seasonal conditions that occur (i.e., that are ultimately observed and experienced) will not always match the forecast outcome with the highest probability3. The forecast system would not be considered “wrong” in this example if a near-normal or below-normal outcome occurred, because while these outcomes are less probable, they are not impossible and are expected to occur some of the time (see Figure 2).


Figure 2: Probabilistic seasonal forecasts can be understood by considering a wheel spinner analogy. Each section of the wheel represents one possible outcome. The wheel spinner example here represents a seasonal forecast that predicts a 70% probability of an above-normal outcome, a 20% probability of a near-normal outcome, and a 10% probability of a below-normal outcome. Results from spinning the wheel many times are shown on the right (in the light blue section), these represent the actual ‘observed’ outcomes. Note the pointer (small grey triangle) on the wheel spinner lands on different probabilities over the course of many spins.

Jump back to top

What will seasonal forecasts look like on ClimateData.ca?

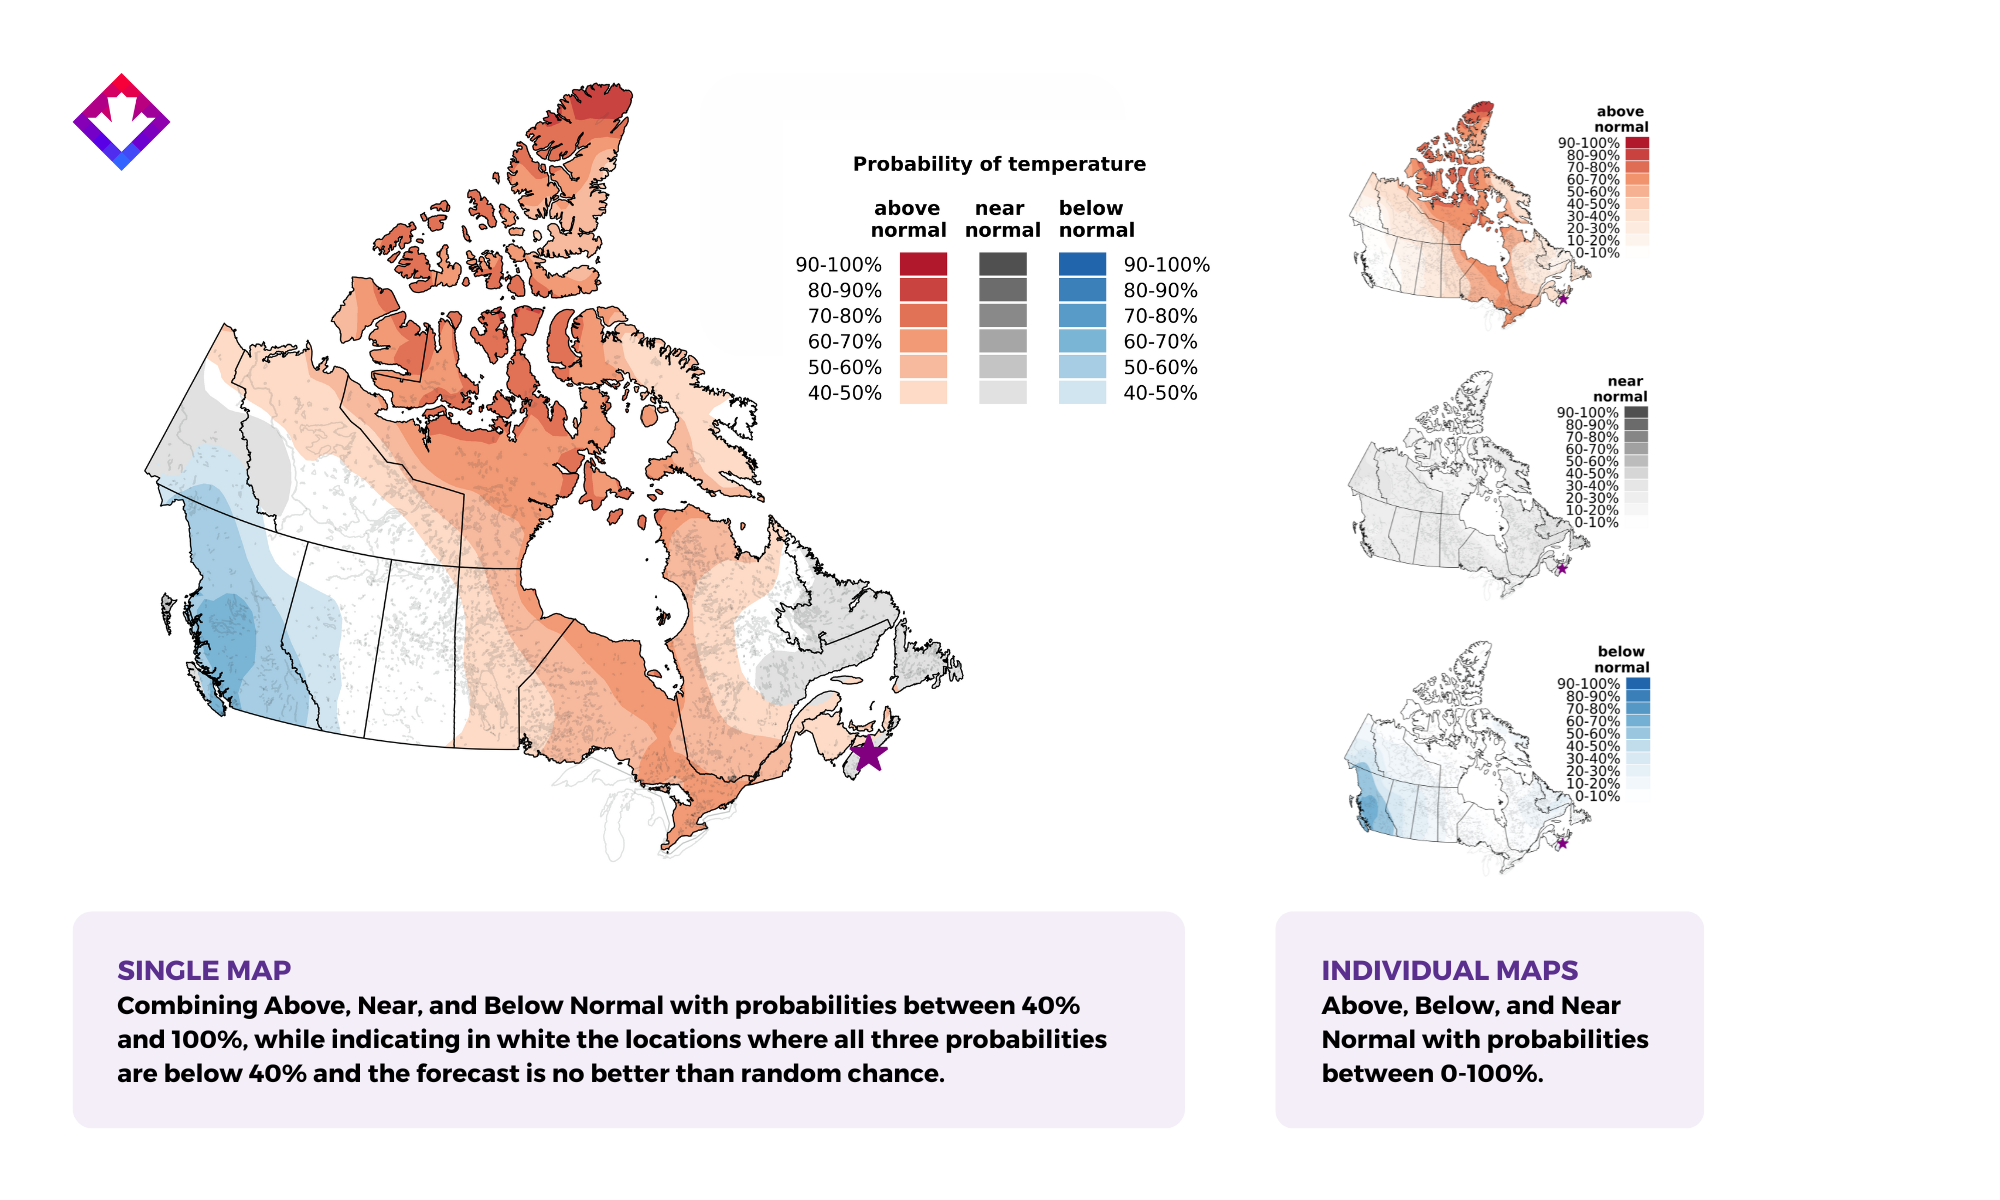
The seasonal forecasts coming to ClimateData.ca will be presented as a single map showing the most probable outcome (e.g., above, near, or below normal conditions) for each location. Probabilities for all outcomes will be provided with the forecast. Past observations of the climate between 1991 and 2020 (called the observed historical climatology) are used to define what are considered normal conditions for each location.

Figure 3 shows an example of how probabilistic forecast maps are developed. This forecast was released on February 1st, 2025, and shows that between February and April 2025, the area around Halifax was forecast to have a 30% probability of above-normal temperatures, a 41% probability of near-normal temperatures, and a 29% probability of below-normal temperatures.

Seasonal forecasts commonly present probabilities for above, near, and below normal outcomes. However, other probabilistic seasonal forecast products exist. For example, some seasonal forecasts coming to ClimateData.ca will show the probability of unusually high or unusually low conditions (e.g., the probability of unusually high temperatures).


Figure 3: Example of how a probabilistic forecast map of mean temperature is generated (for a forecast released on February 1st, 2025, for the February to April 2025 period). There are three small individual maps on the right that show how probable each outcome is: one map for the probability of above-normal temperatures, one map for the probability of near-normal temperatures, and one map for the probability of below-normal temperatures. Each map shows the probability between 0% and 100% for that specific outcome occurring across Canada. The large map on the left shows the most probable of these three outcomes across Canada. The map is white at locations where every possible outcome has less than a 40% probability of occurring, i.e., no outcome has a better than equal chance of occurring. The larger combined map on the left will be available on ClimateData.ca, while the probabilities of each outcome shown in the small maps on the right will be provided with the forecast.

Jump back to top

Is there uncertainty with seasonal forecasts?

Seasonal forecasts are inherently uncertain, however in the science of prediction, the word uncertain does not mean speculative. Rather, it means that we have partial but incomplete knowledge of the likely future conditions. While no forecast is free from uncertainty, it is possible to describe and understand the sources of uncertainty, and in some cases even measure the uncertainty. Most of the uncertainty in the seasonal forecast comes from constraints on the predictability of climate on seasonal timescales and limitations of the prediction system3, with some uncertainty arising from inaccuracies in initial conditions. Performance metrics provide additional important context to help decision-makers understand how the seasonal prediction system performs over the historical reference period of 1991 to 2020.

Jump back to top

What time periods will be available for seasonal forecasts and how often will they be updated?

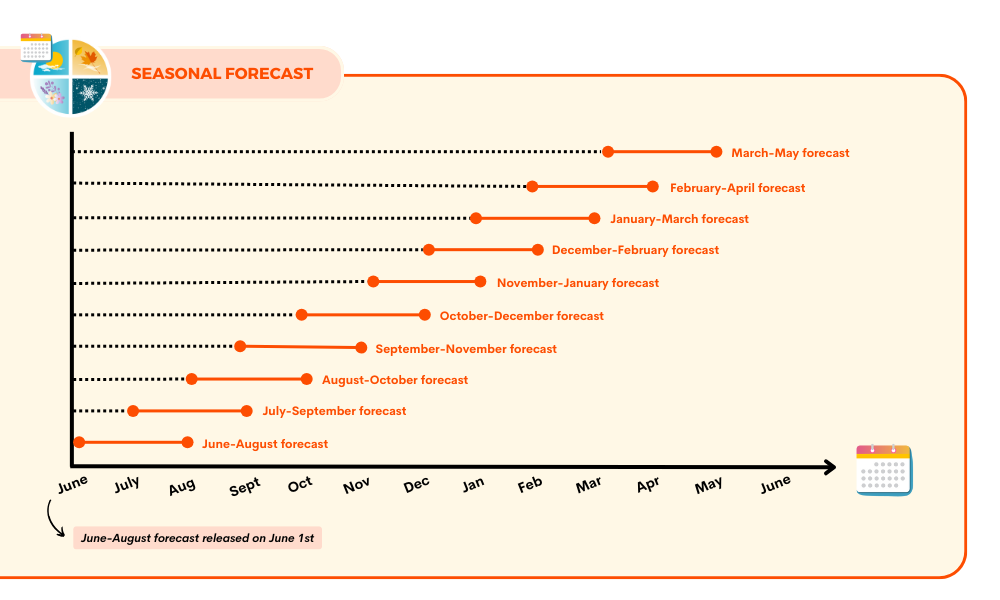
ClimateData.ca will offer forecasts that cover rolling 3-month periods over the next 12 months. For example, on June 1st, 2026, seasonal forecasts will be released for June to August 2026, July to September 2026, August to October 2026, and so on with the last available forecast being the March to May 2027 forecast. Figure 4 shows examples of seasonal forecast time periods.

Forecasts will be updated monthly and released on the 1st day of the current month, called the release date. Only the most recent forecasts will be available on ClimateData.ca.

It is important to consider the length of time between the release date and when the forecast season starts. In general, it is recommended that forecasts be re-checked monthly, as the performance of the seasonal prediction system generally improves as the season of interest gets closer. In other words, a forecast for the coming season is typically more accurate than a forecast for a season later in the year.


Figure 4: Example showing forecasts released on June 1st. Seasonal forecasts overlap, with 10 forecasts covering rolling 3-month periods out to 12 months.

Jump back to top

Where does predictability come from at the seasonal timescale?

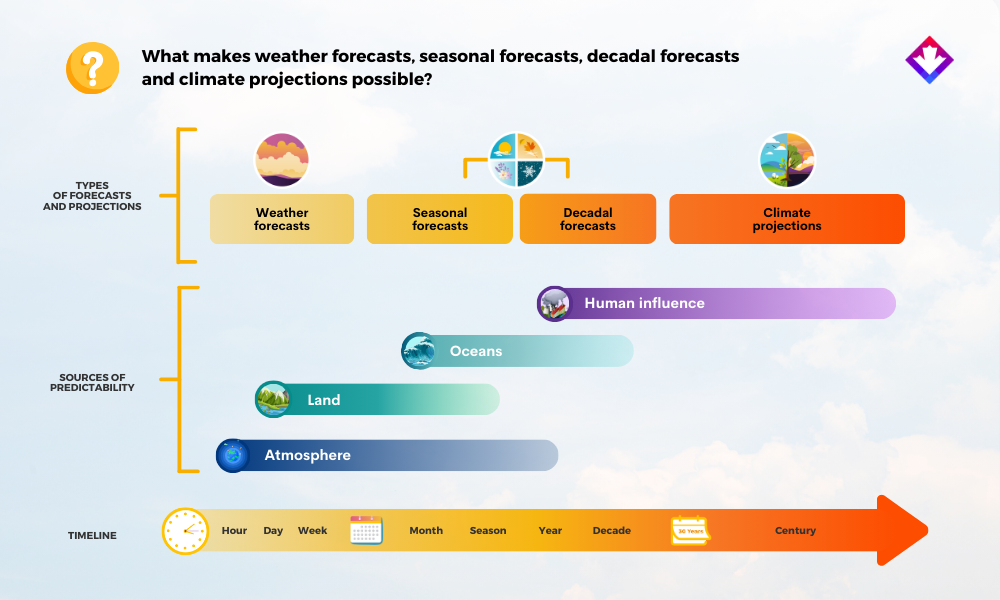
The atmosphere, land, oceans, and human activities all influence the climate on timescales from days to centuries. These influences are included in weather and climate models and provide the predictability needed to produce weather forecasts, seasonal forecasts, and climate projections, as shown in Figure 5. Different sources of predictability influence the weather and climate more strongly on different timescales (e.g., days, seasons, decades).

Seasonal forecasts are largely influenced by changes in the ocean and the natural climate variability linked to those changes, such as the El Niño-Southern Oscillation (ENSO), which includes El Niño and La Niña. The seasonal prediction system starts from present-day conditions and runs forward in time to predict how these climate influences will evolve over the coming months.


Figure 5: The atmosphere, land, oceans, and human influence affect the climate on timescales from days to centuries, however their influences are felt more strongly at different timescales. Weather and climate models use these sources of predictability to produce weather forecasts, seasonal forecasts, decadal forecasts, and climate projections. Figure adapted from Merryfield et al4.

Jump back to top

How are the seasonal forecasts coming to ClimateData.ca developed?

The seasonal forecasts coming to ClimateData.ca are generated using the Canadian Seasonal to Interannual Prediction System version 3, known as CanSIPSv3.

CanSIPSv3 is a seasonal prediction system that forecasts changes in climate conditions during the upcoming 12 months. CanSIPSv3 uses two coupled atmosphere-ocean-land climate models: CanESM5 and GEM5.2-NEMO. CanSIPSv3 forecasts are generated using an ensemble of 40 model simulations that includes 20 model simulations from each of the two models1. The seasonal forecasts are produced by CanSIPSv3 at a spatial resolution of 1×1 degree (approximately 100 km x 100 km). Technical documentation containing more details about CanSIPSv3 is available here.

Jump back to top

Where can I find more seasonal forecast information?

In addition to the seasonal forecasts coming to ClimateData.ca, seasonal forecast information for Canada is available from:

Advanced options for accessing CanSIPS forecast data through MSC (Meteorological Service of Canada) are also available:

Jump back to top

References

  1. Diro, G.T., Merryfield, W.J., Lin, H., Lee, W.-S., Muncaster, R., Kharin, V.V., Parent, R., Swart, N., Seinen, C., Akingunola, D., Leung, V., Mansour, M., Chouak, M., Deng, X., Smith, G., Lemay, F., 2024. The Canadian Seasonal to Interannual Prediction System version 3.0 (CanSIPSv3.0). [pdf] Environment and Climate Change Canada. Available at: https://collaboration.cmc.ec.gc.ca/cmc/cmoi/product_guide/docs/tech_notes/technote_cansips_e.pdf [Accessed 1 November 2024].
  2. Kirtman, B., Power, S.B., Adedoyin, J.A., Boer, G.J., Bojariu, R., Camilloni, I., Doblas-Reyes, F.J., Fiore, A.M., Kimoto, M., Meehl, G.A., Prather, M., Sarr, A., Schär, C., Sutton, R., van Oldenborgh, G.J., Vecchi, G., Wang, H.J. 2013. Near-term Climate Change: Projections and Predictability. In: Stocker, T.F., Qin, D., Plattner, G.-K., Tignor, M., Allen, S.K., Boschung, J., Nauels, A., Xia, Y., Bex, V., Midgley, P.M., eds. 2013. Climate Change 2013: The Physical Science Basis. Contribution of Working Group I to the Fifth Assessment Report of the Intergovernmental Panel on Climate Change. Cambridge, United Kingdom and New York, NY, USA: Cambridge University Press. Ch.11.
  3. World Meteorological Organization. 2020. Guidance on Operational Practices for Objective Seasonal Forecasting. [e-book] Geneva: World Meteorological Organization. Available at World Meteorological Organization e-Library https://library.wmo.int/records/item/57090-guidance-on-operational-practices-for-objective-seasonal-forecasting [Accessed 3 June 2024].
  4. Merryfield, W.J., Baehr, J., Batté, L., Becker, E.J., Butler, A.H., Coelho, C.A.S., Danabasoglu, G., Dirmeyer, P.A., Doblas-Reyes, F.J., Domeisen, D.I.V., Ferranti, L., Ilynia, T., Kumar, A., Müller, W.A., Rixen, M., Robertson, A.W., Smith, D.M., Takaya, Y., Tuma, M., Vitart, F., White, C.J., Alvarez, M.S., Ardilouze, C., Attard, H., Baggett, C., Balmaseda, M.A., Beraki, A.F., Bhattacharjee, P.S., Bilbao, R., de Andrade, F.M., DeFlorio, M.J., Díaz, L.B., Ehsan, M.A., Fragkoulidis, G., Gonzalez, A.O., Grainger, S., Green, B.W., Hell, M.C., Infanti, J.M., Isensee, K., Kataoka, T., Kirtman, B.P., Klingaman, N.P., Lee, J.Y., Mayer, K., McKay, R., Mecking, J.V., Miller, D.E., Neddermann, N., Ng, C.H.J., Ossó, A., Pankatz, K., Peatman, S., Pegion, K., Perlwitz, J., Recalde-Coronel, G.C., Reintges, A., Renkl, C., Solaraju-Murali, B., Spring, A., Stan, C., Sun, Y.Q., Tozer, C.R., Vigaud, N., Woolnough, S., Yeager, S. 2020. Current and Emerging Developments in Subseasonal to Decadal Prediction. Bulletin of the American Meteorological Society, 101(6) pp. E869-E896. https://doi.org/10.1175/BAMS-D-19-0037.1.