Stakeholder Engagement Methods

Through a bilingual survey, transportation stakeholders were consulted on the most useful climate information, indices, impacts, and learning resources for their transport-climate decisions. Here you can learn more about stakeholder feedback regarding what climate information is most needed to inform climate-smart decisions in the transportation sector.

Overview

During the continuing development of ClimateData.ca, the Pacific Climate Impacts Consortium (PCIC), Canadian Centre for Climate Services (CCCS), Prairie Climate Centre, and Ouranos coordinated efforts to consult users of the transportation sector. One of the fundamental aims of the ClimateData.ca portal is to provide climate data and related information that meets the needs of adaptation professionals and decision-makers. Following the success of the outreach and engagement model developed by Ouranos for the health module, aspects of this approach were replicated for the transportation sector, recognizing that data, outreach, and training requirements vary both by sector and within each sector. Here we describe the outreach and engagement strategy that was implemented to connect with professionals and practitioners in the transportation sector. This approach resulted in the development of specific climate indices and case studies, and is currently informing the development of sector-specific training on the use of climate data for decision-making.

Stakeholder Engagement Strategy for the Transportation Sector Module

During the development of the transportation module for ClimateData.ca, climate data users in the transportation sector were consulted. This included the preparation of a bilingual survey to identify the most important transportation impacts, the most relevant climate indices, and preferences for how climate information should be presented to be of most use to stakeholders in this sector.

Both French and English versions of the survey were provided to sector experts across Canada, with responses collected between December 10th, 2020 and January 4th, 2021. The ClimateData.ca team received 172 answers from across Canada: 35 from French speakers and 137 from English speakers. Overall, about 11-12% of the answers came from each of the provinces of Ontario, Québec, and British Columbia, while 5-8% of the answers came from each of the other provinces or territories.

Responses from the transportation module survey indicate that the survey reached a receptive user community with an appetite for the climate data that is available on ClimateData.ca. Respondents from across Canada occupied a wide range of professional roles in the transportation sector. Many survey respondents (65%) were involved in road transportation, which was the chosen priority area for the initial round of case studies, and therefore a good fit with the audience. There are indicators that the survey reached experienced and appropriate transportation sector professionals who were able to provide insightful feedback.

Key Findings

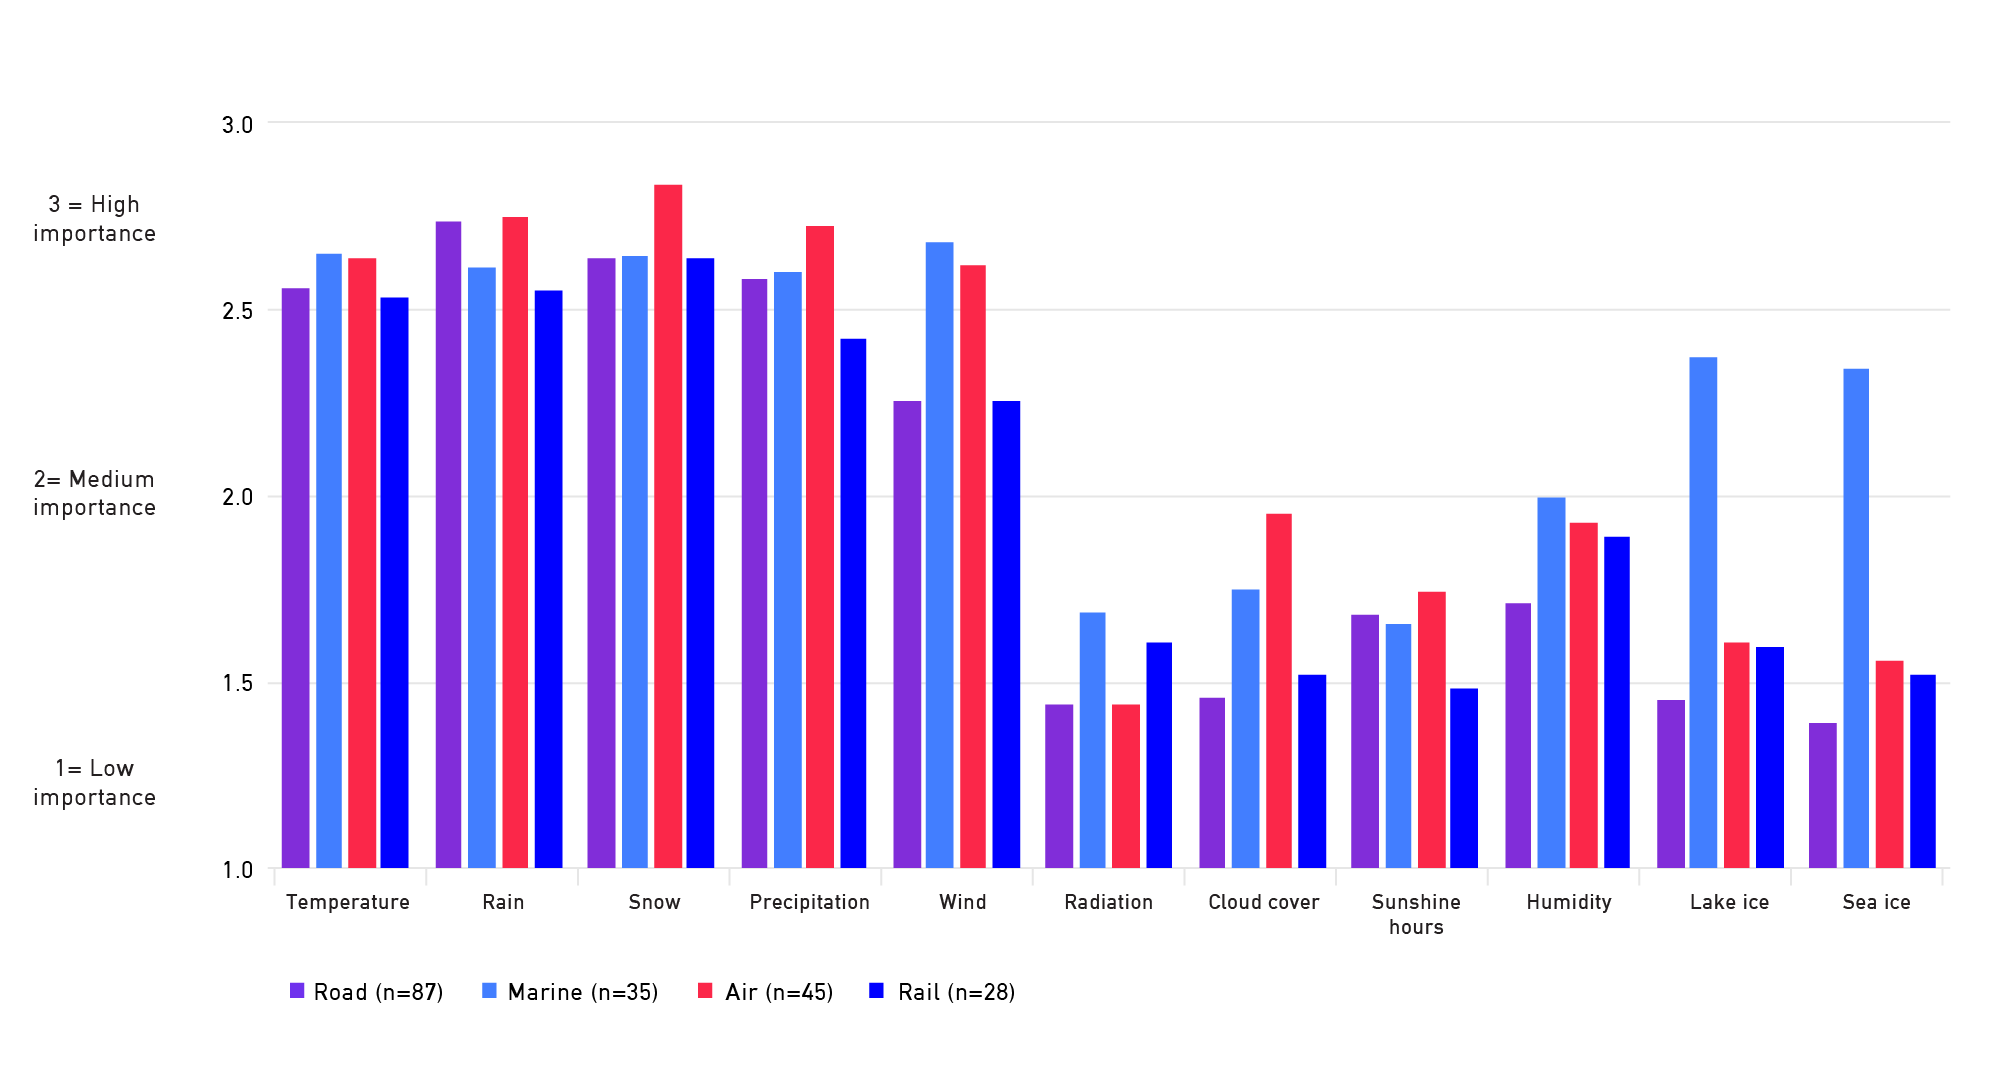
  • ClimateData.ca provides temperature and precipitation related variables, which transportation professionals indicated are of top importance to them (Figure 1). Other variables of high importance to transportation professionals were rain, snow, and wind. Mode-specific climate data of interest included sea ice and lake ice for marine shipping and cloud cover for air transport. Climate models are currently limited in their ability to partition precipitation data and to provide robust projections for non-precipitation or temperature related variables, but these may be available in the future.

Figure 1. Climate variables of importance to transportation professionals

Survey respondents from the four transport modes (road, marine, air, and rail) ranked the importance of the above climate variables for inclusion on ClimateData.ca. The top four ranked variables of temperature, rain, snow, and precipitation are consistent across all modes of transport.
  • Climate data indices of high interest to the transportation sector included: freeze/thaw indices, freezing degree days, winter severity indices, heating degree days, and Superpave performance grades (for roads). Heating degree days can be viewed on ClimateData.ca through the Variable page, or can be calculated using different threshold temperatures on the Analyze page. The ability to perform custom data downloads of freeze-thaw cycles and freezing degree days was also added to the Analyze page, based on this feedback.
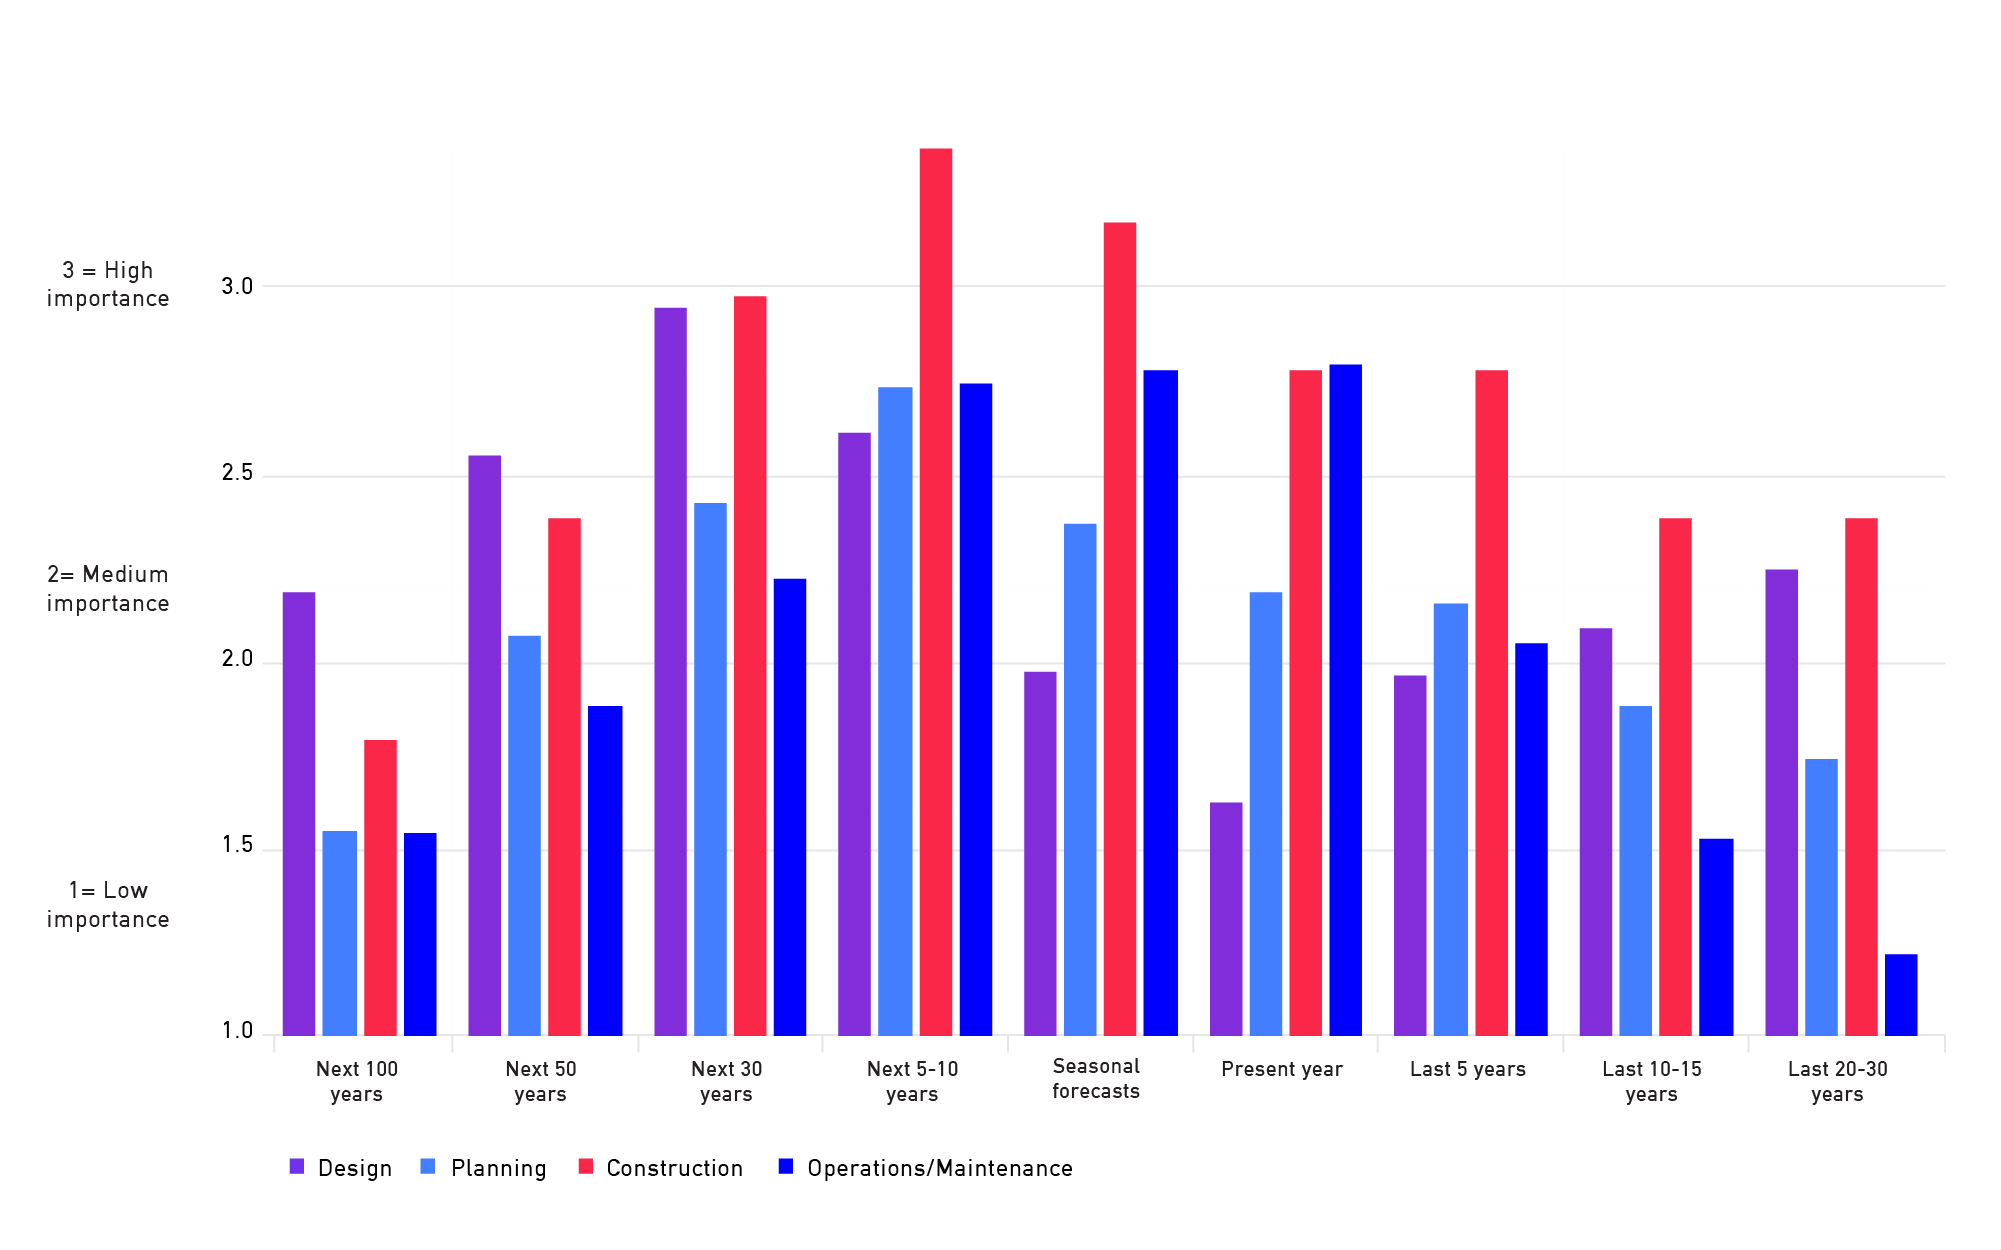
  • As shown in Figure 2, respondents involved in all phases of transportation (i.e. planning, design, construction, and operations/maintenance) were most interested in 5 to 10 year climate projections, but there was also demand for transportation-related climate data at 30-year timescales (particularly from respondents involved in infrastructure design and construction phases).

Figure 2. Importance of climate data timescales

Survey respondents ranked the importance of different timescales of past, present, and future climate data, for the different phases of transportation infrastructure (i.e. design, planning, construction, and operations/maintenance). Those involved in design and planning phases tended to rank future climate data of various timescales as most important, while construction and operations/maintenance phases tended to rank present and past data more highly.
  • A significant percentage of transportation professionals also indicated that gridded climate data at the spatial scale of a region (63% of respondents) or a small area (53% of respondents), such as a municipality, was most useful. This is consistent with the current presentation of data on ClimateData.ca.
  • While some transportation industry respondents indicated that they currently had enough information to use climate data for decision-making, over 50% of respondents would find it useful to have both better access to climate data and more guidance on how to use that data.
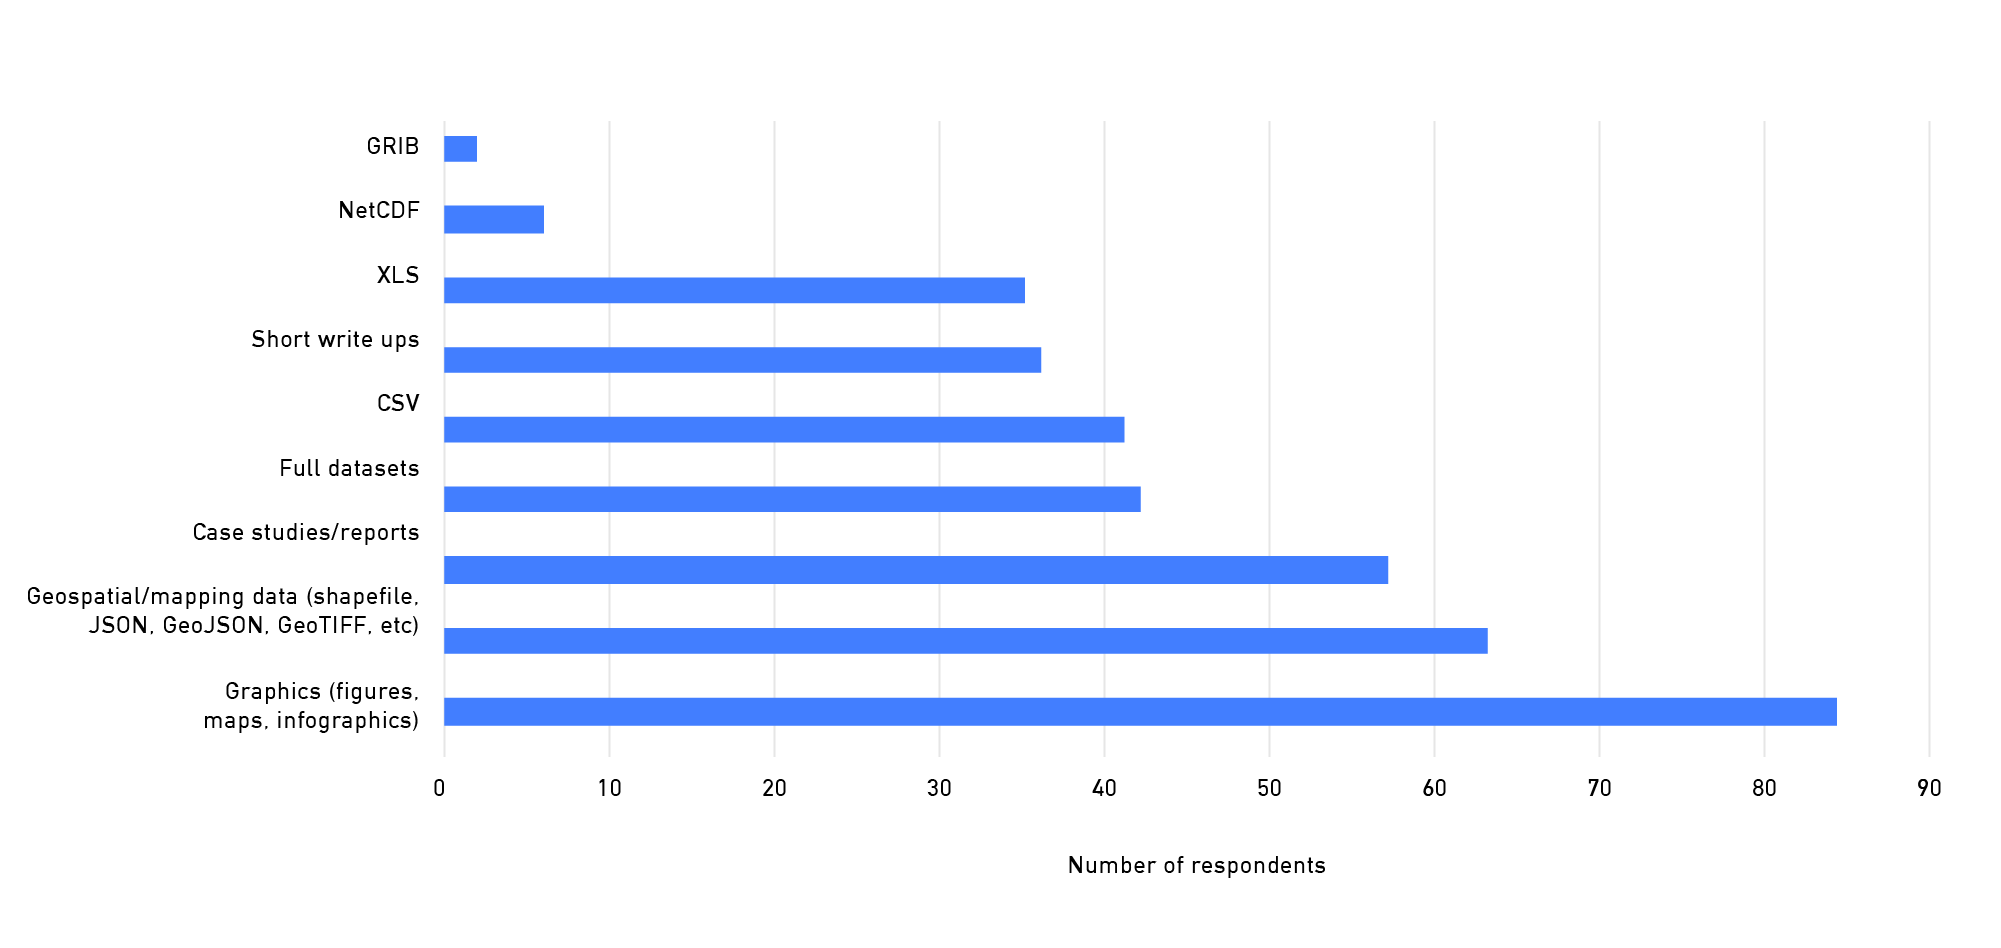
  • Across the range of comfort levels with climate data, users wanted access to pre-processed climate variable datasets and to visual representation options for this data, such as mapping (54% of users) or graphics (72% of users). Climate data users in the transportation sector who had the highest comfort with climate data wanted interactive mapping options and risk assessment guidance. There is a clear demand for a range of approaches to meet user needs (Figure 3).

Figure 3. Useful formats of climate information for transportation professionals

Survey respondents selected up to four formats of climate information that would be most useful to them. The top three rated formats are graphics, files for mapping, and case studies.
  • Resources that transportation users indicated would support their use of climate data included podcasts, webinars, infographics, and narrative devices like case studies. Respondents thought process-based resources, such as training and outreach from experts, would help them better use climate data to make future decisions. ClimateData.ca is continually expanding the training materials offered in the Learning Zone.

Next Steps

The surveys also determined user interest for participating in follow-up activities to evaluate content for the transportation module. Further development of ClimateData.ca and the sector modules will take into account the feedback received through these stakeholder engagement processes, along with comments, questions, and requests received through the Feedback section of the website.