Reanalysis data
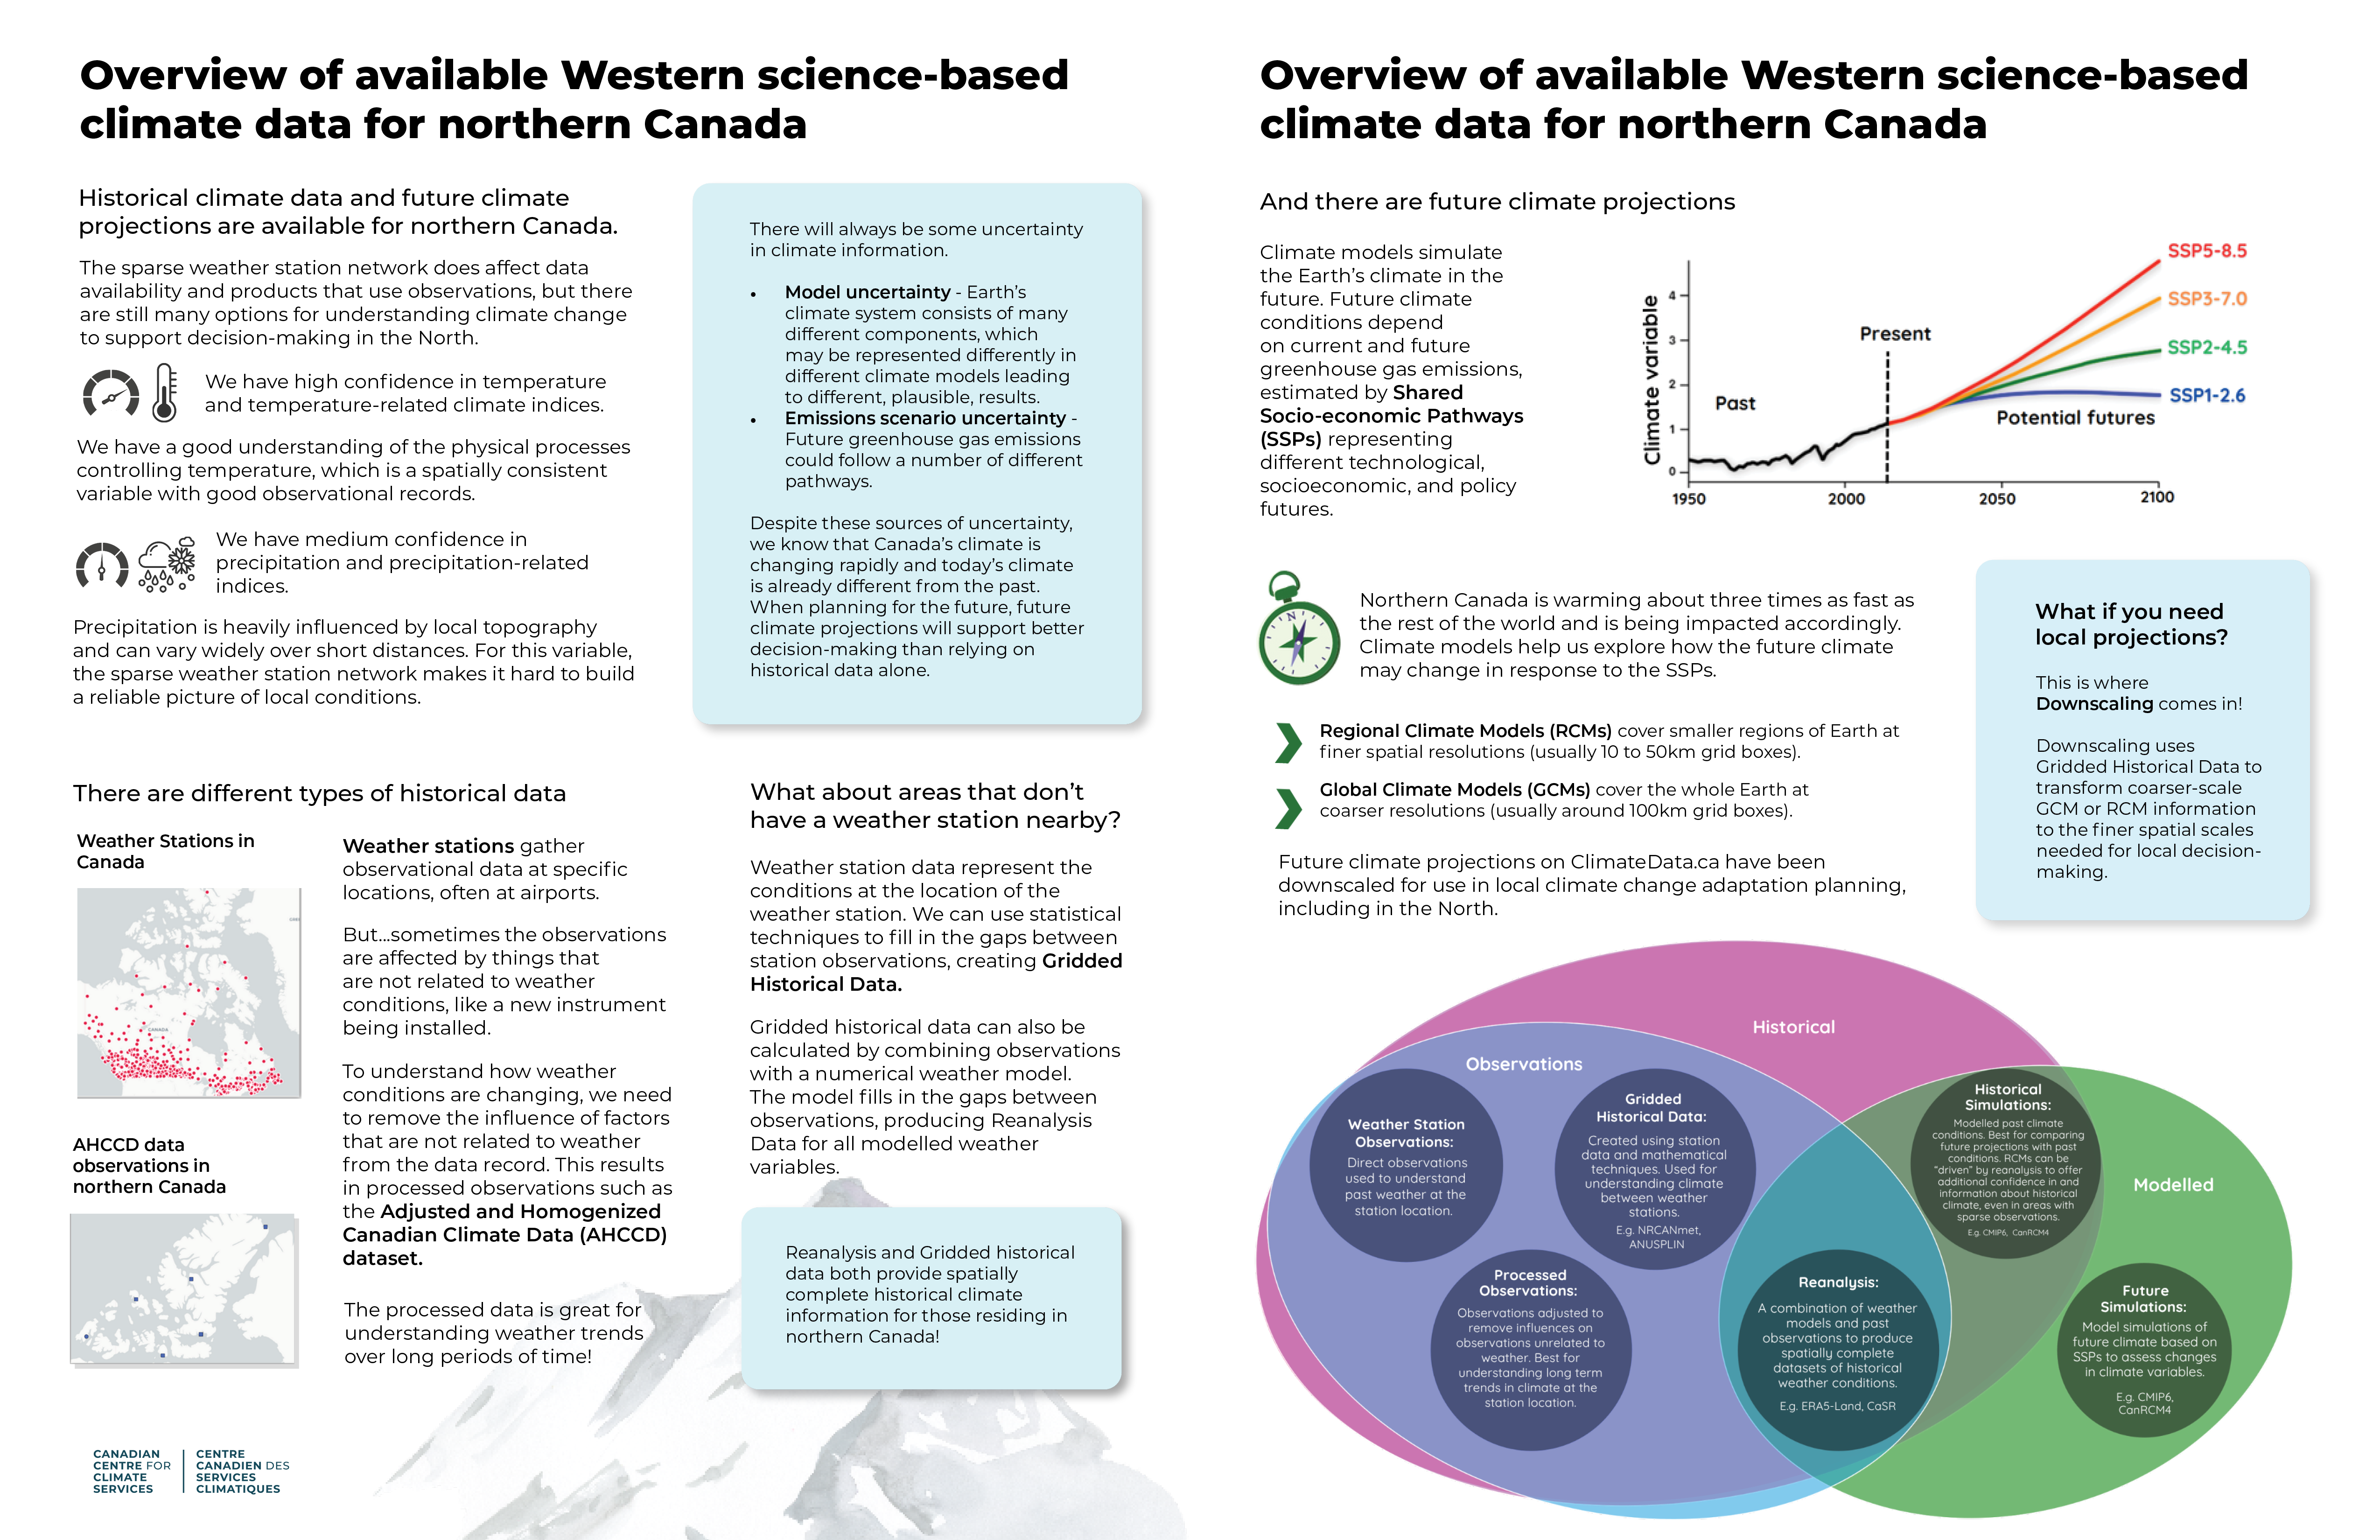
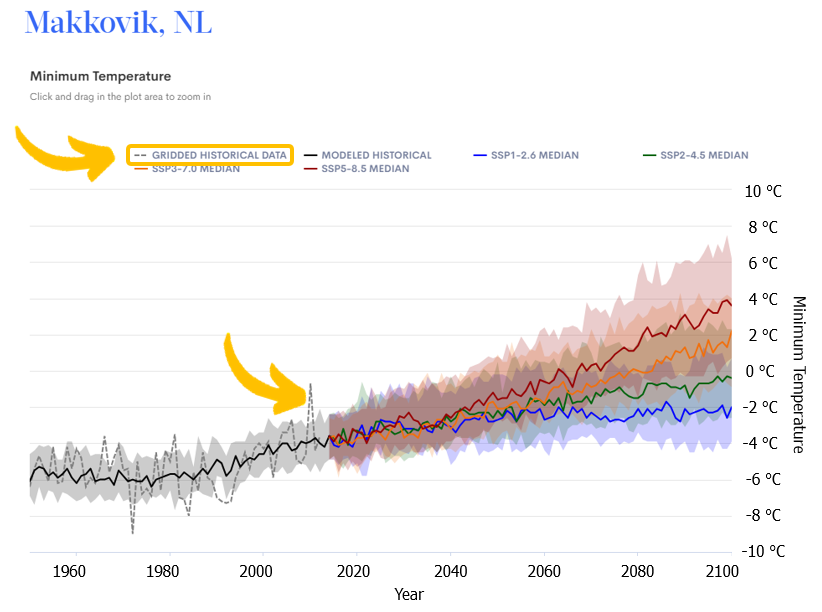
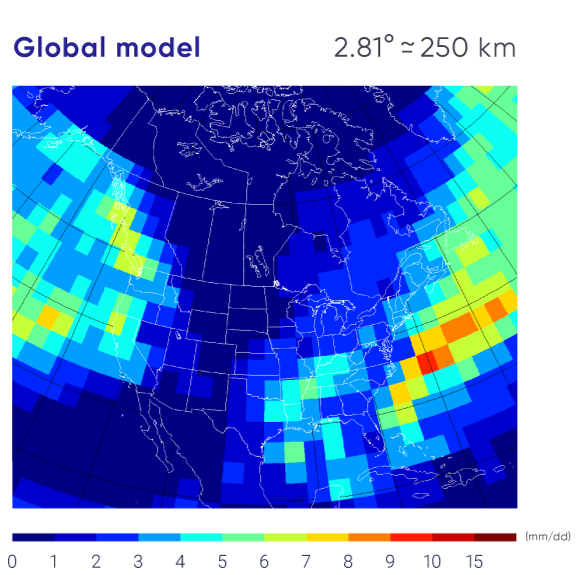
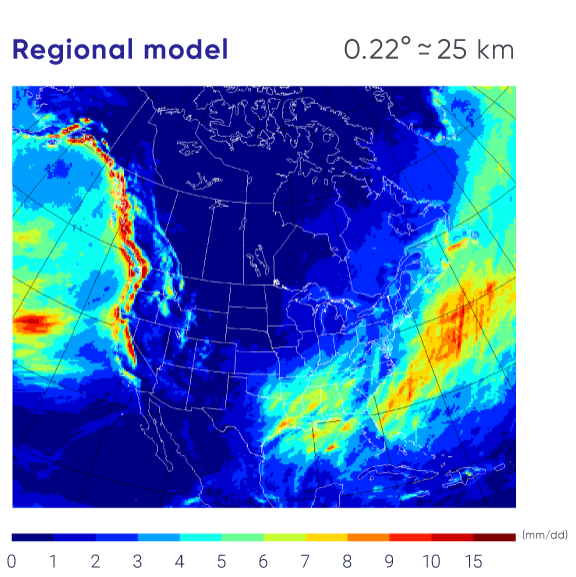
Other gridded historical datasets have been developed using a variety of methods to best estimate climate conditions where observations are sparse. For example, reanalysis datasets combine observed data (from weather stations, radar, satellites, etc.) with numerical weather models. Unlike the gridded historical data (NRCANmet), reanalysis datasets are not a result of interpolation. Reanalysis data incorporates observations into weather models to estimate weather conditions without any gaps in space or time. This means that they are guided by observations where available, but data gaps have been filled in using physical equations that describe atmospheric processes. This makes reanalysis datasets particularly useful in areas where observational data is more sparse. Reanalysis datasets are available at relatively fine spatial resolutions (usually in the range of 10 by 10 km, or 25 by 25 km).
Because reanalysis datasets have been developed using a combination of observations and weather models, they contain more climate variables, like wind and solar radiation, that are not typically available for interpolated datasets. Reanalyses are particularly helpful when more than one climate variable is needed, or when climate variables that are not widely available in observed datasets, such as snow, wind, or humidity, are required. Two reanalysis datasets, developed specifically for Canada, are the Regional Deterministic Reforecast System (RDRS) and the Canadian Surface Reanalysis (CaSR), which are available at 10 km by 10 km spatial resolution over all of Canada. Another popular reanalysis is called ERA5-Land. This dataset was used in the development of the Humidex projections available on ClimateData.ca. Copernicus’ Interactive Climate Atlas5 is also a great tool for visualizing the ERA5-Land data.
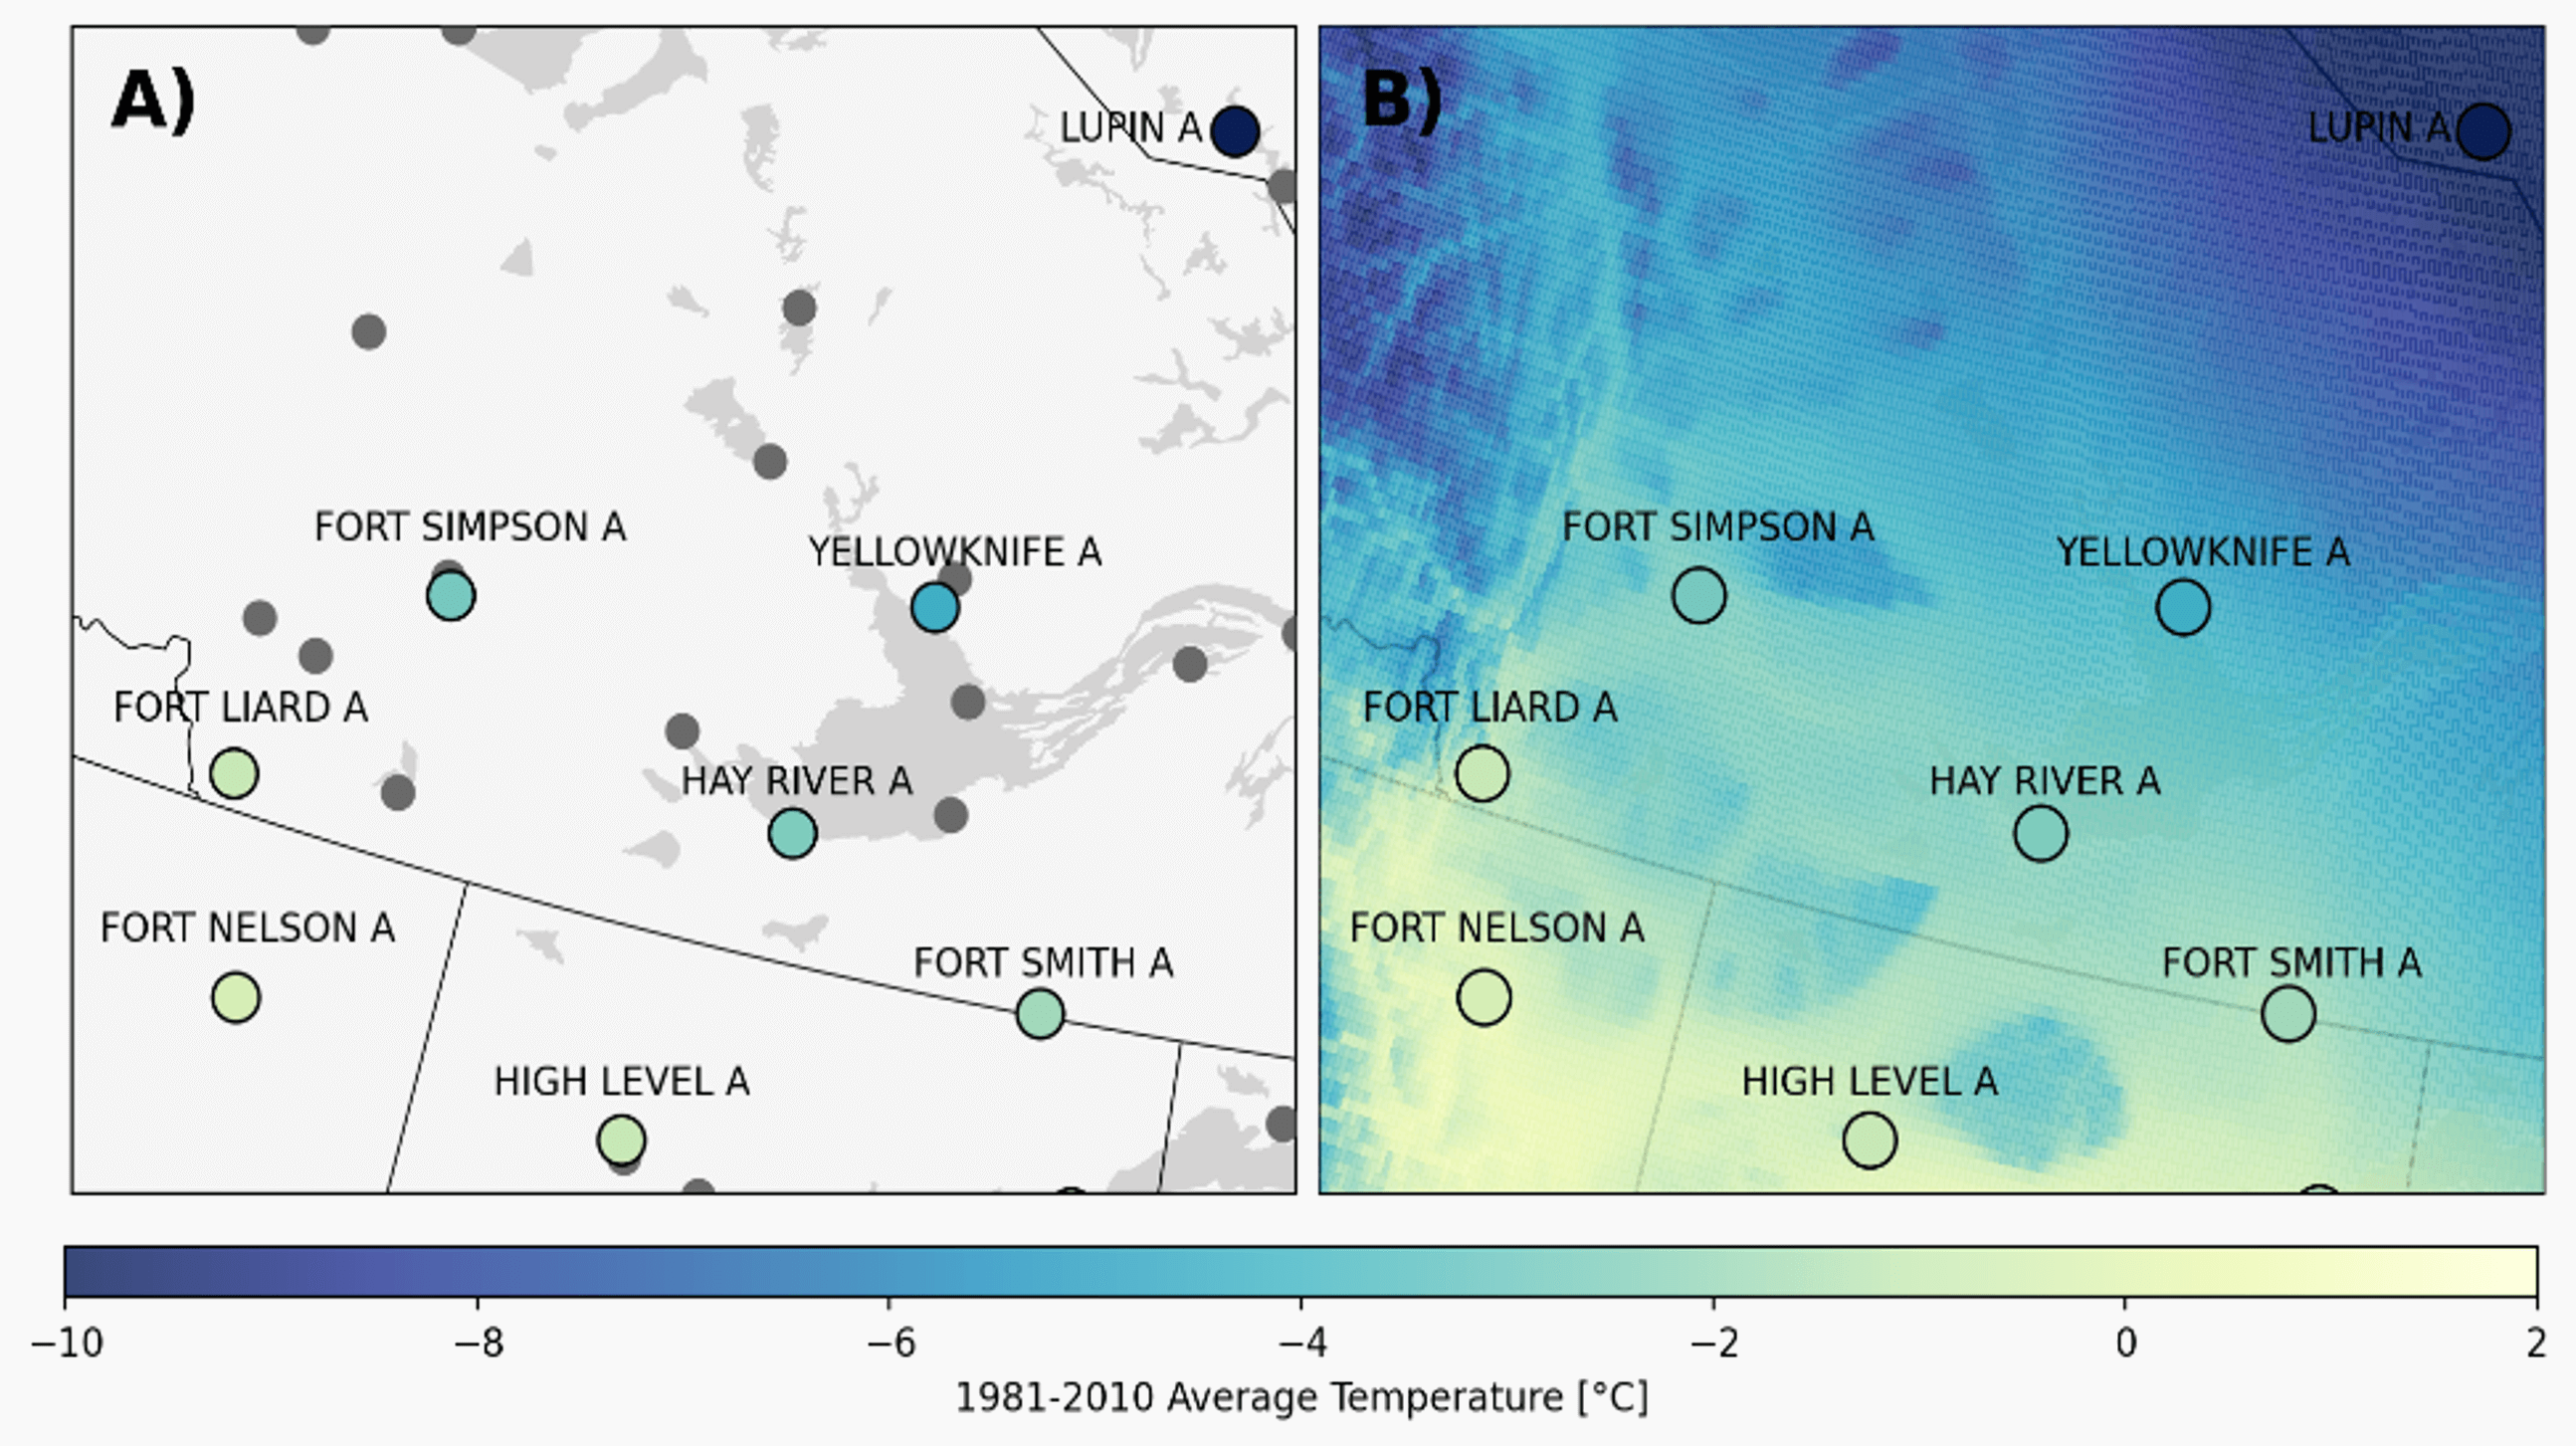
Gridded climate data represents the average climate over the area of the grid cell, meaning that it may not capture the specific conditions observed at a weather station. This means that it may not be appropriate to compare gridded data and point observations directly. If the comparison is necessary, be aware that they are not expected to be the same, since gridded data represents average conditions over the area of the grid cell and point observations represent the conditions at a particular point within that grid cell.
For more information on how to pick a historical climate dataset, check out Which Historical Data Set Should I Use? on ClimateData.ca.