Snowfall data user guide

Learn about the new snowfall data on ClimateData.ca, which describes historical snowfall trends and future projections for Canada.

Module

Understanding Future Projections

Format

Article

Time to completion

15 minutes

Key Messages

  • Snowfall patterns in Canada are responding to climate change. Many regions have experienced notable decreases in annual snowfall, seasonal snowfall accumulation, and snow cover. These trends are projected to continue.
  • ClimateData.ca offers projections of daily snowfall across four emissions scenarios, along with key indices such as total snowfall, days with snowfall exceeding 2 mm and 10 mm, maximum 1-day snowfall, and snowfall season length.
  • Snowfall is represented by Height of New snowfall Water equivalent (HNW) (mm), which reflects the water content of newly fallen snow over the past day.
  • These projections can help communities, planners, and decision-makers assess how climate change is influencing snowfall-related hazards in areas such as infrastructure, transportation, recreation, business operations, water resource management, and emergency preparedness.

Impact of changing snowfall in Canada

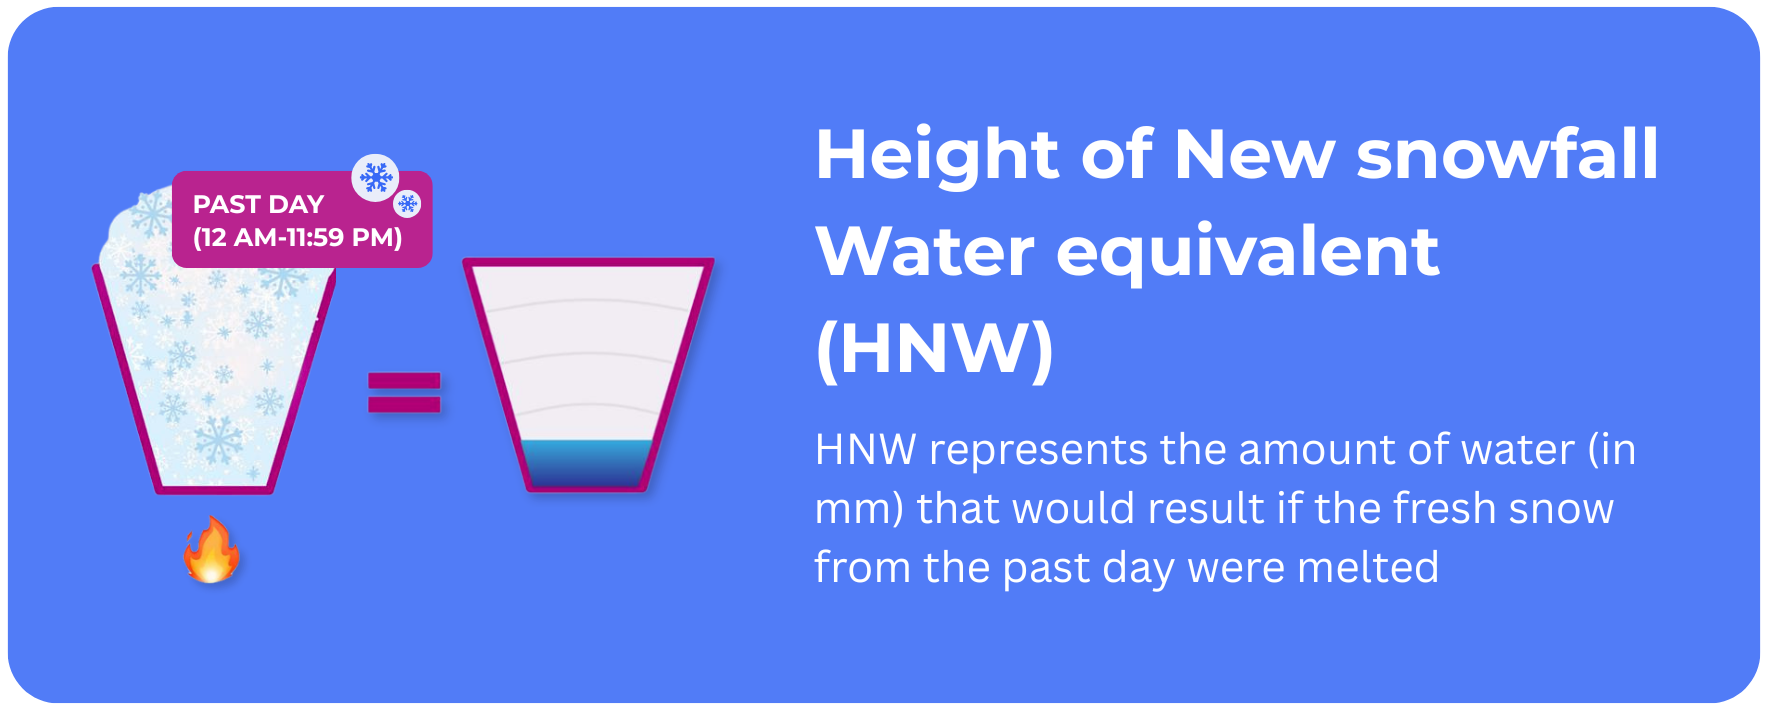
Snow plays a key role in weather and climate across Canada, influencing both the environment and economy. Snowfall is a major source of freshwater and is also linked to several natural hazards, including droughts, floods, and storms. Snowfall accumulation (snow depth) influences ground temperatures and the thickness of lake and sea ice via its reflective and insulating properties. Declining seasonal snow accumulation reduces water availability in the spring, affecting agriculture and hydroelectricity production and potentially increasing wildfire risks. Canada’s billion-dollar winter recreation industry1 relies on consistent snow and cold temperatures.

While declining snowfall can be problematic, the same can be said for too much snowfall, particularly in regions that historically have not experienced high amounts of snowfall. In these cases, an increase in total winter precipitation, particularly over a short period of time, can challenge infrastructure (e.g., increase the risk of roof collapse), strain snow removal, emergency assistance and other services, and create challenges for accessing food and water.

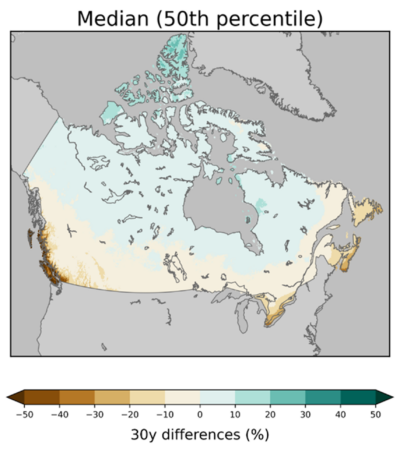
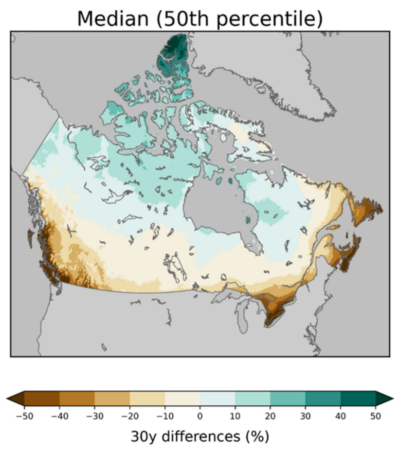
Climate change is causing a decline in both the spatial extent of snow cover and the amount of seasonal snow accumulation across most of Canada2,3. From 1981 to 2015, most of Canada experienced a decline in snowfall, except for the Northwest Territories and western Nunavut.

What snowfall data is now available?

Given the importance of snow and the impact of changes in its patterns and amounts, there is a growing demand for projections of future snowfall to support climate-resilient decision-making. Until now, high-resolution, downscaled, bias-corrected snowfall data has not been available.The release of the Canadian Downscaled Climate Scenarios dataset – Multivariate CMIP6 (CanDCS-M6)5 by the Pacific Climate Impacts Consortium (PCIC) has made it possible to develop reliable snowfall estimates derived from both temperature and precipitation data, as it preserves relationships between these variables during downscaling.An empirically based function developed by Dai (2008)6 was used to calculate the fraction of total precipitation that falls as snow, based on daily mean temperature. Once the snowfall fraction is determined, it is used alongside daily total precipitation to estimate daily snowfall amounts. This method was applied to 26 downscaled GCMs across four emissions scenarios (SSPs). In addition to daily snowfall, Table 1 shows other snowfall-related climate indices available on ClimateData.ca.

Table 1: Snowfall indices on ClimateData.ca and their availability by time frequency. All snowfall data is available as Height of New snowfall Water equivalent or HNW (in mm).

Snowfall IndexTime frequency available

Monthly

SeasonalAnnual30-year average

30-year change

Total Snowfall

Total number of days when snowfall exceeds 2 mm (sn2mm)

Total number of days when snowfall exceeds 10 mm (sn10mm)

Max 1-day snowfall (snx1day)

Snowfall season length (number of days between the first and last snowfall day)

NA

NA

To accurately calculate the snowfall season length, the snow year is defined as beginning on July 1 and ending on June 30 of the next year. This avoids errors that occur when using the calendar year, such as incorrectly identifying snowfall across two winters as part of the same season. The snowfall data on ClimateData.ca is available as water equivalent of new snowfall in millimetres (mm), also known as Height of New snowfall Water equivalent (HNW).

What is Height of New snowfall Water equivalent (HNW)?

Height of New snowfall Water equivalent (HNW) represents the amount of water (in mm) that would result if the fresh snow from the past day (12 AM- 11:59 PM) were melted (Figure 1). It is a measure of the water content of newly fallen snow.

Figure 1: Depiction of Height of New snowfall Water equivalent (HNW)

While similar in concept, HNW is different from Snow Water Equivalent (SWE). SWE refers to the depth of water (in mm), that would be obtained if all of the accumulated snow currently covering the ground were melted (Figure 2).

Figure 2: Depiction of Snow Water Equivalent (SWE)

Therefore, HNW represents the water equivalent of new snowfall over a single day, whereas SWE accounts for water equivalent of the total snow on the ground at a given time. Understanding this distinction is important for interpreting snowfall data on ClimateData.ca. All calculated snowfall values are provided in millimetres because they are derived by applying the snowfall fraction (fraction of total precipitation that falls as snow) to total precipitation, which is also measured in millimetres. HNW does not include the fraction of precipitation that falls as rain, only snow.

Finally, since snow is a mix of water in both ice and liquid forms, as well as air, the HNW and SWE are both less than the depth of snow on the ground.

To learn how to convert Height of New snowfall water equivalent (mm) to depth of new snow (cm) please read the Technical Note

How is snowfall in Canada projected to change?

By the end of the century, under lower emissions scenarios (SSP1-2.6 and SSP2-4.5), total annual snowfall is projected to change by less than 50 mm in most locations across Canada compared to historical levels with notably larger decreases expected along the western and eastern coasts (Figure 3).

Under higher emissions scenarios (SSP3-7.0 and SSP5-8.5), widespread decreases in snowfall are expected by the end of the century, with substantial decreases in the length of the snowfall season anticipated along the eastern and western coasts (Figure 4).

In contrast, in Canada’s far north, where winter temperatures will often remain below zero even under global warming, models project modest increases in annual mean and extreme snowfall amounts. When temperatures are warmer, the atmosphere can hold more moisture, which can result in greater snowfall potential in many northern regions.

Overall, the snowfall season is projected to be shorter across Canada, particularly in Atlantic Canada. Snowfall is expected to decrease in fall and spring and increase slightly in winter. The most pronounced changes in snowfall and related indices are anticipated along the Atlantic, Pacific, and far northern coasts.

Figure 3: Percentage change in annual snowfall from 1971-2000 to 2071-2100 under a low emissions scenario (SSP1-2.6)

Figure 4: Percentage change in annual snowfall from 1971-2000 to 2071-2100 under a high emissions scenario (SSP5-8.5)

Limitations, considerations and best practices

Spatial resolution and local variability

While these projections provide useful information on how snowfall is projected to change under various emission scenarios, there are some important limitations to consider. HNW is a proxy for actual snowfall. Dai’s (2008) temperature-based method works well at surface-level pressures, but it does not consider the effects of humidity and elevation. Consequently, biases may be present in regions over bodies of water and in mountainous regions when temperatures are near freezing.


The data are presented at a resolution of approximately 6 x 10 km, meaning that each grid cell reflects average snowfall values over that entire area. This spatial averaging can miss small-scale features, especially in regions with varied terrain, such as when a single grid cell includes both a mountain and a lower-elevation community. The snowfall dataset also does not consider a location’s proximity to water bodies, wind exposure, or surrounding built environment.


Another limitation of the snowfall dataset is that the model agreement is weak regarding the precise location of the transition zones between southern and northern Canada, where the projected change in snowfall shifts from a decrease to an increase.


Where local snowfall data is available, site-specific risk assessment and decision-making would be best informed by using these data in combination with the future snowfall projections available on ClimateData.ca. Some sources of local data are listed in the Additional Resources section.

Difference between snow load and snowfall for infrastructure planning

Heavy snow accumulation can put significant strain on infrastructure, increasing the risk of damage or failure. Snow load is defined as the weight of snow that accumulates on a structure (typically measured in units of pressure e.g., kilopascal). The magnitude of snow load depends not only on the depth of snowfall, but also on the snow’s density, type (wet vs. dry), compaction, melting and refreezing, redistribution by wind, and rain-on-snow events.

Although snowfall and snow load are related, they are not interchangeable. Snowfall only measures the amount of snow that has fallen, not the actual weight that a structure must bear. When using snowfall data in infrastructure planning, users should exercise caution, as snowfall can only be reliably translated into snow load when there is no existing snowpack and the snow’s density is known. For example, this may be possible for rare snowstorms on the West Coast, where there is often no preexisting snow. Infrastructure design and risk assessments require direct consideration of snow load, not just snowfall.

The Climate-Resilient Buildings And Core Public Infrastructure Report provides more information on how to consider snow in the planning of resilient infrastructure.

Summary

Snowfall patterns in Canada are changing in response to climate change, with many regions experiencing declines in total snowfall, accumulation, and snow cover—trends that are expected to continue. Future projections of daily snowfall under four different emissions scenarios are available on ClimateData.ca, along with several new snowfall indices to support planning and adaptation. This article introduces these indices, the time periods for which they are available, and the difference between Height of New snowfall Water equivalent (HNW) and Snow Water Equivalent (SWE). This article also describes snowfall projections for Canada and important considerations for the use of these data.

Additional Resources

1. Ouranos Total Solid Precipitation: Provides historical (1991–2020) and future (up to 2100) projections of solid precipitation (i.e. when mean temperature is below 0°C) as SWE (mm).
2. Northern Climate Data Report and Inventory (NCDRI): Provides datasets for Canadian North.
3. Building Design Value Summaries: Provides snow load recommendations for cities across Canada, based approximately on mid- and end-century timeframes and global warming levels of 1.5°C and 3.0°C, respectively.

References

  1. Statistics Canada. (2024, November). Amusement and recreation industry, 2023. https://www150.statcan.gc.ca/n1/daily-quotidien/241104/dq241104c-eng.htm
  2. Zhang, X., Flato, G., Kirchmeier-Young, M., Vincent, L., Wan, H., Wang, X., Rong, R., Fyfe, J., Li, G., Kharin, V.V. (2019): Changes in Temperature and Precipitation Across Canada; Chapter 4 in Bush, E. and Lemmen, D.S. (Eds.) Canada’s Changing Climate Report. Government of Canada, Ottawa, Ontario, pp 112-192.
  3. Derksen, C., Burgess, D., Duguay, C., Howell, S., Mudryk, L., Smith, S., Thackeray, C. and Kirchmeier-Young, M. (2019): Changes in snow, ice, and permafrost across Canada; Chapter 5 in Canada’s Changing Climate Report, (ed.) E. Bush and D.S. Lemmen; Government of Canada, Ottawa, Ontario, p.194–259.
  4. Mudryk, L. R., Derksen, C., Howell, S., Laliberté, F., Thackeray, C., Sospedra-Alfonso, R., Vionnet, V., Kushner, P. J., & Brown, R. (2018). Canadian snow and sea ice: historical trends and projections. The Cryosphere, 12(4), 1157-1176.
  5. Sobie, S.R., Ouali, D., Curry, C.L. & Zwiers, F.W. (2024). Multivariate Canadian Downscaled Climate Scenarios for CMIP6 (CanDCS-M6). Geoscience Data Journal 11, 806–824. https://doi.org/10.1002/gdj3.257
  6. Dai, A. (2008). Temperature and pressure dependence of the rain-snow phase transition over land and ocean. Geophysical Research Letters 35. https://doi.org/10.1029/2008GL033295
  7. Mekis, É., & Brown, R. (2010). Derivation of an adjustment factor map for the estimation of the water equivalent of snowfall from ruler measurements in Canada.  Atmosphere-Ocean, 48(4), 284–293.  https://doi.org/10.3137/AO1104.2010
  8. Mekis, É., & Vincent, L. A. (2011). An Overview of the Second Generation Adjusted Daily Precipitation Dataset for Trend Analysis in Canada. Atmosphere-Ocean, 49(2), 163–177. https://doi.org/10.1080/07055900.2011.583910
  9. Environment and Climate Change Canada. (n.d.). Weather tools: Interesting facts.. Government of Canada. https://www.canada.ca/en/environment-climate-change/services/weather-general-tools-resources/frequently-asked-questions.html