Last update: August 2026
NOTE: The information on this page is neither prescriptive nor exhaustive. Content is updated periodically as more information becomes accessible. Readers are encouraged to consider complementary information.
Explore climate indicators and data resources relevant to extreme heat and heatwaves in Canada.
Climate Hazards
Article
15 minutes
Last update: August 2026
NOTE: The information on this page is neither prescriptive nor exhaustive. Content is updated periodically as more information becomes accessible. Readers are encouraged to consider complementary information.
Extreme heat and heatwaves can occur at the same time as other hazards and be linked to other climate related hazards. To better understand extreme heat and heatwaves, this table can be considered with the tables on Wildfire and fire weather and Drought.
This table connects a climate-related hazard with readily available and relevant climate variables and indicators. Knowledge of regional characteristics is key for interpreting and using climate information in local planning. Where possible, project context, local knowledge, traditional knowledge, and/or additional assessments or studies can inform indicator selection and interpretation, to support the link from data to decision-making. Visit the Climate Hazards module to see the full list of hazard tables available, and to view the methodology and inclusion criteria for the tables.
| Future changes | Relevant climate variables and indicators | Climate Data Sources* |
|---|---|---|
| Hotter maximum temperatures. | Maximum temperature: The average maximum temperature in a selected period | National
Regional
|
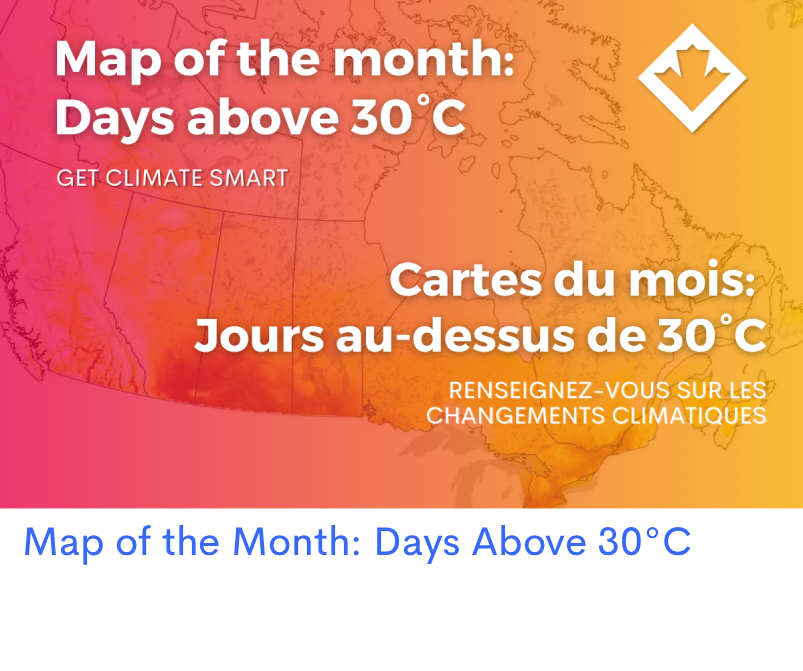
| More hot days. | Hot days: Number of hot days where the maximum temperature is above a locally relevant threshold such as 25 or 30°C | National
Regional |
| Local hot days: Percentage of days when daily maximum temperature is above the 90th percentile | National
| |
| More hot nights. | Hot nights: Number of hot nights (tropical nights) where the minimum temperature is above a locally relevant threshold such as 18 or 22°C | National
Regional |
| More humidex days. | Humidex days: Number of humidex days over a locally relevant felt threshold such as 30 or 40 | National
|
| Hottest day becoming hotter. | Hottest day: Highest maximum temperature in a selected period | National
Regional
|
| Hottest Day Return Level: Extreme temperature events (max daily max temp) that would be expected to occur once during a specified return period | National
| |
| Increasing frequency, intensity, duration, and changes in timing of heatwaves. | Heatwaves (as defined by locally relevant thresholds):
| National
Regional |
| Increased cooling needs. | Cooling degree days | National
Regional
|
| Increases in July design temperatures. | Building design temperatures:
| National
|
* Additional advanced data analytics tools listed on the Climate Hazards page provide more complex data download options, programming environments and specialized software to support bulk downloads, custom data processing, and analysis of large Canada-wide datasets, and include additional data not listed here.














This project was undertaken with the support of: