Hazard Information in CCCR 2026 and ClimateData.ca: Bridging the Gap Between Science and Practice

Date September 9, 2026
Author Canadian Centre for Climate Services
Topics New and Noteworthy
Share this post

Introduction 

Chapter 10 of Canada’s Changing Climate Report (CCCR) 2026, Canada’s authoritative national climate science assessment, focuses on Climate Services and Using Climate Information. Building on the report’s synthesis of observed trends and future projections, this chapter shifts from evaluating changes in climate to examining how climate information can be applied in real-world decision-making.  

The chapter describes the role of climate services in delivering decision-ready climate data and information. To do this, it focuses on 12 categories of climate-related hazards that often concern decision-makers. For each hazard, key messages for climate indicators assessed in CCCR 2026 are provided to help users understand how these phenomena may evolve under future climate conditions. 

ClimateData.ca, developed in collaboration with regional climate service providers and partners, provides an access point for exploring, visualizing, and applying the climate data presented in Chapter 10 and more. The portal contains new climate hazard pages that complement the information in CCCR 2026 and directly connect users to relevant climate variables and indicators.   

This article explores how Chapter 10 of CCCR 2026 and ClimateData.ca’s new climate hazard pages bridge the gap between the national climate change science assessment and the information needed to support local adaptation, providing a roadmap for finding, interpreting, and applying hazard data in your work. 
Box 1: ClimateData.ca in Chapter 10 of CCCR 2026 ClimateData.ca is referred to as a source of climate data and learning content in some chapters in CCCR 2026. Examples from Chapter 10 include:

  • The Spatial Analogues tool as an example of tailoring climate information for user needs. This tool takes projected data for a city (for example changes in the number of hot days and warm nights expected) and expresses it as a city that currently experiences the future projected climate. This comparison helps users contextualize this information.
  • The Uncertainty in Climate Projections article from the Learning Zone is referenced as a resource that supports users in navigating and interpreting uncertainty.

A hazard-based approach to understanding climate information 

Climate hazards can be defined as current or future climatic conditions that have the potential to drive adverse climate-related impacts [1]. They can be acute events (e.g., extreme weather events like a hailstorm or flood) or long-term changes (e.g., drought or permafrost changes). A hazard does not automatically result in negative impacts. Hazards become impactful when vulnerable people, infrastructure, systems or ecosystems are exposed to them.  

Because the occurrence of a climate hazard is the product of many factors including local climatic conditions (such as temperature, precipitation, or wind patterns) and topography (elevation, or proximity to large water bodies or mountains), creating a compound indicator to model and project a specific hazard can be challenging. Instead, we often rely on a suite of climate indicators to characterize how underlying conditions are shifting, helping us anticipate how these phenomena may evolve across different regions and time periods. 

Hazards are characterized by frequency, intensity, duration, and timing, as described in CCCR 2026. Individual climate indices describe changes in each of these dimensions. While some of these indices are based on one variable, such as temperature, others are more complex, combining multiple variables into one indicator. Changes in the climatic conditions that influence hazards (e.g., changes in relevant climate indicators) do not always translate directly into changes in the hazards themselves. These relationships can vary by region, season, and a range of other environmental factors (see Box 2 for an example).

It is important to keep these considerations in mind when using climate indicators to understand shifts in hazards. Indicators can provide useful signals, but they do not capture the full complexity of how hazards emerge or how they will affect different communities.

Box 2: Understanding a complex climate hazard: Pluvial Flooding

Pluvial flooding occurs when intense rainfall exceeds the capacity of drainage systems, causing water to accumulate on the ground. While often driven by heavy rain, its impact depends on a range of interacting factors.

Antecedent conditions (such as soil saturation), land characteristics (including soil type, topography, and stability), and the built environment (impervious surfaces and drainage infrastructure) all influence how water moves across the landscape. In some cases, interactions with river levels or groundwater can further affect flood severity.

Population density and patterns of development also shape who and what is exposed to flooding. As a result, changes in rainfall alone do not directly translate into changes in flood risk. As such, it is important to consider both climatic and non-climatic factors when interpreting climate data.

“At the heart of adaptation planning is understanding current and future risks due to a changing climate. The impacts of climate change pose different risks to different economic sectors and populations. To assess physical climate risks, it is often helpful to characterize them by climate hazard.” – Canada’s Changing Climate Report 2026, Chapter 10, Section 10.4

Chapter 10 reframes typical variable-centric approaches to communicating climate data -where information is organized by individual climate variables such as temperature or precipitation – toward a more intuitive hazards-based approach. It identifies 12 categories of climate-related hazards and connects them with relevant climate indicators that act as proxies for understanding how these hazards may evolve. For each hazard category, the chapter provides:

  • an overview of related hazards to help users understand interconnected risks,
  • CCCR-assessed key messages for relevant climate indicators,
  • links to the corresponding sections of CCCR 2026 for deeper exploration of the evidence base and analyses that support key messages,
  • commonly used terminology associated with the hazard category,
  • generalized projected directions of change for relevant indicators of the hazards, and
  • additional guidance on how to interpret and apply information for that hazard.

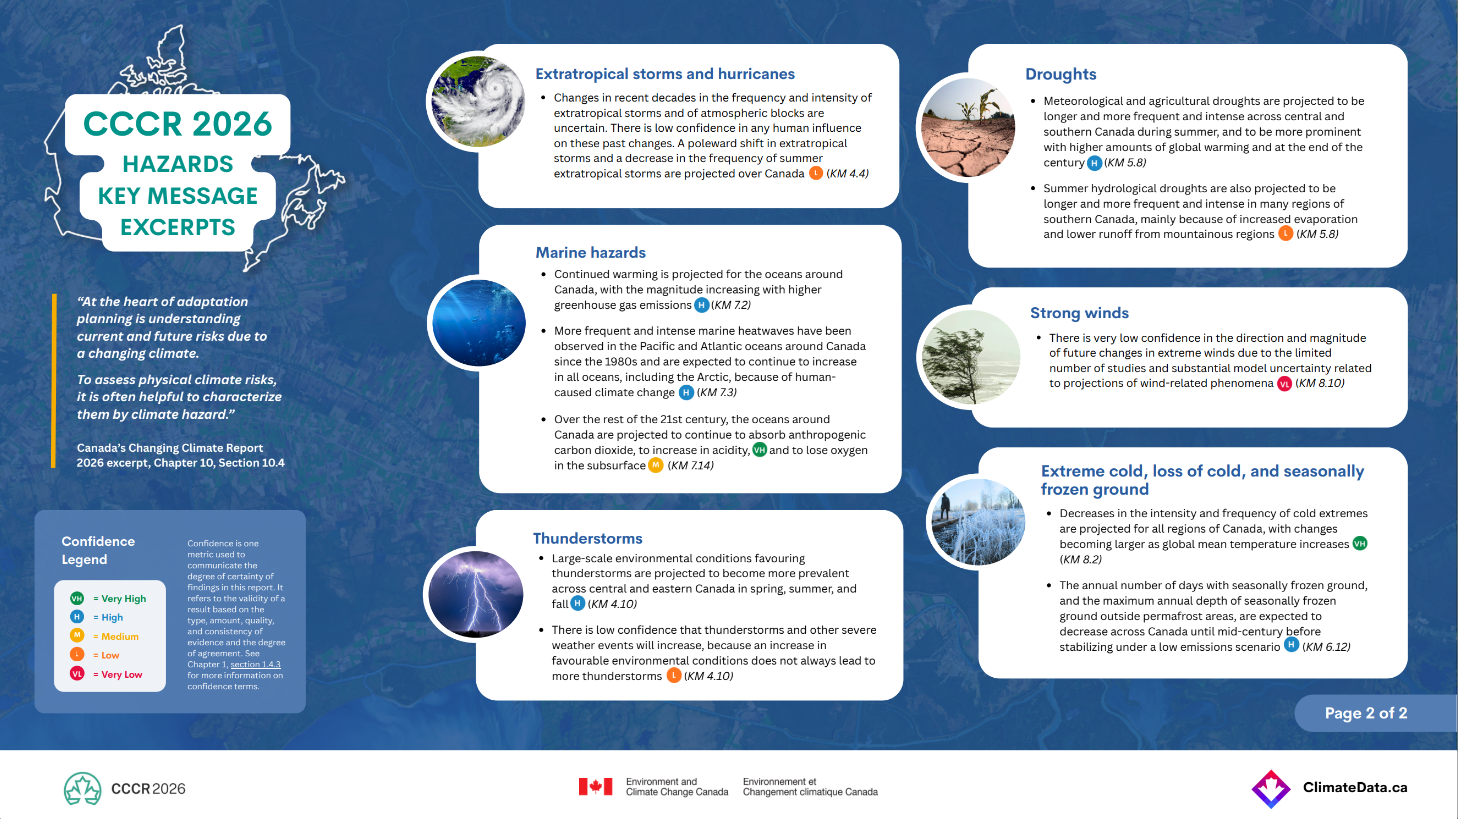
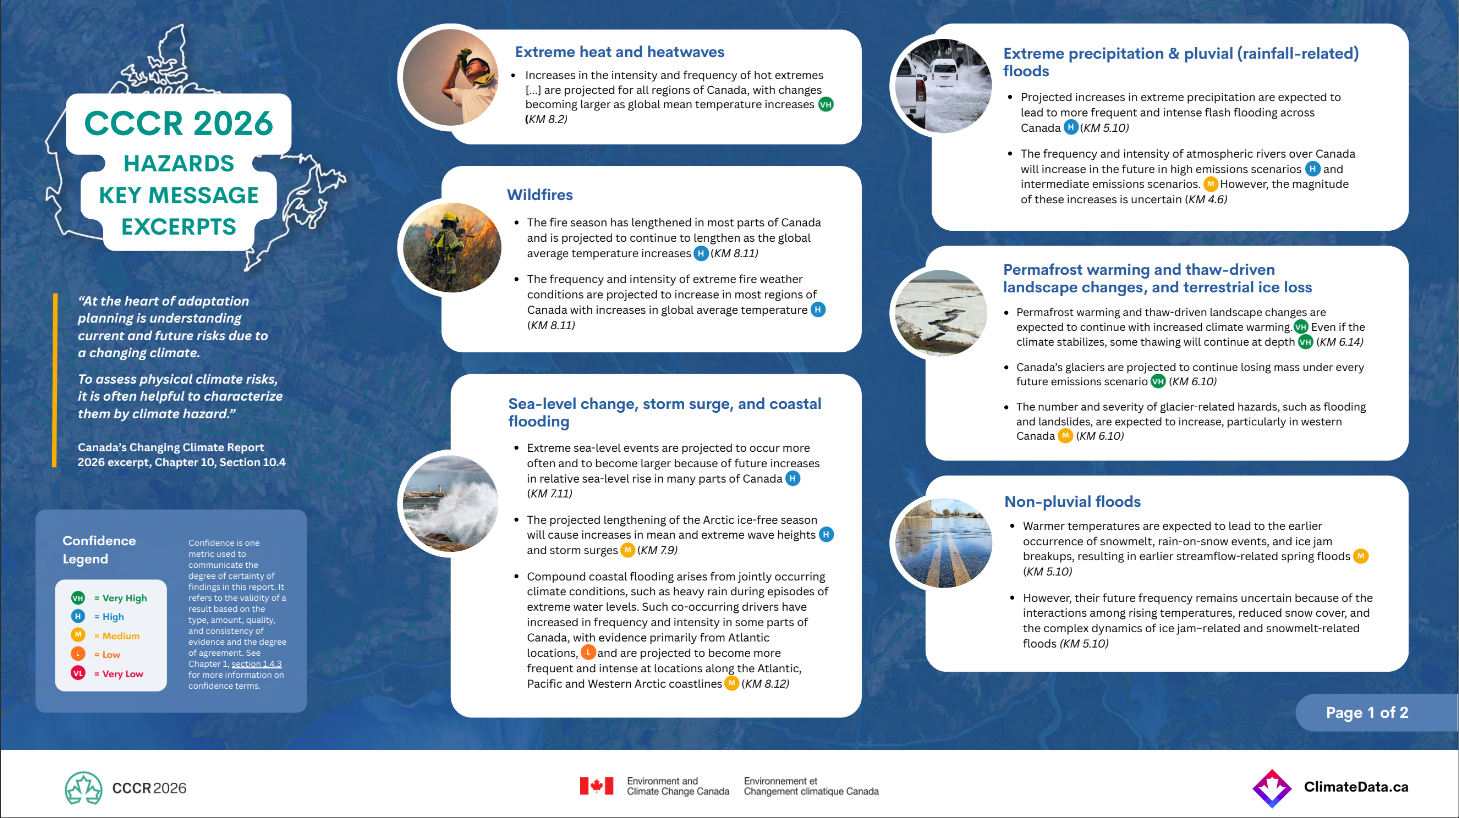
The key messages and general direction of change for each category are summarized in the graphic below. Explore Chapter 10 or search the key message numbers in the full report to find more detailed information for each hazard.

ClimateData.ca climate hazard pages

Inspired by the hazard-based approach to communicating climate data used in Chapter 10 of CCCR 2026, ClimateData.ca has created hazard pages for climate-related hazards that connect users to relevant climate indicators and the portals where data can be visualized and downloaded. While the hazard information in Chapter 10 of CCCR 2026 aggregates indicators used within the report, the pages on ClimateData.ca list and link to relevant variables within and outside of CCCR 2026 (see the “Our approach” section of the Climate hazards landing page for details).

These pages are intended to be a starting point for accessing and exploring climate data. They are not intended to be prescriptive or exhaustive but rather give users a place to begin to understand climate data from a hazard perspective. The pages link to online portals where climate indicator data can be found (both on ClimateData.ca where available, and via other climate data portals). Hazard pages currently include extreme heat and heatwaves and wildfire and fire weather.

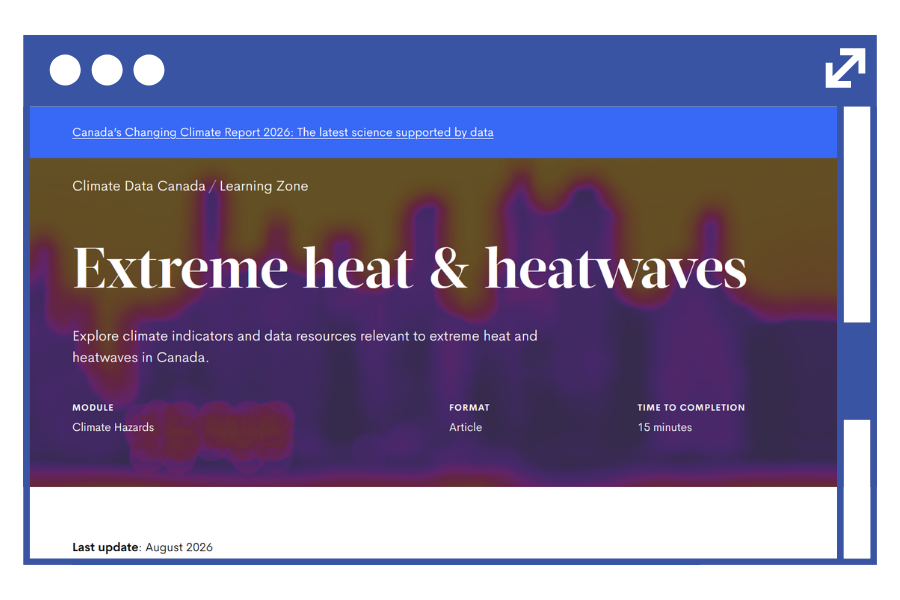
For example, users interested in heatwaves can explore a number of temperature variables and indicators to begin understanding how heatwaves might change in the future, such as hottest day, hot nights, and humidex days.

Figure 1: Screenshot of a section of the Extreme Heat and Heatwaves hazard page.

Periodic updates will be made to the pages as information becomes available, and more hazards will be added in future phases of release.

Summary and next steps

Understanding current and future risks due to a changing climate is important for effective adaptation. Chapter 10 of CCCR 2026 provides a hazard-based framework for understanding how climate conditions are changing and may change in the future. ClimateData.ca’s hazard pages complement this framework by helping users identify and access relevant climate data for their location and hazards of interest. Used together, these resources connect national-scale climate science to local adaptation.

Climate indicators can help users understand how the conditions associated with a hazard may change, but they do not provide a complete assessment of risk. Local information about exposure, vulnerability, and potential consequences must also be considered when applying these data in adaptation planning and decision-making.

To learn more and begin exploring the information for yourself, you can: