Introduction
In partnership with The AIM Network, Sepehr Khosravi, CLIMAtlantic’s Newfoundland Climate Services Specialist, supported seven Western Newfoundland communities in identifying the potential future climate change impacts they may face. As part of the initiative, local residents were invited to share their perspectives on future climate vulnerability and needed climate action.
What climate data was used?
In May 2023, Woody Point, Rocky Harbour, and St. Paul’s played host to a series of three community workshops where residents were presented with localized climate projections, accessible through ClimateData.ca. The projections highlighted various climate change trends such as increasing temperatures over time, shifting seasonal patterns, and alterations in intensity and frequency of precipitation events. The potential ramifications of future extreme weather events on the communities’ infrastructure were discussed, emphasizing the need for preparedness and adaptation strategies.
What did the data show?
Located on the Gulf of St. Lawrence coast of western Newfoundland, Rocky Harbour has an average temperature of 5.3ºC. In a high greenhouse gas emissions scenario, this could rise to 6.3 ºC by mid-century, 8.4 ºC around 2065, and 9.8 ºC by the end of the century.
Rising temperatures may lead to more hot days over 30°C, potentially up to 29 days by the end of the century. Winters could become shorter, with the first fall frost potentially happening in December instead of October, and the last spring frost possibly shifting to mid-April instead of early May. This could result in roughly 256 frost-free days, up from the current 173 days.
There might also be more heavy rain events rather than snow, with possibly 13 more days per year receiving over 20 millimeters of rain by the end of the century. Such climate changes could pose risks to infrastructure such as roads, bridges, trails, and sewage systems.
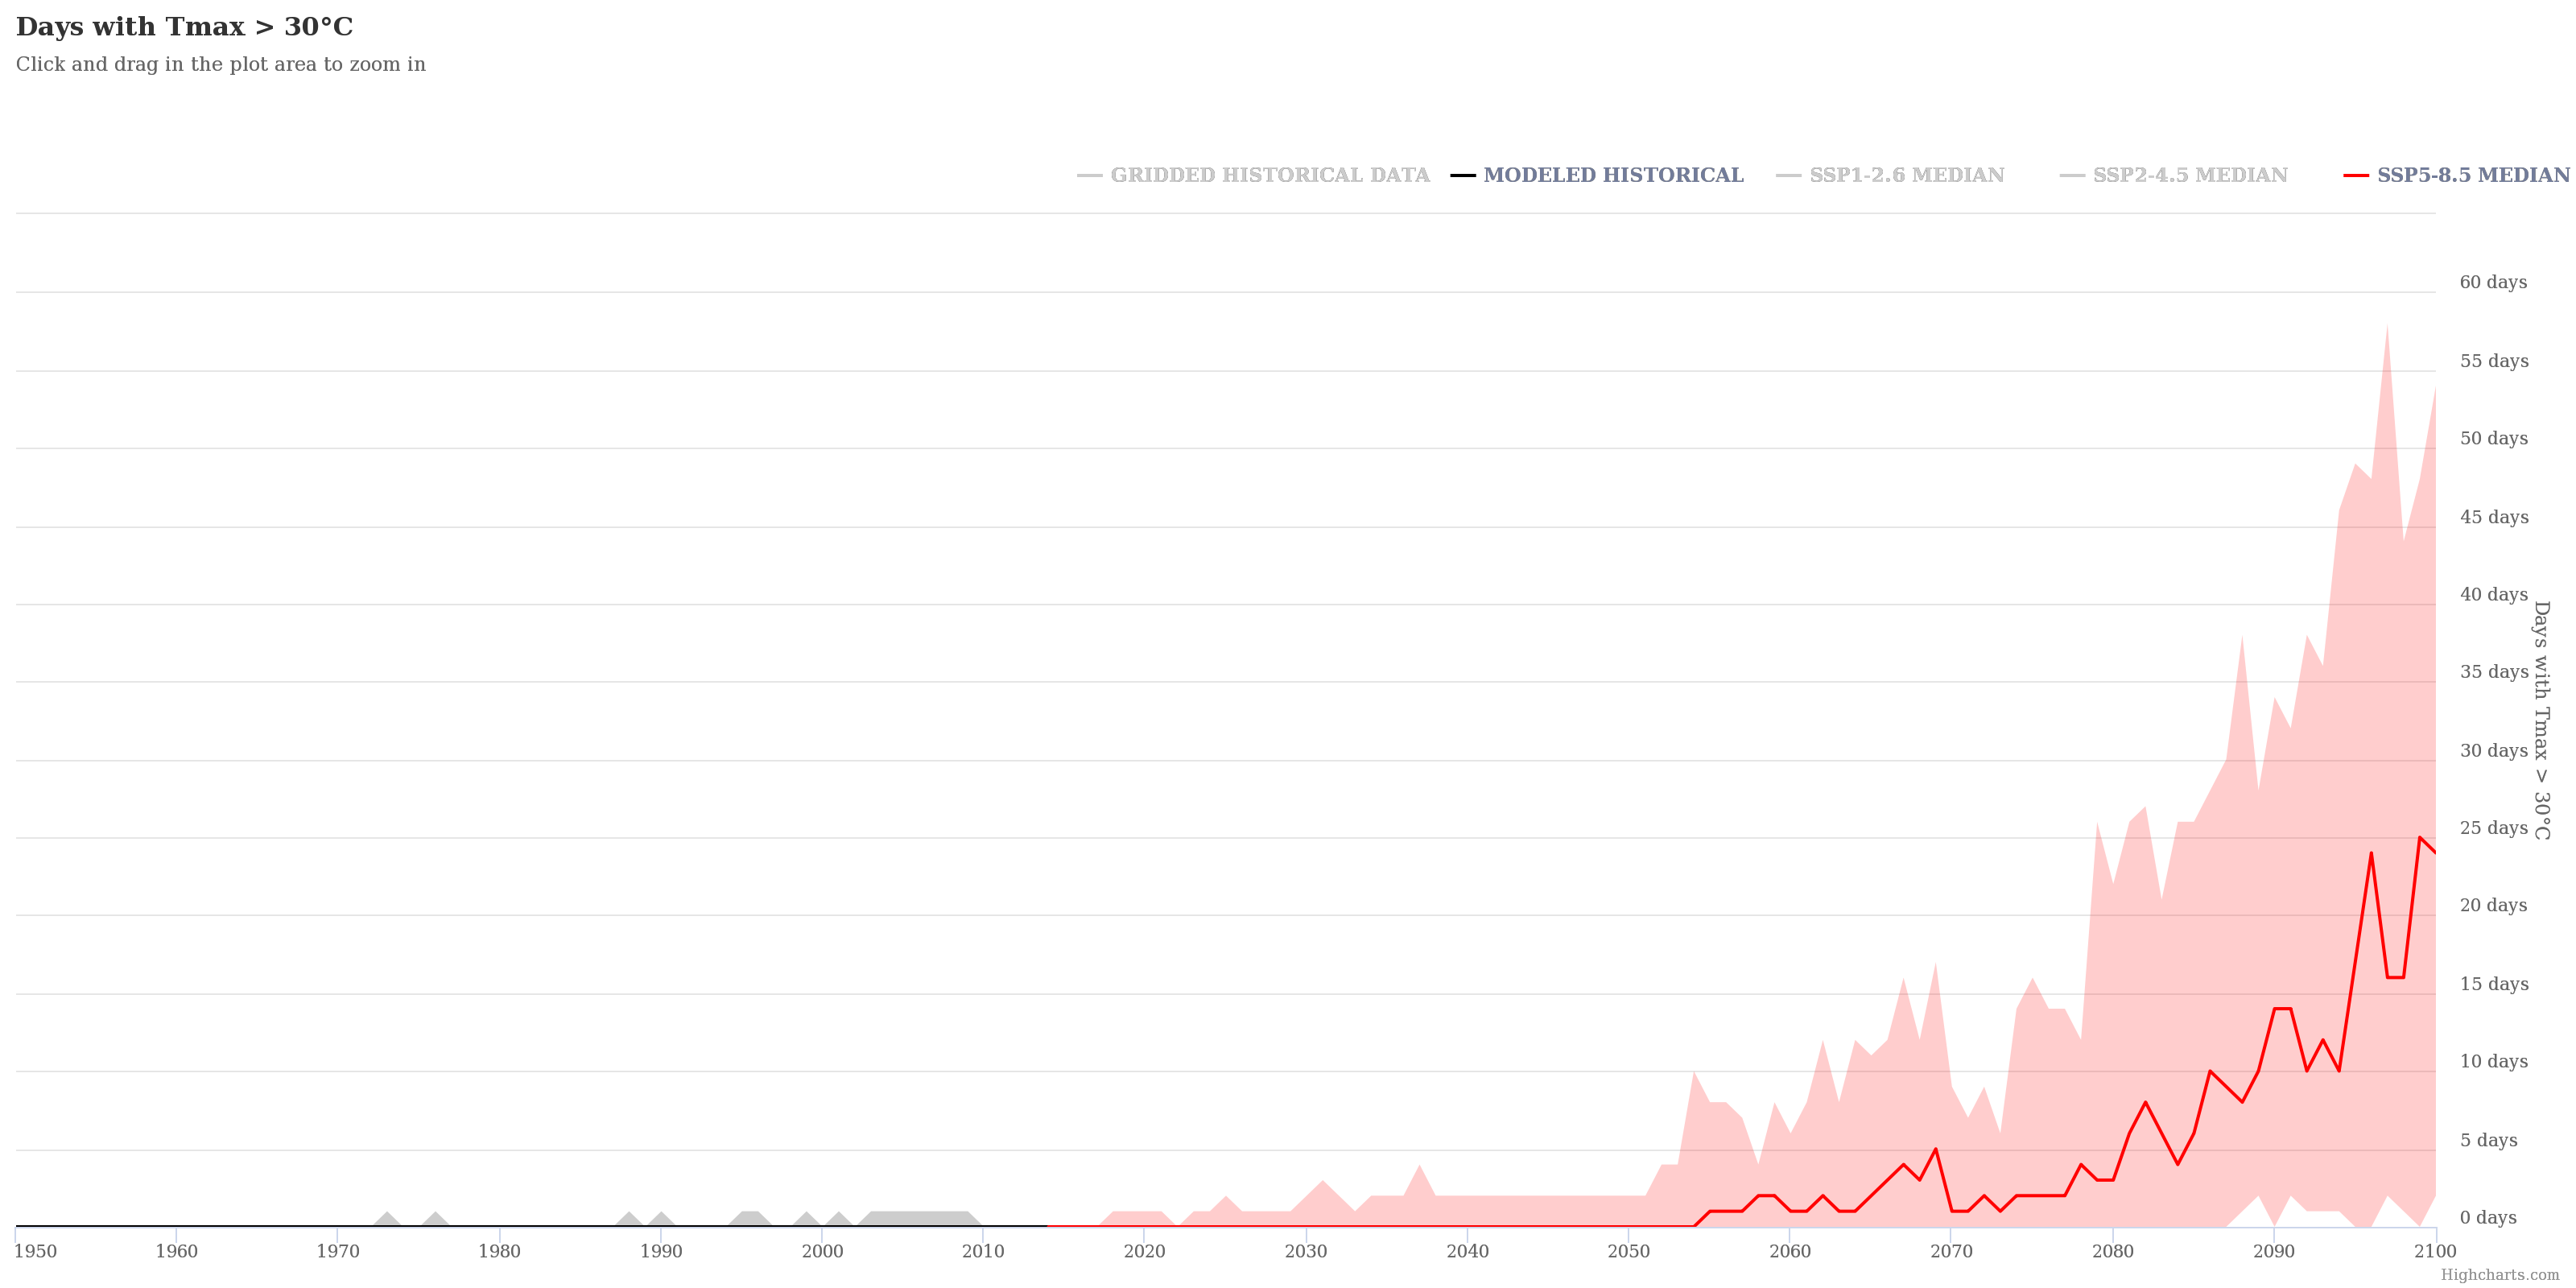
Figure1. Temperatures of 30°C or higher
Note: The data for this graph was obtained from ClimateData.ca. The y-axis represents the number of days with a daytime high temperature exceeding 30°C. The x-axis represents the years, including historical values and projected values by the end of the century. The projected values are modeled projections using the high emission scenario. The graph illustrates the changing frequency of extremely hot days in Rocky Harbour, Newfoundland. According to the model projections, the number of days with Tmax > 30°C is expected to increase significantly by the end of the century under the high emission scenario.
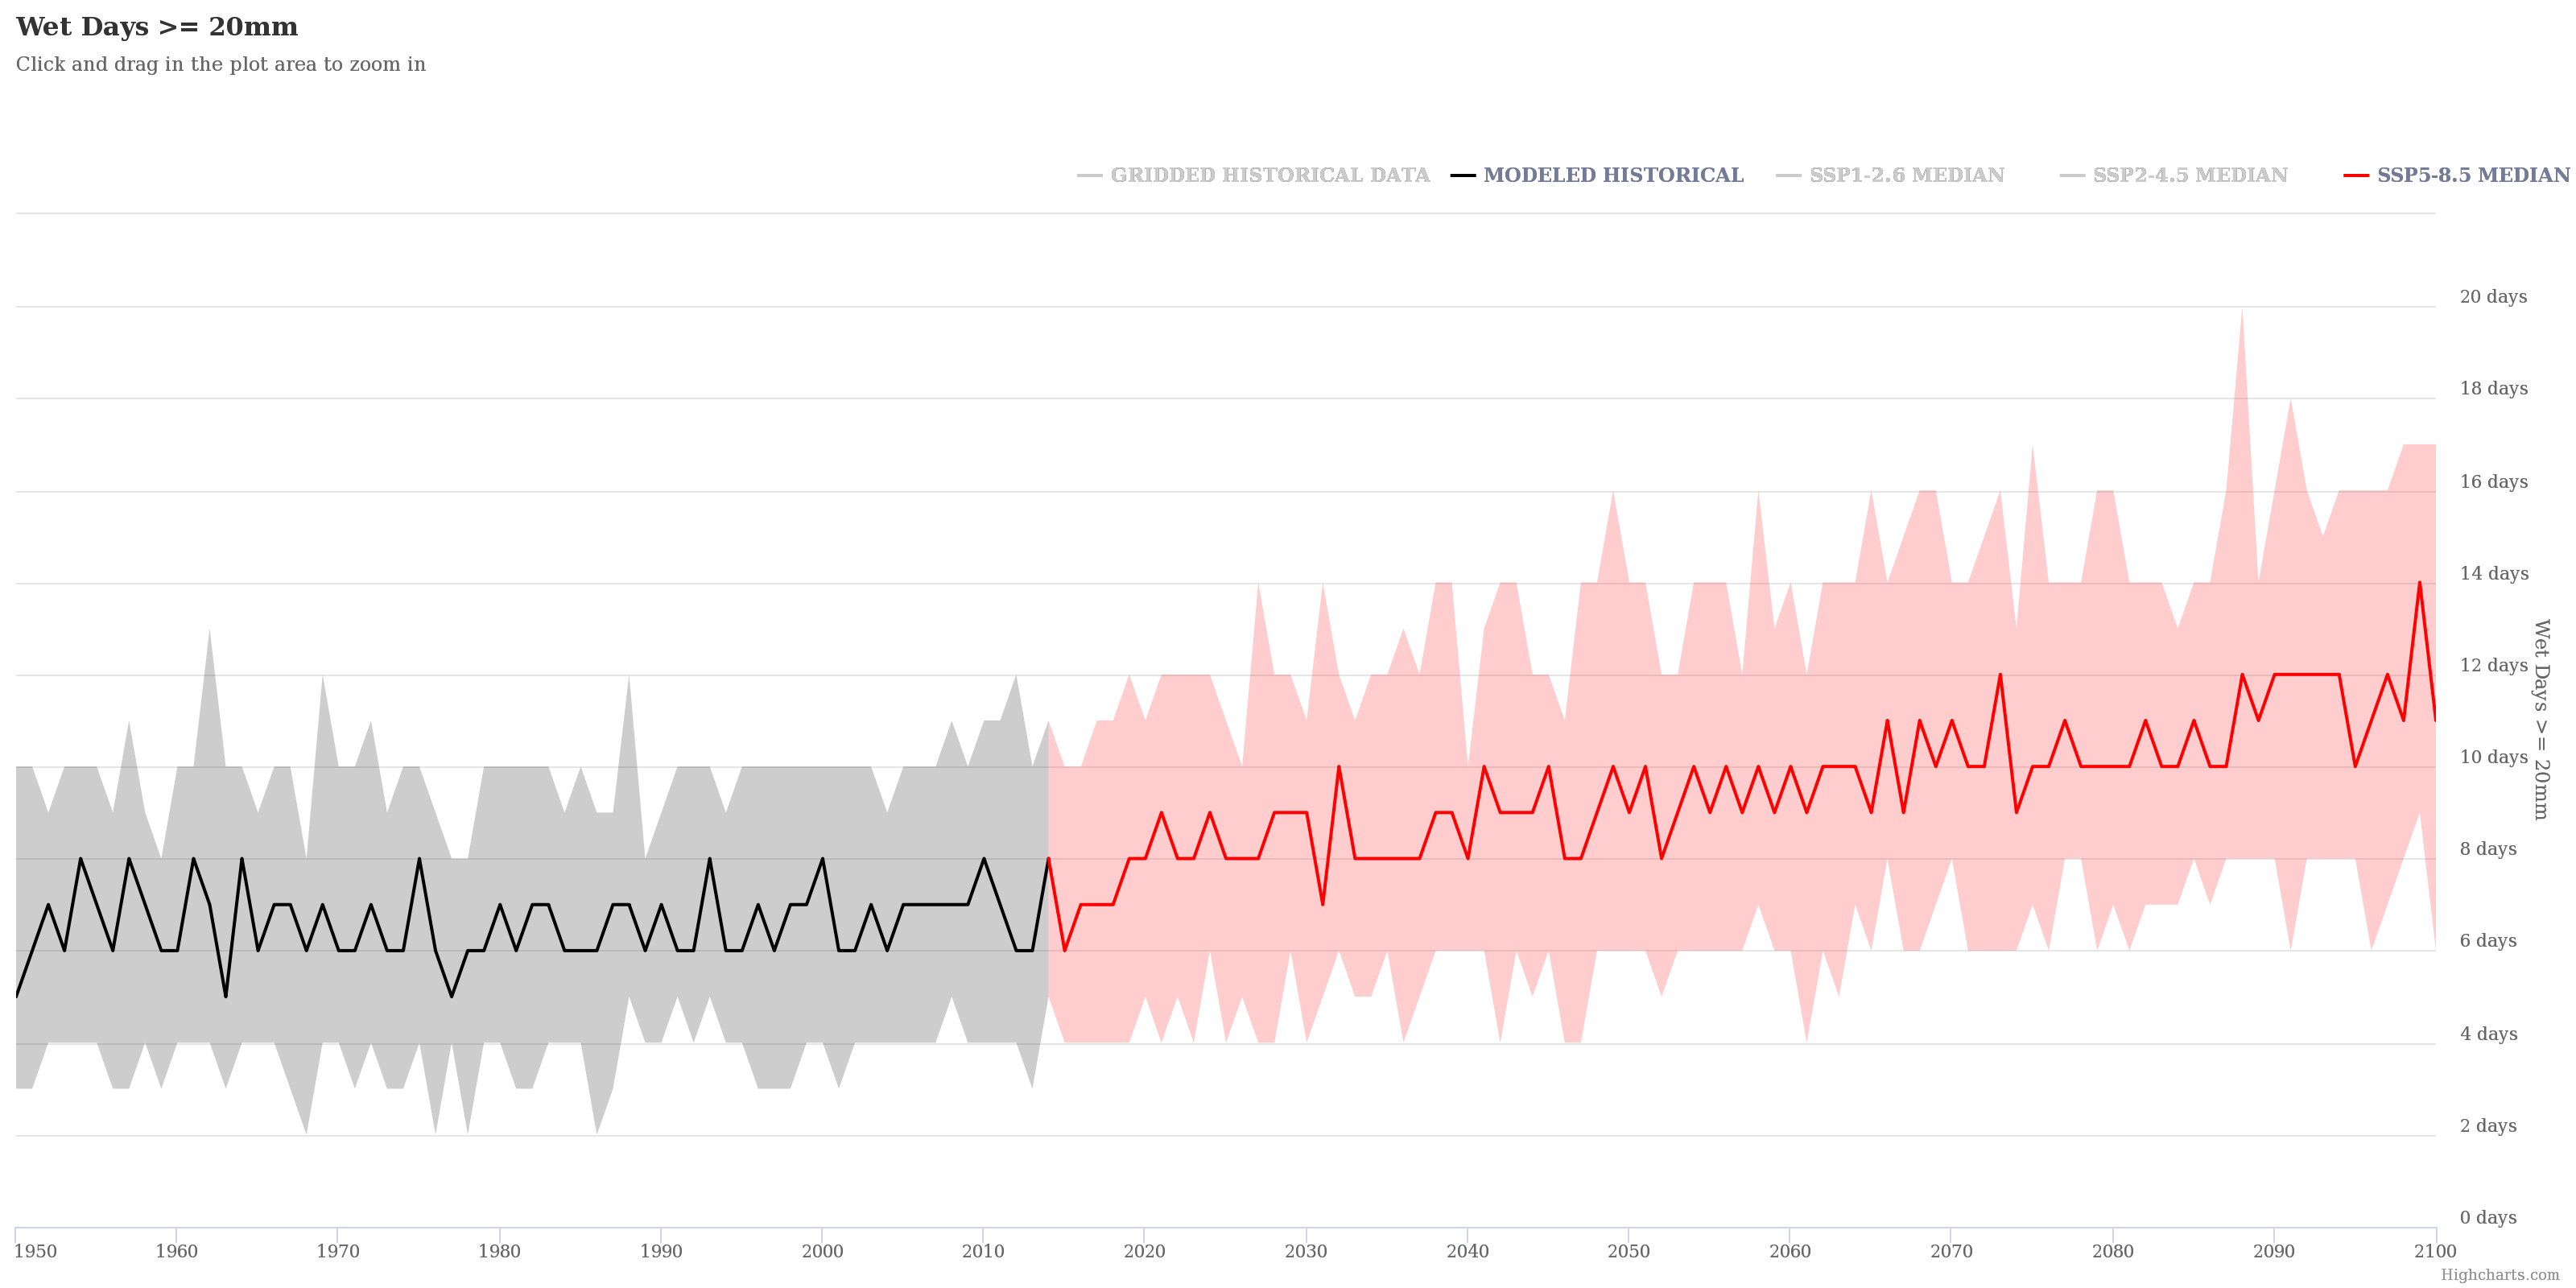
Figure 2. The number of days where at least 20 mm of precipitation
Note: The data for this graph was obtained from ClimateData.Ca.The y-axis represents the number of days with precipitation (rain and snow combined) equal to or exceeding 20 mm. The x-axis represents the years, including the modeled current dates and projected dates by the end of the century. The graph depicts the frequency of wet days with precipitation equal to or exceeding 20 mm during the selected time period. Both the historical/current dates and the projected dates are included in the graph, based on the high emissions scenario. According to the modeled projections, the number of wet days with precipitation 20 mm is expected to change by the end of the century under the high emission scenario.
How will these data be used?
In small towns like Rocky Harbour in Newfoundland, climate change is affecting their infrastructure and increasing susceptibility to disasters. A changing climate presents multiple challenges to the town, such as extreme precipitation and fewer frost-free days, and higher temperatures that introduce new risks. As a result of heavy precipitation events, wastewater infrastructure may be overwhelmed, the roads and bridges may be washed out, and the warmer temperatures may increase water stress. By using climate information, communities can better understand how the climate will change and make informed decisions.
This community engagement event, and others, provided an opportunity to inform local residents on how to access locally relevant data and projections. Residents can use the projections to advocate for and inform action plans.