At the Canadian Centre for Climate Services, we are always on the look out for new ways of tailoring and presenting our data to Canadians. One of our most recent experiments was to compute future-shifted Climate Zones, the regions referenced by building engineers and designers to ensure that appropriate energy efficiency codes and regulations are applied. Take a look at our preliminary work, and be sure to let us know if this is a product you would like to see made available on ClimateData.ca.
Climate has a major impact on a building’s energy performance. To ensure that a building can safely and comfortably withstand a wide range of weather conditions, building designers and engineers comply with local energy efficiency codes and thermal resistance requirements. These regulations dictate, among many things, the minimum requirements for certain thermal properties of building envelope components, such as U-values, a measure of how well insulated the inside of a building is from the outside and the Solar Heat Gain Coefficient for windows, or how much heat from the sun is allowed to transmit through windows.
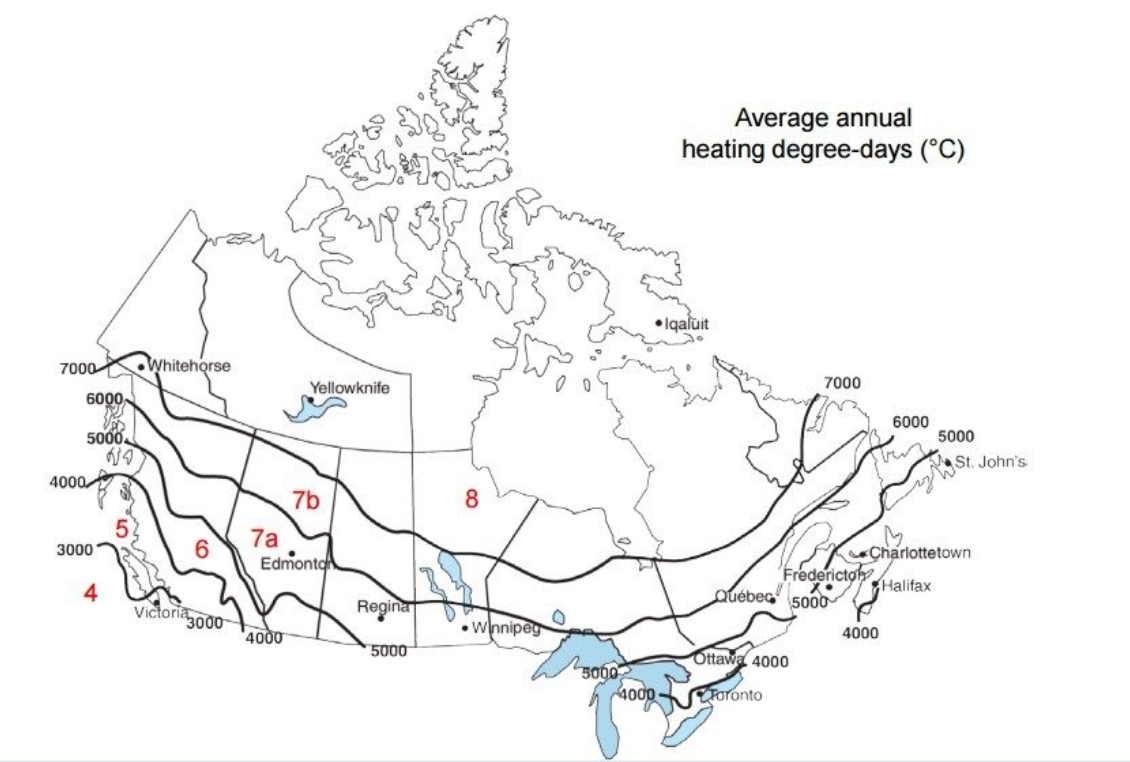
Owing to Canada’s diverse climate, there are considerable differences in energy efficiency requirements across different regions. To aid engineers and designers in selecting the appropriate requirements in their jurisdiction, the National Energy Code of Canada for Buildings (NECB) has divided Canada into six “Climate Zones” – named 4, 5, 6, 7a, 7b, and 8. Zone 4 is the warmest zone, and so buildings here typically require less insulation compared to buildings in Zone 8, the coldest zone.
Canada’s National Energy Code Climate Zones are based on the accumulation of Heating Degree Days (HDDs). HDDs are based on the number of degrees Celsius a given day’s average temperature is below 18 °C. For example, if the daily average temperature is -10 °C, the HDD value for that day is equal to 28. However, if the daily average temperature is above 18 °C, the HDD value for that day is zero. HDDs are tallied for the entire year. The higher the total HDD value, the colder the climate. The average (recent past) HDD value for Ottawa is about 4,500 whereas the average for Iqaluit is closer to 10,000.
However, due to the climate warming that has already occurred and is projected to continue, these existing Climate Zones no longer accurately represent the climatic reality that buildings experience now, nor throughout their designed lifespan. Without designing explicitly for a future climate, buildings will be increasingly maladapted to their climate, placing them at increased risk of overheating – a health and safety issue for occupants and potentially requiring expensive retrofits.
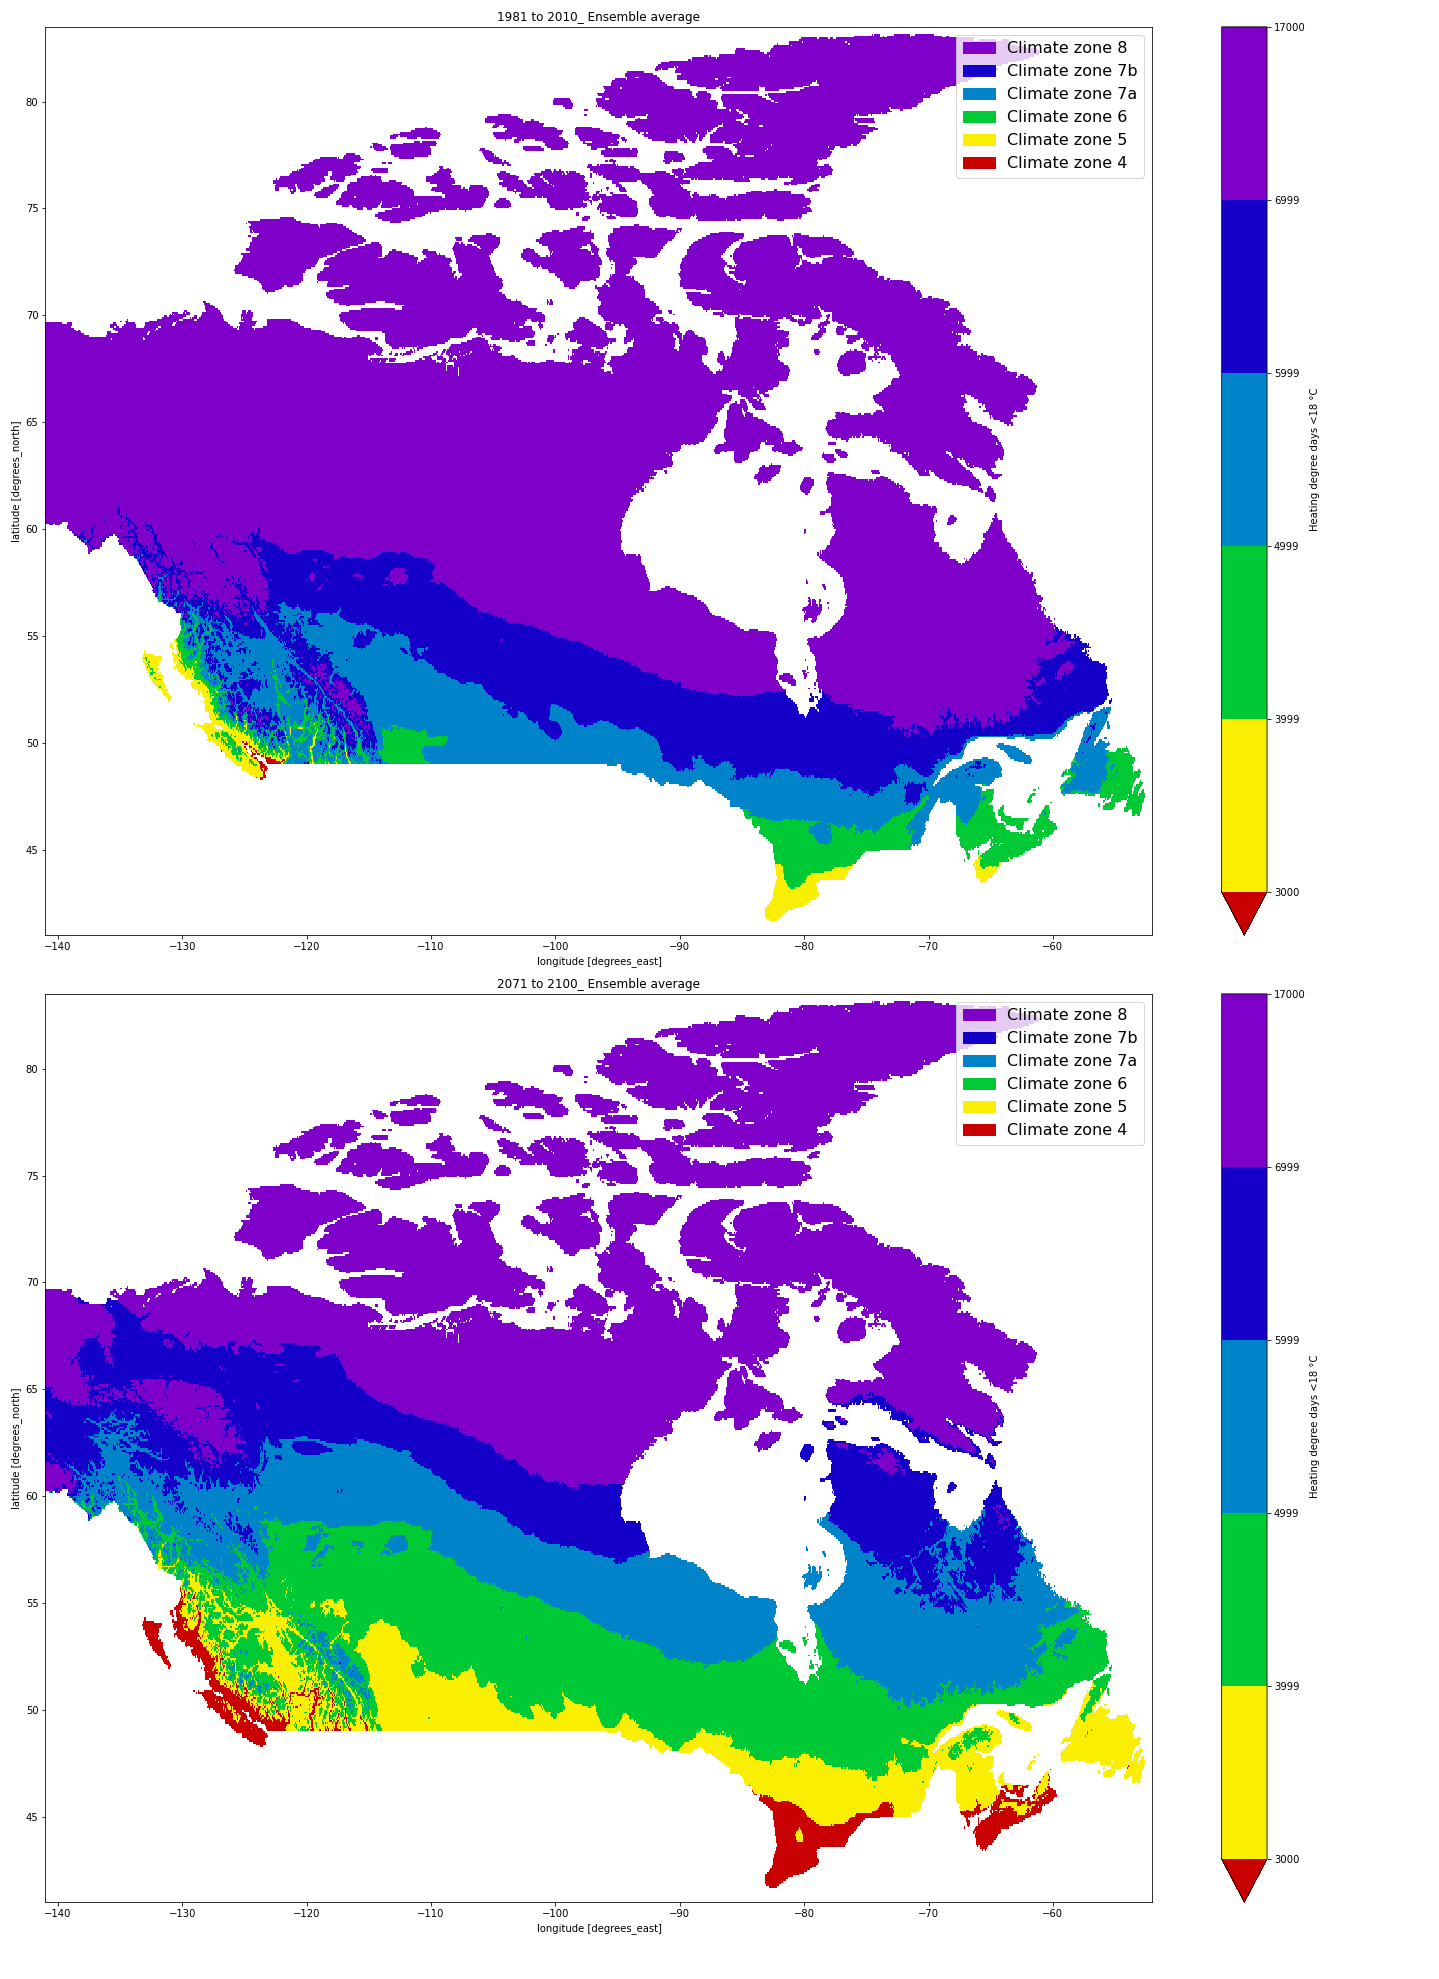
That said, because the Climate Zones are based on temperature, it is relatively straightforward to use climate model projections to compute future-shifted Climate Zones. Doing so would allow designers and engineers to proactively understand the magnitude of the need to take future energy requirements into account, right now. So, we decided to give it a try.
Discussion - What do you think?
These maps show that a large shift in these Climate Zones is anticipated, especially if global greenhouse gas emissions track closely with the high-carbon scenario (RCP8.5). This implies that a large number of structures will experience conditions that are outside of their energy performance requirements. In addition, the shift in Climate Zones classification suggests very different energy requirements across municipalities, considerably influencing how we design buildings. It would seem, then, that a product like this could be beneficial to the buildings sector.
However, simply having new data available does not automatically mean practices will change. First, national bodies like the NECB would have to approve these data and publish them as the new national standard. More importantly, because energy codes and regulations are set and enforced at the provincial/territorial level, many procedural and regulatory documents would have to be revisited, revised, and republished. These documents would have to be expanded to give new guidance to practitioners on how to navigate climate model and future greenhouse gas emission uncertainties, factors not present in the historical Climate Zones map.
So, we would very much like to hear from you. Specifically:
- Would you like to see this product developed and made available on ClimateData.ca?
- Are you likely to use this information to voluntarily make climate-informed decisions?
- What other barriers to adaptation do you think exist, which may prevent this information from being most useful?
- Do you think national codes and standards are likely to adopt new future-shifted Climate Zones in the near future?
Please take the time to send us an email with your opinions, and share this brief with your colleagues.