Drought and Agriculture

Society, the economy and environment depend on a sufficient supply of water within an expected range, which can be seriously threatened by drought. Droughts result from a shortage of precipitation, which may be exacerbated by failing to meet evapotranspiration demand. This case study presents information about historical droughts, possible future droughts, and explores adaptation strategies.

Credits: Researched and written by: Elaine Wheaton and Elaine Barrow. Collaborators: Barrie Bonsal, Dave Sauchyn, Christey Allen, Anne Blondlot, Stephen Sobie.

Summary

Society, the economy and environment depend on a sufficient supply of water within an expected range, which can be seriously threatened by drought.  Droughts result from a shortage of precipitation, which may be exacerbated by failing to meet evapotranspiration demand1. This case study presents information about historical droughts, possible future droughts, and explores adaptation strategies.

Droughts can cause much damage, especially to sensitive sectors such as agriculture. We focus on drought effects on agriculture, including effects on production and water supplies. Agricultural losses occur directly to crops and livestock and occur indirectly through problems of insects, diseases, soils and weeds as well as impacts on human and livestock health. The costs of drought can exceed billions of dollars in Canada.

Background

An example of a very severe drought was the one that swept across Canada during 1999-2005 and caused considerable agricultural, environmental, economic, and societal damages2.  The extent of this drought was massive, reaching from British Columbia across Canada to the Atlantic provinces and also farther northward than other major droughts. The greatest intensity was concentrated in Saskatchewan and Alberta. The economic impact of the core of the drought in 2001-2 was a drop of almost $6 Billion in Canada’s GDP.  Agricultural production losses during that drought were almost $3 Billion in the Canadian Prairie Provinces3.

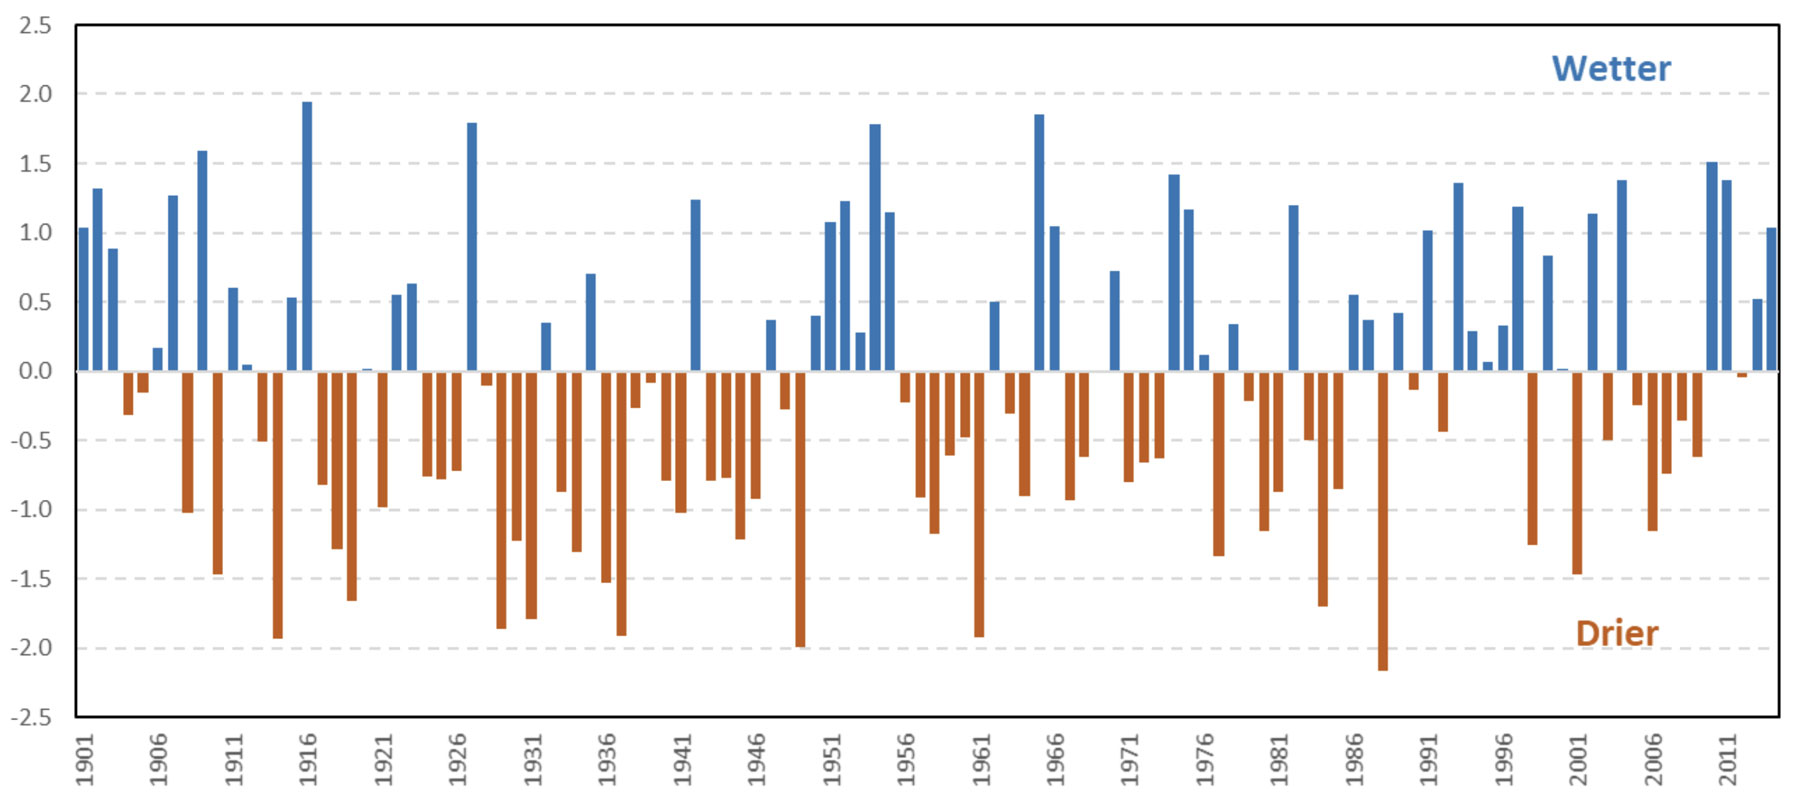
Many other significant droughts have occurred in Canada, especially in the prairies.  At least ten severe droughts have struck including those in 1910-11, 1914-15, 1917-20, 1928-30, 1931-32, 1936-38, 1948-51, 1960-62, 1988-89, and 2001-032,4 (Figure 1). These multi-year and large area droughts cause much more damage than shorter droughts and present greater challenges for adaptation. Several more recent droughts have also been documented. The extreme drought of 2015 in British Columbia, Alberta and Saskatchewan is notable as it has been partly attributed to climate change5. Droughts can cover large areas not only in Canada, but also across large parts of North America and elsewhere, and have been very intense and long lasting3.

Drought can be categorized into several types, such as meteorological, agricultural, hydrological, and socio-economic droughts6, because drought has impacts on so many systems. Meteorological droughts are determined by the degree, duration and other characteristics of the dry weather period. Agricultural droughts link the meteorological droughts to agricultural impacts, accounting for soil and plant properties, for example. Hydrological droughts are related to the effects of dryness on surface and ground-water supplies. Socioeconomic drought connects these other types of drought with their economic consequences.

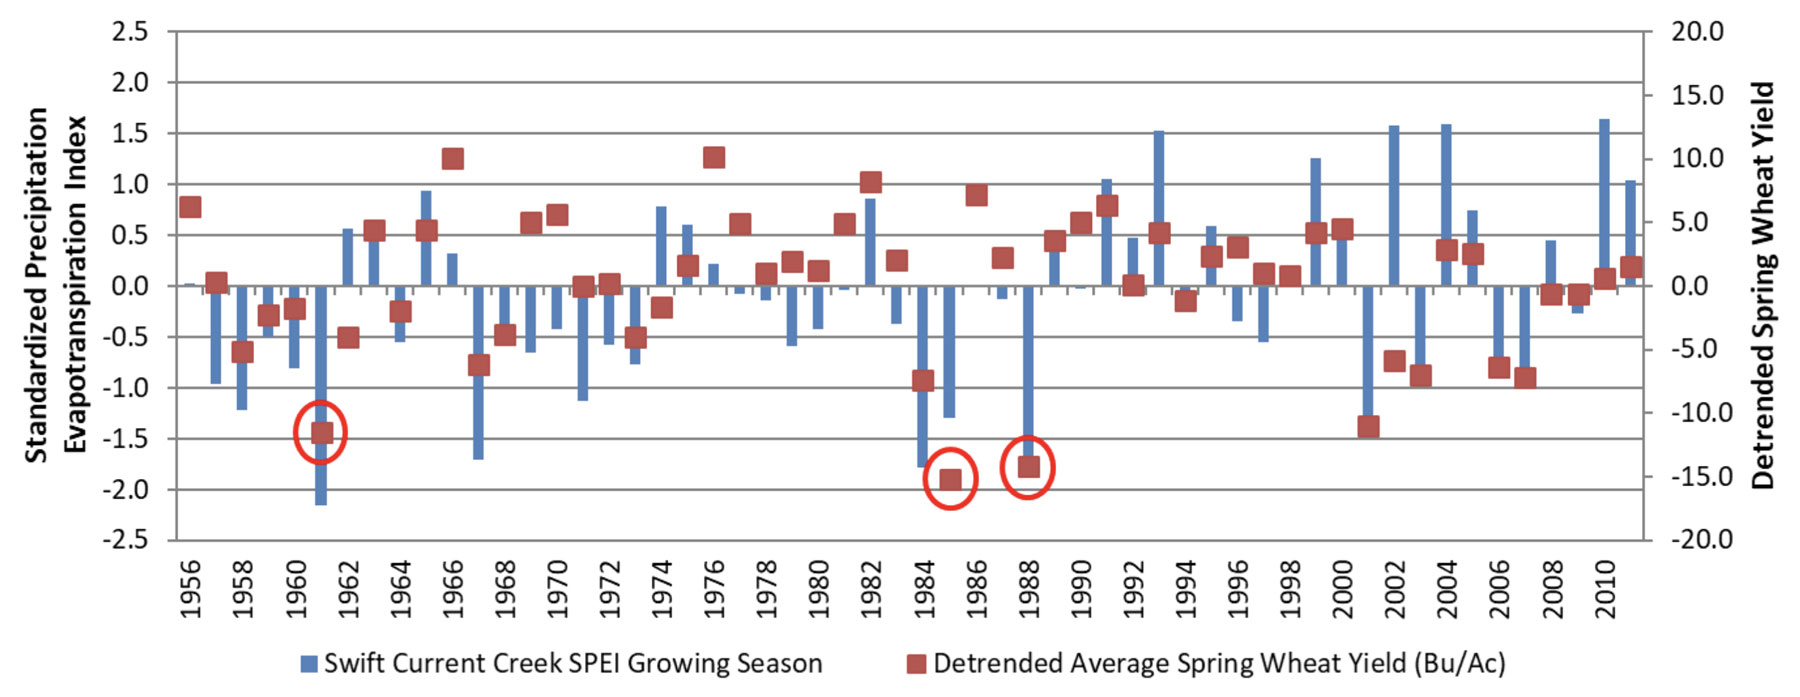
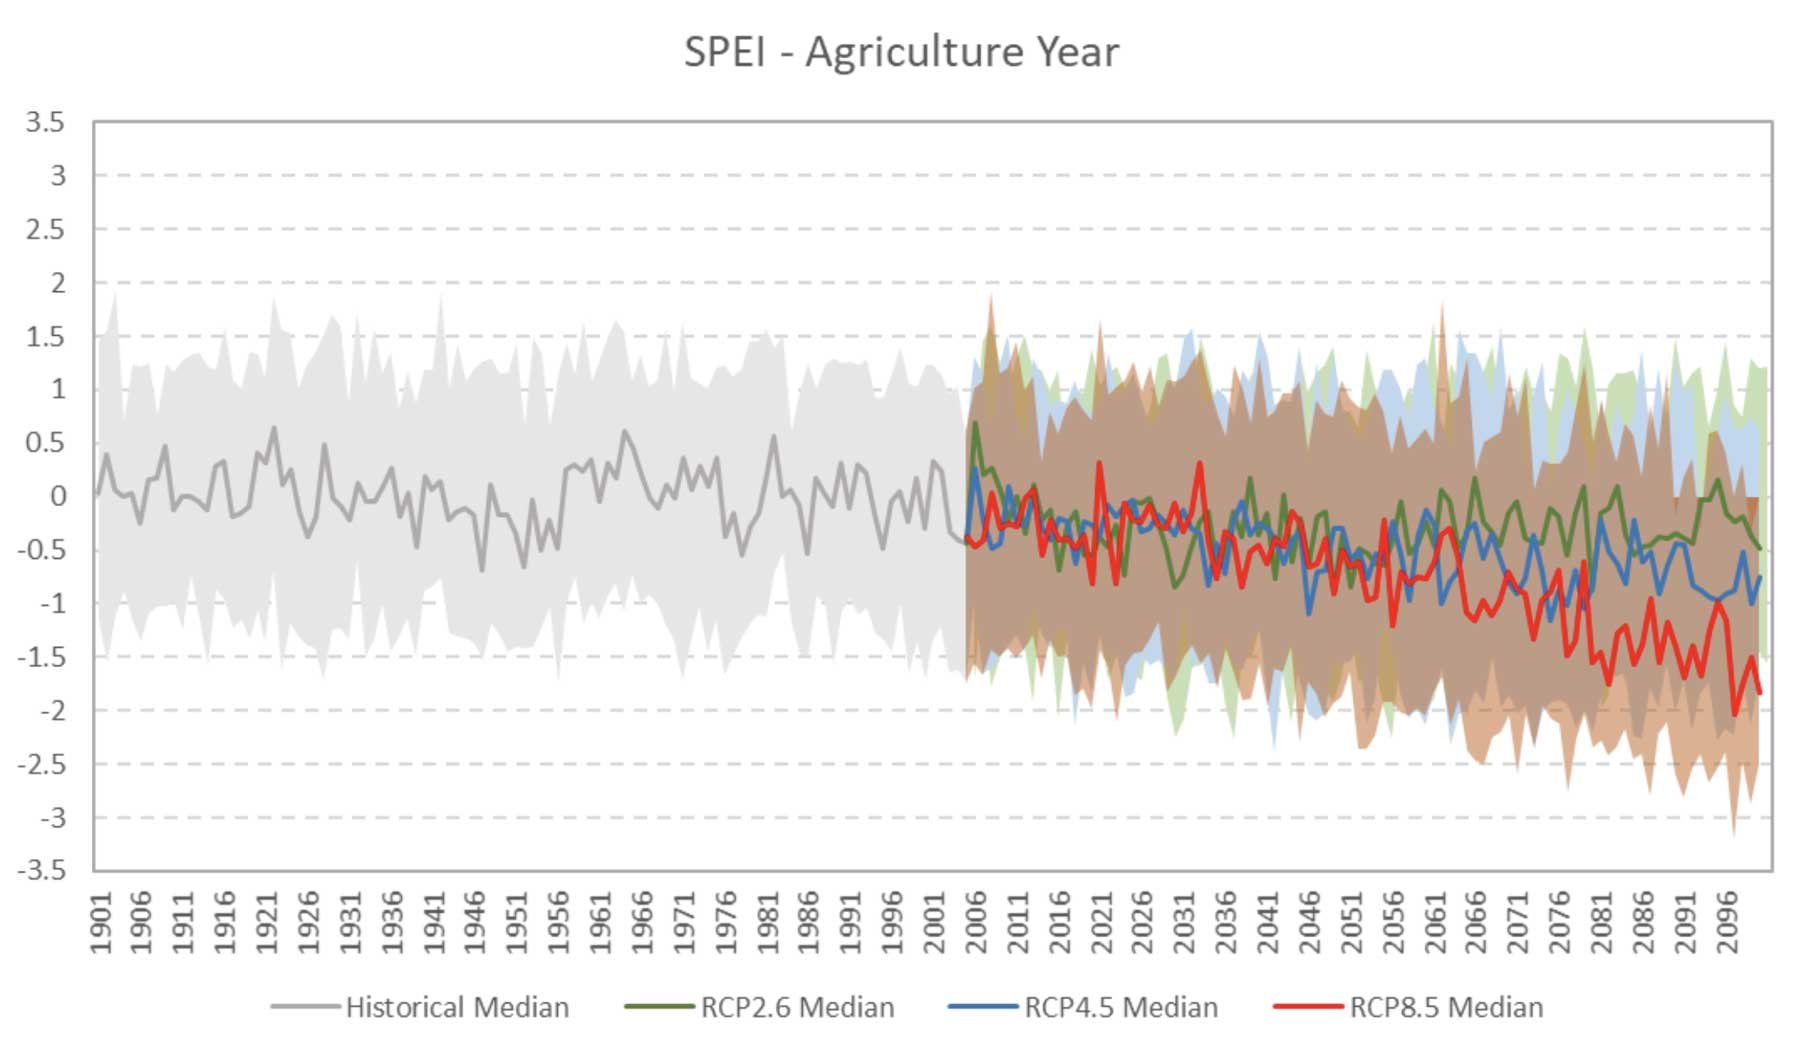
Several measures of drought are in use, including the Standardized Precipitation Evapotranspiration Index (SPEI)7. The SPEI is a relatively simple index based on the water balance equation (precipitation minus potential evapotranspiration) which can be used to calculate drought at many time scales (e.g., one, three, six, nine and twelve months) for the historical period as well as for the future (using climate model output). Since this index includes potential evapotranspiration, the effects of projected increases in temperature in the future can also be included.

Figure 1: Tracking droughts through the past using SPEI.

This chart illustrates SPEI for the period 1901-2014, for a 1 x 1 degree grid box in the Swift Current (Saskatchewan) area

Data source: Tam et al. (2018)

Climatic variability drives much of the year-to-year changes in agricultural production, especially in the Canadian prairies. Crops can fail in drought years and yields usually increase in wet years, unless moisture is excessive and/or agricultural land is flooded. For example, the drought years of 1961, 1985, and 1988 had the lowest average spring wheat yields for the Swift Current Creek Watershed in Saskatchewan (Figure 2)8. Water supplies for irrigation, livestock, homes, and many other uses become scarce during droughts.

Figure 2: Comparing spring wheat yield anomalies and growing season SPEI (May to August), Swift Current Creek Watershed

Red circles indicate the drought years with the lowest spring wheat yields.

Source: Wittrock V, Wheaton E, Bonsal B, Vanstone J. (2014): Connecting Climate and Crop Yields: Case Studies of the Swift Current Creek and Oldman River Watersheds. Prepared for the Vulnerability and Adaptation to Climate Extremes in the Americas Project (VACEA), Prairie Adaptation Research Collaborative, Regina, SK. SRC# 13224-2E13, Saskatchewan Research Council, Saskatoon, SK. 33 pp.

What are the Future Possible Drought Threats?

A general increasing risk of drought is expected with a warming climate for the southern Canadian prairies, despite projected increases in precipitation in some areas and seasons9. More intense and larger area droughts with increased variability are projected9,10,11,12,13. Increased drying trends are documented, especially for the Prairies, that become more dominant during the 2050s (Figures 3 and 4) and with higher emission scenarios because of higher temperatures and longer warm seasons. The severe infamous droughts of the “dirty 30s”, early 1960s, 1980s and early 2000s may pale in comparison with future droughts.

Tree-ring reconstructions of droughts that occurred hundreds of years before the instrumental period, indicate mega-droughts that were longer-lasting and more intense than the droughts of the 1930s14. Similar droughts to those mega-droughts of long ago could re-occur and could be even more severe with global warming10.

Figure 3: Spatial patterns of future possible SPEI for the agricultural year (Sep to Aug), RCP8.5, median of 29 climate models.

Decade
Opacity

Figure 4: Climate model-simulated SPEI (from an ensemble of 29 climate models) for the historical (1901-2005) and future (2006-2100) time periods for a 1 x 1 degree grid box in the Swift Current (Saskatchewan) area.

Bold coloured lines represent median values for the historical period (grey) and each RCP (2.6 – green; 4.5 – blue; 8.5 – red), while the correspondingly shaded areas are bounded by 10th and 90th percentile values for the historical period and each RCP.

Data Source: Tam BY, Szeto K, Bonsal B, Flato G, Cannon AJ, Rong R. (2018): CMIP5 drought projections in Canada based on the Standardized Precipitation Evapotranspiration Index. Canadian Water Resources Journal 44: 90-107

The growing probability of drought means increasing problems for agriculture and many other sectors. Droughts cause reduced crop and pasture yields, crop failures, and scarcity of water supplies, even with the more advanced technologies and management of recent years. Unexpected events are also more possible with shifting climate zones or the combination of threats, for example, of drought, heat waves and other extremes. This emphasizes the need for even more improved adaptation strategies, discussed in the following section. In comparison, flooding also reduces production, but the effects occur in smaller areas and exist for shorter times. Even though the projections of some future crop yields are higher15,16 drought years and other climate extremes would tend to wipe out some of this benefit as well as threaten the sustainability of water supplies and food security.

Adaptation Strategies

Drought is a very difficult hazard to deal with as it begins in a creeping fashion with a few very nice sunny dry days and may end suddenly with intense rains, for example, or gradually with lasting impacts. The dry conditions can persist over a long time, even years, and intensify over large areas. This makes adaptation most difficult and costly or perhaps even impossible. Although many strategies can be used to adapt to drought, it is still very challenging, especially for the intense, long duration, and large area droughts that pose limits to adaptation and require high degrees of innovation and cost.

Main categories of agricultural adaptation options include technology, government programs and insurance, farm production practices and financial management17. Managing drought risk is part of the management of agro-climatic risk. Information on practices of several types exist, including those for crops, pest management, water supplies18 as well as for livestock, soils, inputs, fire risk management19 and diversification20. For crops, examples of practices include seeding earlier, and using drought-tolerant species and varieties. Conservation and minimum tillage, water conservation and many other best management practices are also recommended. Delivering adaptation measures is facilitated by improving capacities such as by strengthening institutions, expertise, research and infrastructure21.

Monitoring, planning, responses, and early warnings are required to reduce vulnerability, negative impacts and improve preparedness and resilience. Enhanced understanding of current and future possible droughts and impacts is required for improved adaptation22. The Canadian Drought Monitor is the official source for drought monitoring and reporting in Canada23.  This interactive application as well as data from ClimateData.ca can be used to assess drought conditions across Canada. The prairie provinces have developed drought plans, however monitoring and assessment requires additional coordination, resources and expertise.

Key Takeaways

  • Droughts pose enormous threats to sensitive sectors such as agriculture, as well as most other parts of the economy, environment and society. Droughts are one of the trickiest hazards to understand and require significant adaptation.
  • Droughts are projected to increase in frequency, intensity and area with a changing climate and increasingly severe impacts.
  • Agricultural producers are adaptable, and significant damage and costs can be reduced by enhanced adaptive strategies. These include better monitoring (e.g., using SPEI), preparations, warnings, forecasting, advanced climate-smart agriculture and best management practices.

References

  1. World Meteorological Organization (WMO). 2018. Report on Drought Expert Team 3.1. Howard A, Biettio L, Hayes M, Kleschenko A, Caina K, Susnik A. WMO Commission on Agrometeorology, Geneva, Switzerland. Online: http://www.wmo.int/pages/prog/wcp/agm/cagm/opcames/documents/WMOCAgMExpertTeam3-1DraftReport.pdf on 18 May 2020.
  2. Bonsal B, Wheaton E, Chipanshi A, Lin C, Sauchyn D, Wen L (2011): Drought Research in Canada: A Review. Atmosphere-Ocean 49(4): 303-319. https://doi.org/10.1080/07055900.2011.555103
  3. Wheaton E, Kulshreshtha S, Wittrock V, Koshida G. (2008): Dry times: hard lessons from the Canadian drought of 2001 and 2002. The Canadian Geographer 52(2): 242-262.
  4. Maybank, J, Bonsal B, Jones K, Lawford R, O’Brien E, Ripley E, Wheaton E. (1995): Drought as a natural disaster. Atmosphere-Ocean 33(2): 195-222.
  5. Szeto K, Zhang X, White R, Brimelow J. (2016): The 2015 extreme drought in Western Canada. In: Herring S, Hoell A, Hoerling M, Kossin J, Schreck III C, Stott P. (Editors). Explaining extreme events of 2015 from a climate perspective. Special Supplement to the Bulletin of the American Meteorological Society 97(12), p. S42-46.
  6. Wilhite D. (2000): Forward. In: Wilhite D. (Editor). Drought: A Global Assessment. Vol. 1. Routledge, London. 396pp.
  7. Vicente-Serrano SM, Beguería S, Lopez-Moreno JI (2010): A multi-scalar drought index sensitive to global warming: the Standardised Precipitation Evapotranspiration Index. Journal of Climate 23(7): 1696-1718.
  8. Wittrock V, Wheaton E, Bonsal B, Vanstone J. (2014): Connecting Climate and Crop Yields: Case Studies of the Swift Current Creek and Oldman River Watersheds. Prepared for the Vulnerability and Adaptation to Climate Extremes in the Americas Project (VACEA), Prairie Adaptation Research Collaborative, Regina, SK. SRC# 13224-2E13, Saskatchewan Research Council, Saskatoon, SK. 33 pp.
  9. Tam B, Szeto K, Bonsal B, Flato G, Cannon AJ, Rong R (2018): CMIP5 drought projections in Canada based on the Standardized Precipitation Evapotranspiration Index, Canadian Water Resources Journal, 44, 90-107.
  10. Bonsal BR, Aider R, Gachon P, Lapp S. (2013): An assessment of Canadian prairie drought: past, present, and future. Climate Dynamics 41: 501-516.
  11. Bonsal B, Cuell C, Wheaton E, Sauchyn D, Barrow E. (2017): An Assessment of Historical and Projected Future Hydro-climatic Variability and Extremes over Southern Watersheds in the Canadian Prairies. International Journal of Climatology DOI: 10.1002/joc.4967.
  12. PaiMuzumber D, Sushama L, Laprise R, Khaliq M, Sauchyn D. (2012): Canadian RCM projected changes to short- and long-term drought characteristics over the Canadian Prairies. International Journal of Climatology 33(6): 1409-23, doi:10.1002/joc.3521.
  13. Dibike Y, Prowse T, Bonsal B, O’Neil H. (2017): Implications of future climate on water availability in the western Canadian river basins. International Journal of Climatology 37: 3247-3263.
  14. Sauchyn D, Kerr S. (2016): Canadian Prairies drought from a paleoclimate perspective. In: Diaz H,  Hurlbert M, Warren J. (Eds.) Vulnerability and Adaptation to Drought, the Canadian Prairies and South America (Chapter 2). University of Calgary Press, Calgary, AB.
  15. Qian B, Jing Q, Belanger G, Shang J, Huffman T, Liu J, Hoogenboom G. (2018): Simulated canola yield responses to climate change and adaptation in Canada. Agronomy Journal 110 (1): 14 p.
  16. Qian B, Wang H, He Y, Liu J, De Jong R. (2016): Projecting spring wheat yield changes on the Canadian Prairies: effects of resolutions of a regional climate model and statistical processing. International Journal of Climatology 36(10): 3492-3506. doi:10.1002/joc.4571
  17. Smit B, Skinner M. (2002): Adaptation options in agriculture to climate change: a typology. Mitigation and Adaptation Strategies for Global Change 7: 85-114.
  18. Agriculture and Agri-Food Canada (2020): Managing Agroclimate Risk. Online: http://www.agr.gc.ca/eng/agriculture-and-climate/drought-watch/managing-agroclimate-risk/?id=1463575241811
  19. Food and Agriculture Organization (FAO) (2007) Adaptation to climate change in agriculture, forestry, and fisheries: Perspective, framework and priorities. Rome, United Nations.
  20. Poudel S, Kulshreshtha S, Wheaton E. (2017): The Economic Impacts of Climate Change and Climatic Extremes on the Mixed Farms of the Canadian Prairie. The International Journal of Climate Change: Impacts and Responses 9(4). DOI: 10.18848/1835-7156/CGP/v09i04/35-52.
  21. Kulshreshtha S, Wheaton E. (2013): Climate Change and Canadian Agriculture: Some Knowledge Gaps. International Journal of Climate Change: Impacts and Responses 4(2): 127-148.
  22. Wheaton E. (2015):  Droughts challenge water resource management and policy. Living with Less Water. Conference proceedings. Institute on Science for Global Policy, Tucson, Az.
  23. Agriculture and Agri-Food Canada (2020): Canadian Drought Monitor. Online: http://www.agr.gc.ca/eng/agriculture-and-climate/drought-watch/canadian-drought-monitor/?id=1463575104513

Related Variables

Explore variables to learn about how data was used to impact climate related decisions in specific contexts.

Days with Tmax > 25°C describes the number of days where the daytime high temperature is warmer than 25°C. This index gives an indication of number of summer days in the selected time period.

High temperatures are important. They determine if plants and animals can thrive, they limit or enable outdoor activities, define how we design our buildings and vehicles, and shape our transportation and energy use. However, when temperatures are very hot, people – especially the elderly – are much more likely to suffer from heat exhaustion and heat stroke. Many outdoor activities become dangerous or impossible in very high temperatures.

Technical description:

The number of days with a maximum temperature (Tmax) greater than 25°C. Use the Variable menu option to view annual, monthly or seasonal values for this index.


Days with Tmax > 27°C describes the number of days where the daytime high temperature is warmer than 27°C.

High temperatures are important. They determine if plants and animals can thrive, they limit or enable outdoor activities, define how we design our buildings and vehicles, and shape our transportation and energy use. However, when temperatures are very hot, people – especially the elderly – are much more likely to suffer from heat exhaustion and heat stroke. Many outdoor activities become dangerous or impossible in very high temperatures.

Technical description:

The number of days with a maximum temperature (Tmax) greater than 27°C. Use the Variable menu option to view annual, monthly or seasonal values for this index.


Days with Tmax > 29°C describes the number of days where the daytime high temperature is warmer than 29°C.

High temperatures are important. They determine if plants and animals can thrive, they limit or enable outdoor activities, define how we design our buildings and vehicles, and shape our transportation and energy use. However, when temperatures are very hot, people – especially the elderly – are much more likely to suffer from heat exhaustion and heat stroke. Many outdoor activities become dangerous or impossible in very high temperatures.

Technical description:

The number of days with a maximum temperature (Tmax) greater than 29°C. Use the Variable menu option to view annual, monthly or seasonal values for this index.


Days with Tmax > 30°C describes the number of days where the daytime high temperature is warmer than 30°C. This index gives an indication of number of hot days in the selected time period.

High temperatures are important. They determine if plants and animals can thrive, they limit or enable outdoor activities, define how we design our buildings and vehicles, and shape our transportation and energy use. However, when temperatures are very hot, people – especially the elderly – are much more likely to suffer from heat exhaustion and heat stroke. Many outdoor activities become dangerous or impossible in very high temperatures.

Technical description:

The number of days with a maximum temperature (Tmax) greater than 30°C. Use the Variable menu option to view annual, monthly or seasonal values for this index.


Days with Tmax > 32°C describes the number of days where the daytime high temperature is warmer than 32°C. This index gives an indication of number of very hot days in the selected time period.

High temperatures are important. They determine if plants and animals can thrive, they limit or enable outdoor activities, define how we design our buildings and vehicles, and shape our transportation and energy use. However, when temperatures are very hot, people – especially the elderly – are much more likely to suffer from heat exhaustion and heat stroke. Many outdoor activities become dangerous or impossible in very high temperatures.

Technical description:

The number of days with a maximum temperature (Tmax) greater than 32°C. Use the Variable menu option to view annual, monthly or seasonal values for this index.