Pavement and Extreme Temperatures in the City of Toronto

Climate risk assessments conducted in the City of Toronto identified extreme heat as one critical climate change risk for transportation infrastructure. Read on to learn more about the steps the City is taking to account for this risk in road pavement design.

Contributing Authors: Elaine Barrow, Nathalie Bleau, Jessie Booker, Taylor Livingston, Lindsay Matthews, Stacey O'Sullivan, Amanda Patt, Kari Tyler.

Summary

Pavement in Toronto has been failing to meet expected operational lifetimes. Problems with pavement wear caused by heat and heavy traffic were already an issue. With observed and expected increasing temperatures, and increasing extreme temperatures, the City of Toronto identified that pavement deterioration would only get worse if pavement design continued to be based on historical temperatures.

The City’s climate change risk assessment identified the bump-up of pavement performance grades (PGs) as a proactive approach to adapt to increasing temperatures anticipated in the 2030 and 2050 time horizons.

Background

The City of Toronto road network consists of approximately 5,600 kilometres of road and over 300 kilometres of laneways.1 In 2016, the City of Toronto evaluated the resiliency of City infrastructure to future extreme weather using high level risk assessments.2 The most critical climate change risk events for transportation infrastructure were found to be extreme rain in the downtown core and extreme heat, city-wide.2

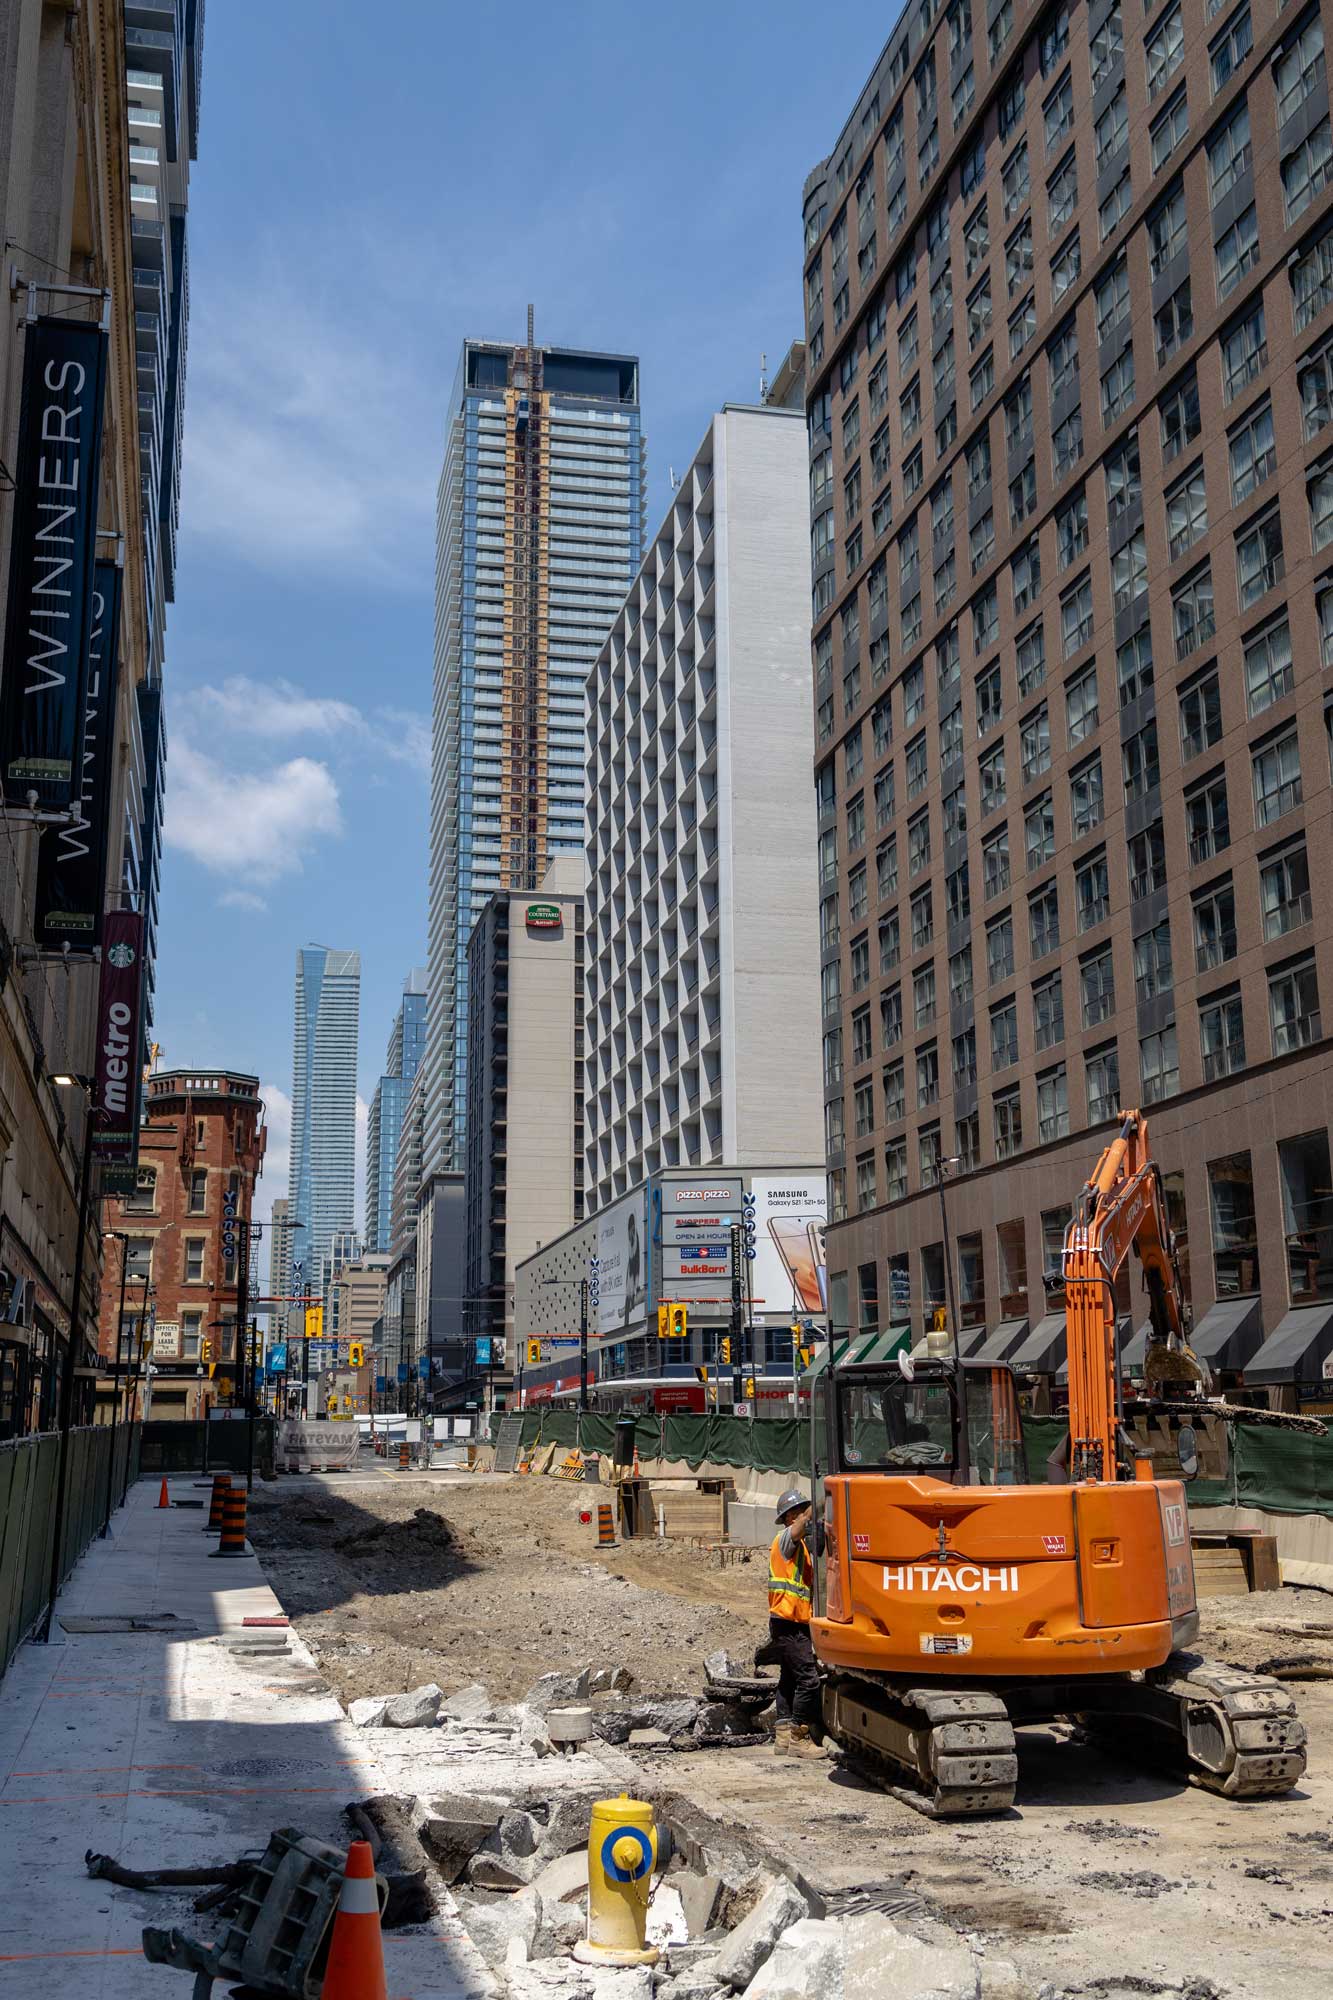
Extreme heat causes asphalt pavements to soften and lose strength, which results in rutting under heavy vehicles and binder bleeding from the surface. In the event of an extended heat wave, there could be widespread pavement damage. Linear rutting along the wheel path area of roads could result in the ponding of water and hydroplaning accidents. When the pavement surface is irregular it may also result in more vehicle and bicycle accidents. The cost to repair widespread deformed pavement could be very high. Existing infrastructure, especially for the downtown core, was constructed many years ago and was not designed to accommodate today’s extreme weather events.2 With extreme heat, pavement lifespans may be reduced to less than the expected 15-25 year operational life without resurfacing.

The combination of extreme heat with other climate variables, such as heavy precipitation events and freeze-thaw cycles, increases its impact on pavement lifespans. As these other variables are also either increasing or persisting in frequency and severity due to climate change, their compounding effects on pavement wear will become more significant. While Toronto’s risk assessment process considered these various factors, this case study will focus solely on extreme heat risks and accompanying adaptation strategies.

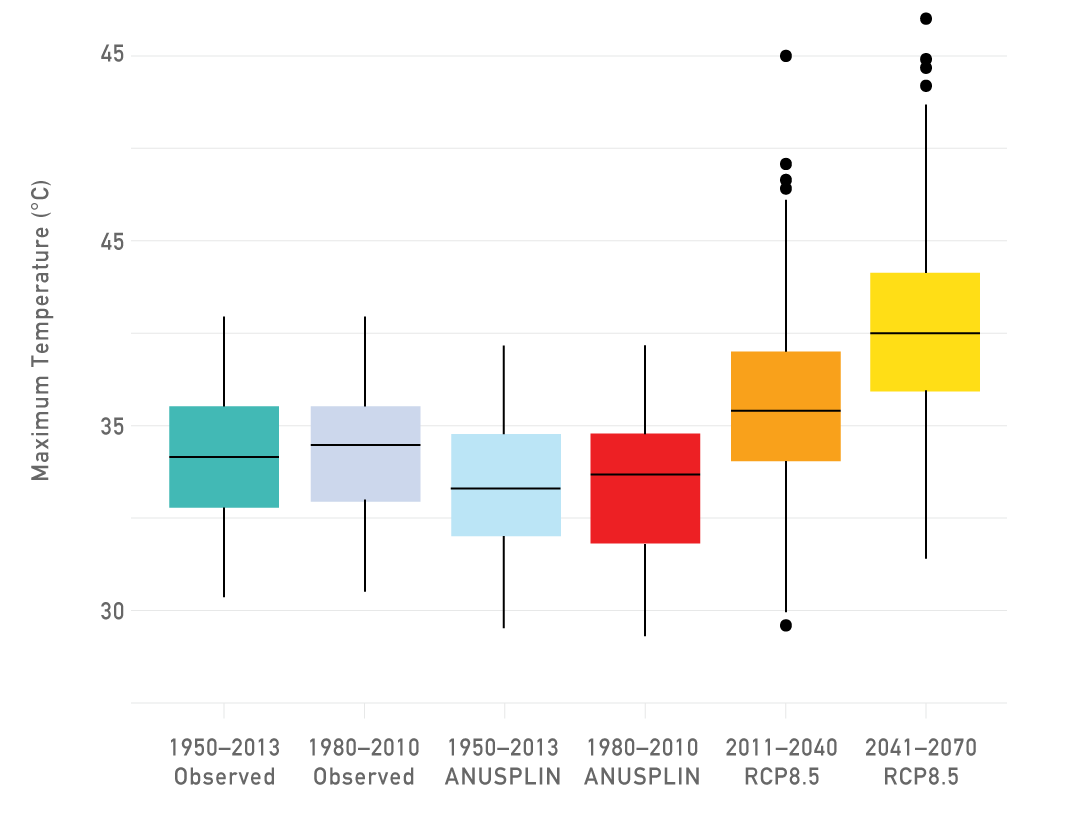
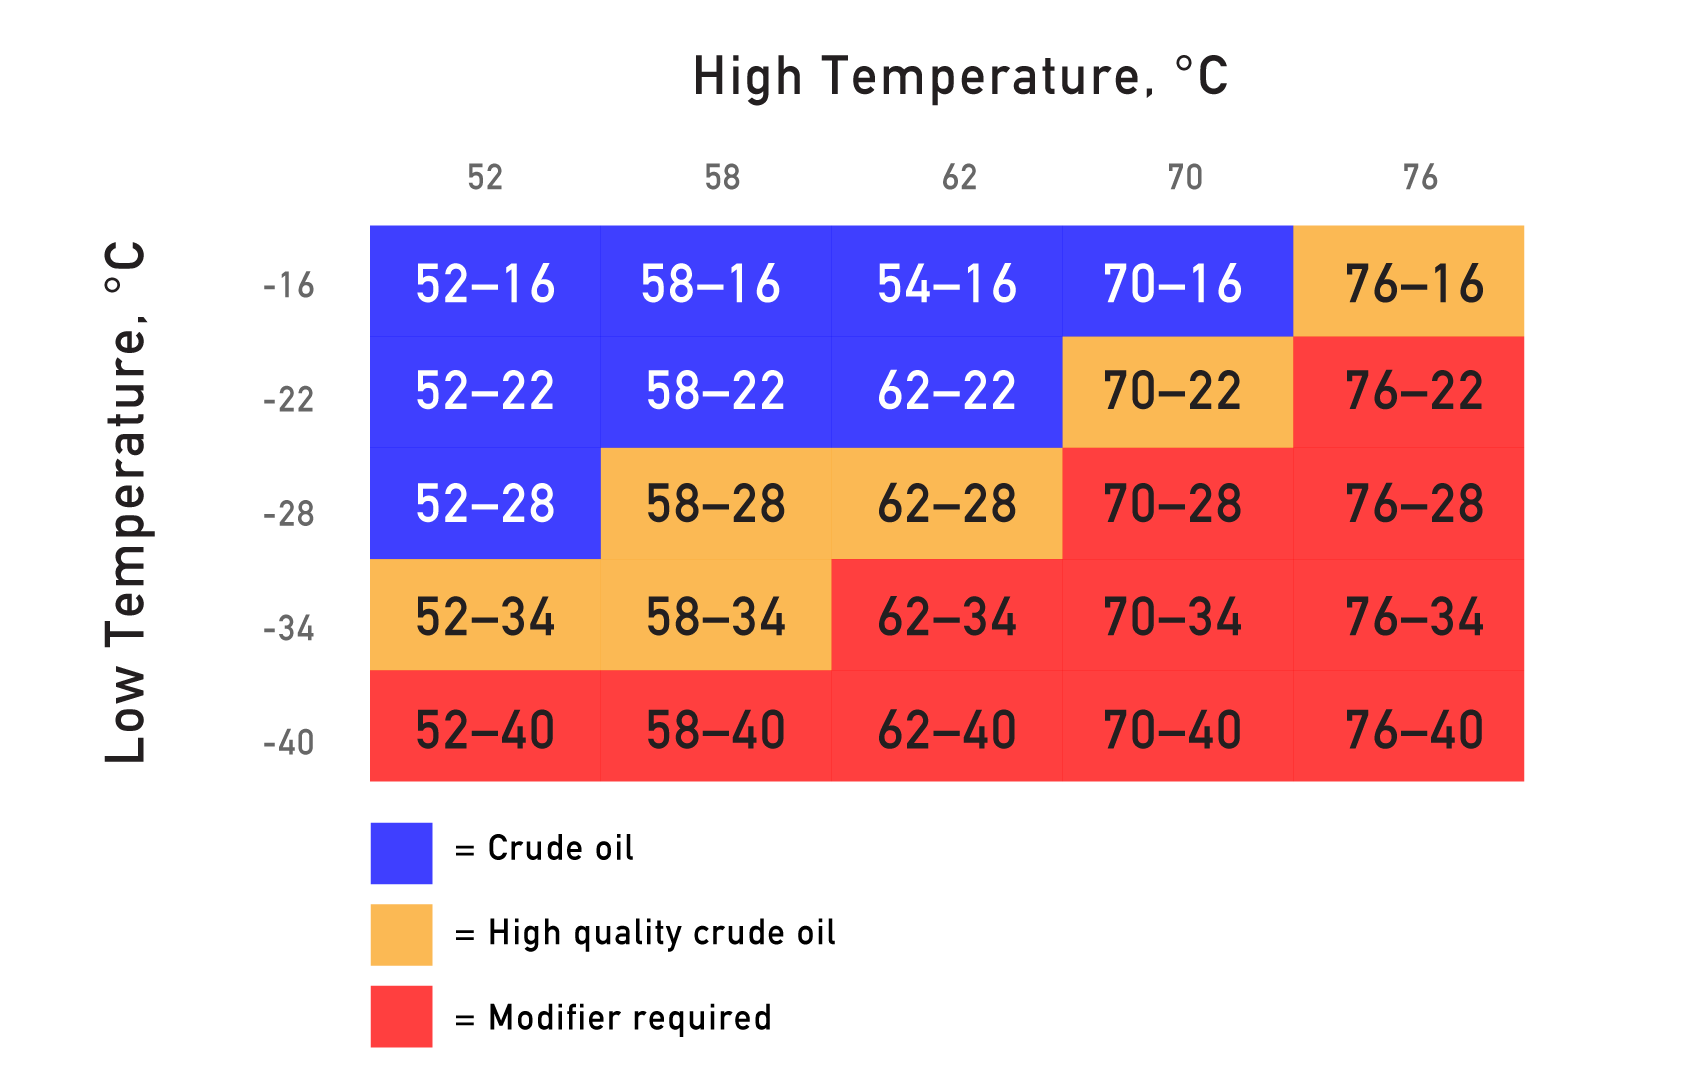
One way of improving the resiliency of road infrastructure is to use pavement binders that are designed specifically to prevent premature pavement wear. The Superpave formula is used by some road authorities to determine pavement binder (extra crude oil and modifying compounds) performance grades (PGs). Usually PGs are based on historical climate data; however, considering future climate data will help ensure the use of road materials that will be resilient into the future.

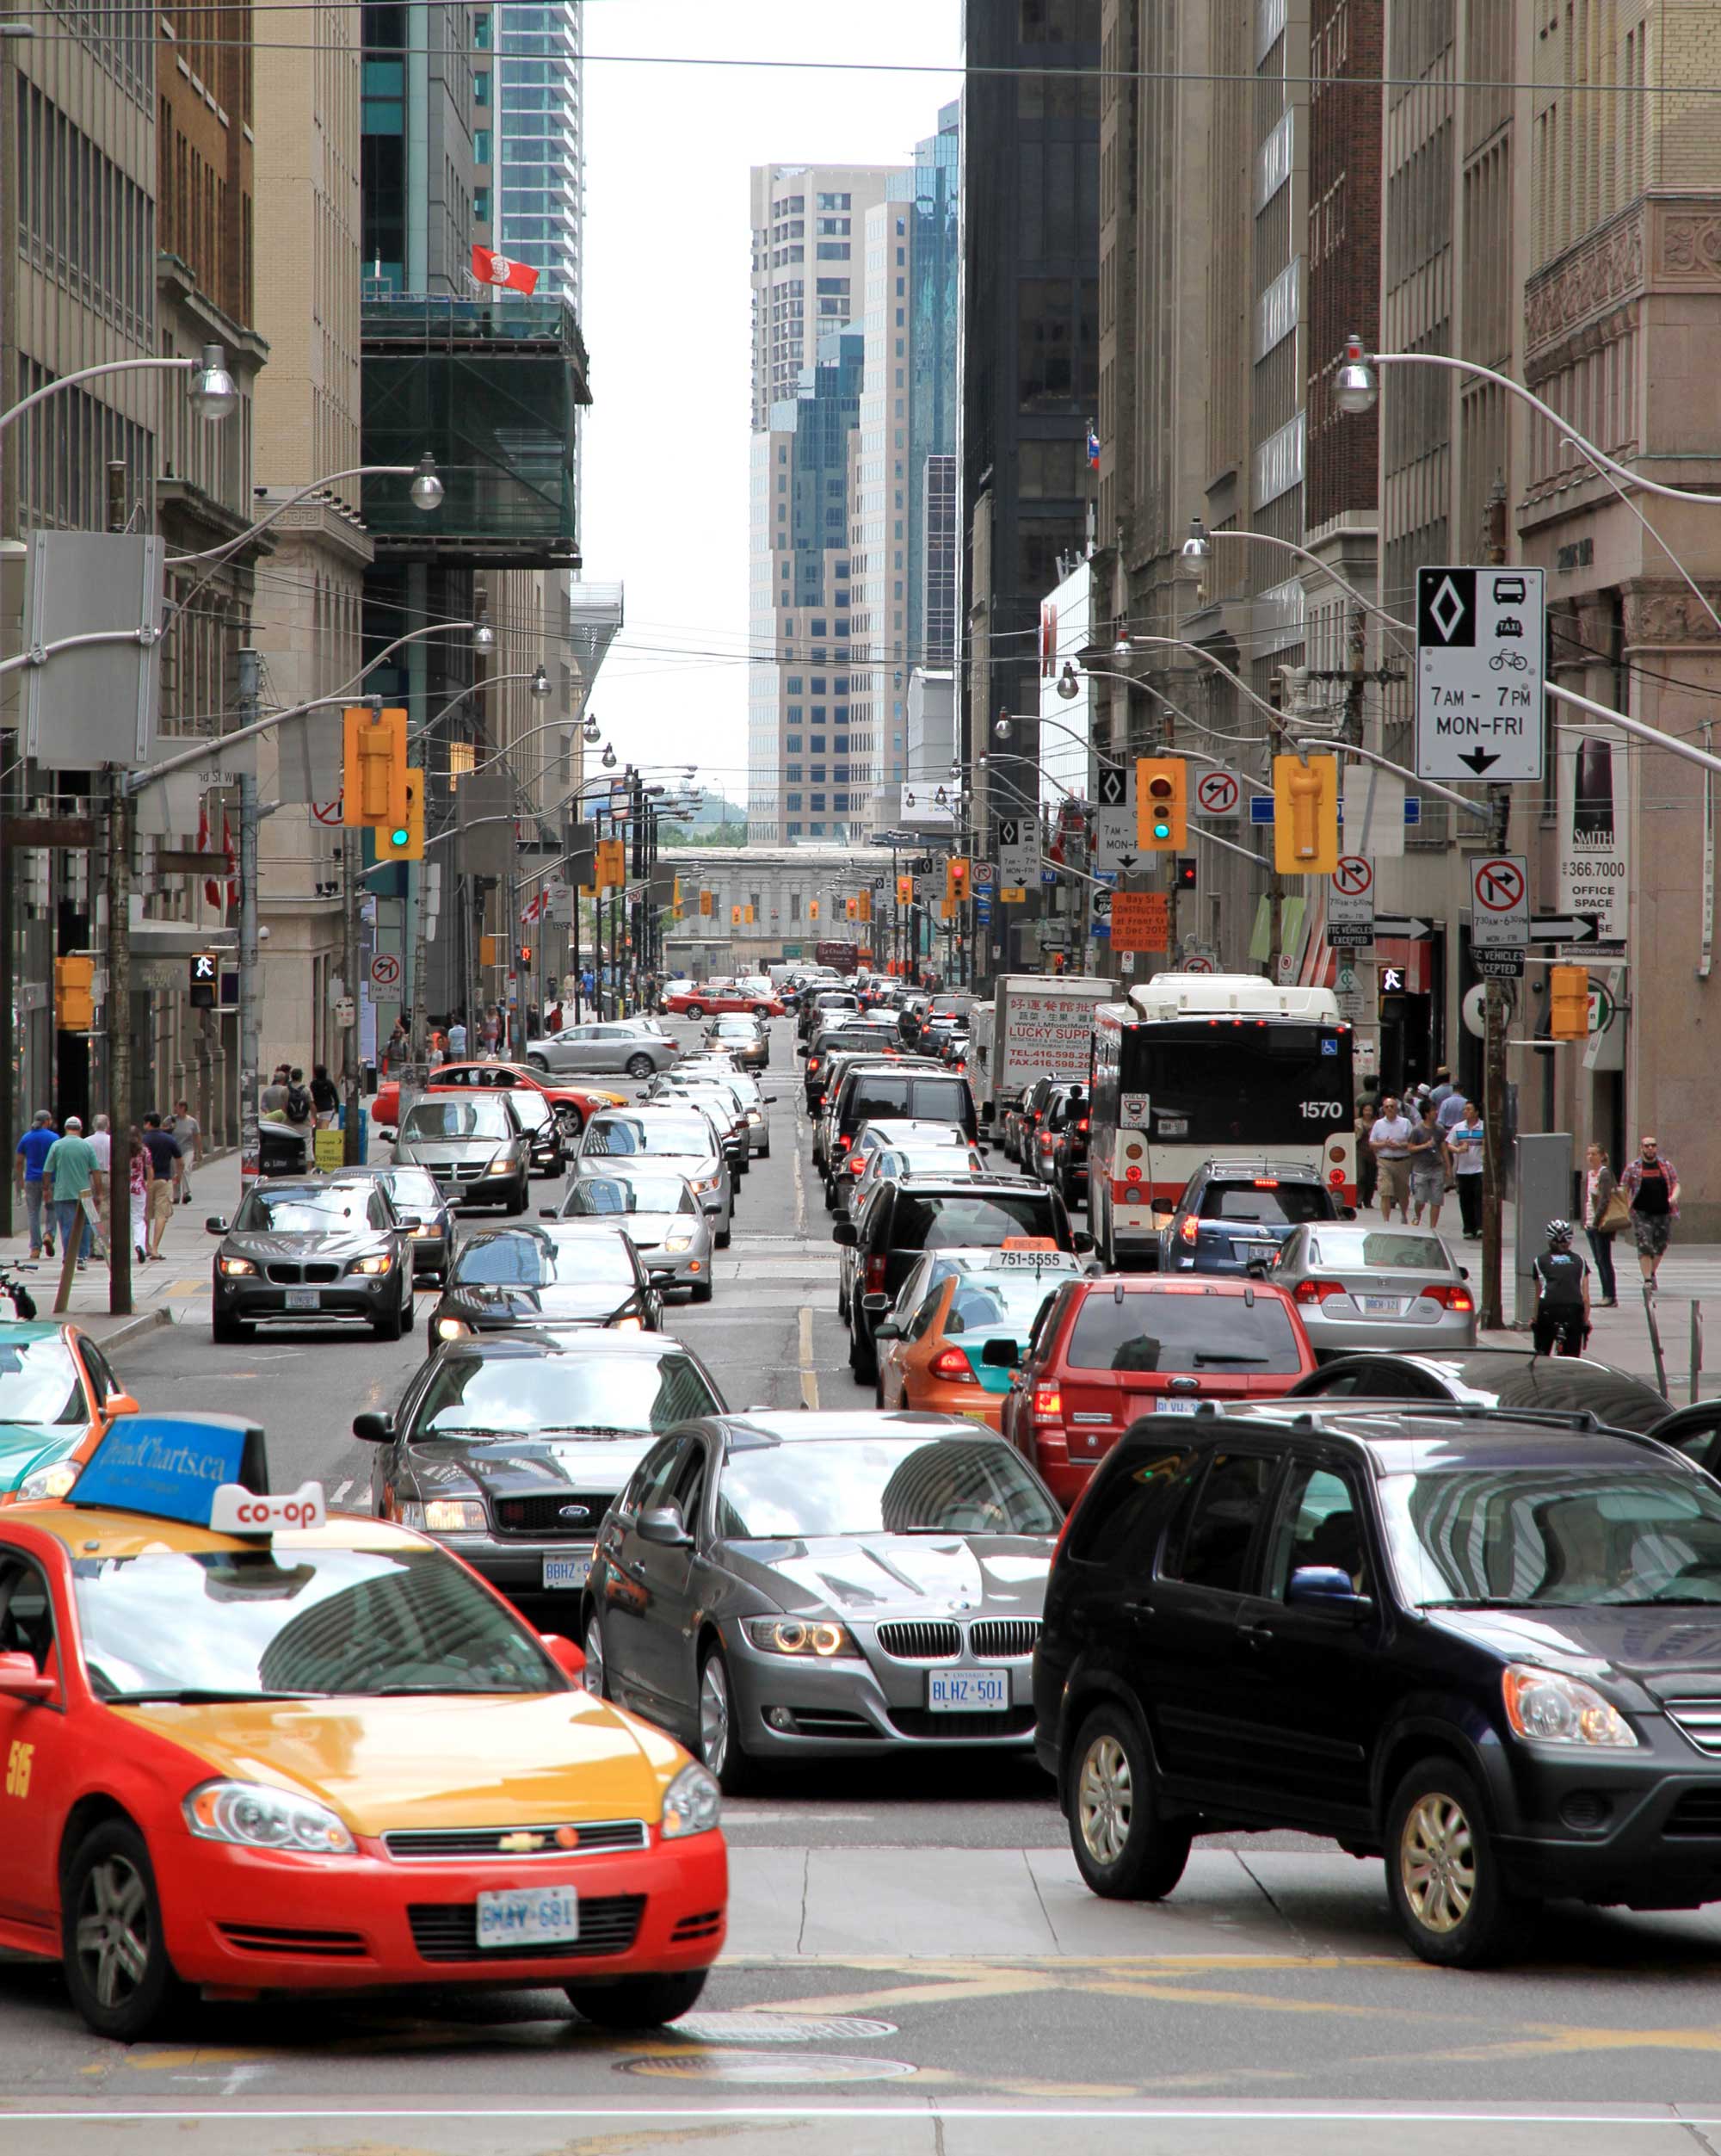
In our current climate, road pavements in Toronto are not meeting their expected operational lifespans. Problems with pavement wear caused by heat and heavy traffic are already an issue. With observed and expected increasing temperatures, and increasing extreme temperatures, pavement wear will only worsen if pavement design continues to be based on historical temperatures.

Adaptation Strategies

It has already been observed that pavements are not meeting their expected operational lifetimes, and that heat has been identified as one of the contributors. To better understand how hot days in Toronto have already become hotter and how this trend will continue throughout the century, we can look at the data for the annual values for the Hottest Day in Toronto, along with the Heat Wave option on the Analyze tab.

On reviewing the Hottest Day variable (Figure 1), we can see below that the observed range was between 31⁰C and 38⁰C historically, and that the median maximum temperature for the hottest day was slightly warmer in the most recent 1981-2010 climate normal period compared to the 1950-2013 period. The ANUSPLIN values (gridded historical data) for the hottest day are slightly lower than those of the weather station observations. This is not surprising and is due to a number of reasons, including the fact that the elevation of the grid box may not be exactly the same as the station location (which is a single point within the grid box).

It can be observed that regardless of the historical dataset used for comparison, the median values for Hottest Day under the high emissions scenario are projected to be significantly higher in the future. The hottest day in our modelled climate for the period 2011-2040 under RCP8.5 spans a wide range, from about 30⁰C to 45⁰C, with a median value of about 36⁰C. For the 2050s (2041-2070), the range is from approximately 32⁰C to 46⁰C, with a median value of about 37.5⁰C. Depending on the anticipated lifespan of infrastructure, it is typically best practice to design for the high emissions scenario (RCP8.5). The amount of climate change that would occur in the high emissions scenario by about mid-century is similar to what would occur under a mid-range scenario (RCP 4.5) later in the century. Thus, infrastructure designed with the high emissions scenario in mind will have greater resilience later in its design life even if emissions are reduced.

Figure 1. Future-projected values for Hottest Day in Toronto

Box and whisker plots of historical and future-projected values for Hottest Day in Toronto. Median values are indicated by black lines at the center of each box, with the minimum and maximum ranges indicated by the bottom and top “whiskers” of each box, respectively. Values which are greater or less than 1.5x the interquartile range are outliers and indicated by black dots.

This awareness of how much the hottest day of the year could warm through the decades gives some indication of the way extreme heat is changing in Toronto. This provides enough information to make the decision to bump-up the PGs, as discussed below, especially on roads with heavy vehicle traffic.

Another way to consider climate risks to pavements is to use the Analyze tab. The Analyze section allows you to select your grid cells, set your own thresholds for a variety of climate indices, and make choices about the number of climate models, RCPs, and percentiles you would like to use for your analysis. The Heat Wave option allows analysis using the number of days in a row above a threshold temperature. In the case of pavement weakness, the seven-day average maximum air temperature is used to calculate maximum pavement temperatures. This is because pavement temperatures are difficult to measure directly, but it is known that they are more extreme than air temperatures – up to 27-50oC hotter than air on a sunny day.3 Pavement temperatures used in the selection of PGs (Figure 2)4 are therefore estimated by using air temperatures (which are more readily available) within an algorithm in the Superpave formula. Given that pavement temperatures can be more extreme than air temperatures, the difference between maximum and minimum pavement temperatures can also be large. If the temperature differential between high and low design temperatures is greater than 90oC (Figure 2), then asphalt binder modification is typically required to meet stiffness requirements at both the high and low temperature extremes.5

The formula for paving mix is currently based on historical temperatures. PG 64-28 is the pavement grade typically specified in Toronto, but as Toronto experiences increasingly hot temperatures, a PG for higher temperatures should be used – especially on roads with heavy vehicle traffic. The City’s climate change risk assessment identified the bump-up of PGs to PG 70-28 as a proactive approach to adapt to the increasing temperatures anticipated in the climate of the 2030s and 2050s. The plan states that road designers may increase (or bump-up) the high temperature grade according to City specifications outlined in the 2019 “Pavement Design and Rehabilitation Guideline” document.Note that both PGs utilized in Toronto (PG 64-28 and now PG 70-28) would require modification due to the temperature differential discussed above.

Figure 2. Pavement PG selection based on expected pavement temperatures

Pavement performance grades (PGs) for different high (average seven-day maximum) and low (minimum likely to be experienced) pavement temperatures. PG binders with a spread of 90⁰C between high and low design temperatures generally require modification.

A lack of future climate data has previously been identified as a barrier for designers to recommend the bump-up of pavement grades for City infrastructure. ClimateData.ca can help fill this data gap and assist designers and City staff in the selection of the appropriate PGs based on anticipated future air temperature profiles.

Key Takeaways

  • Climate change is already contributing to increased pavement wear.
  • Climate change projections show that temperatures for the hottest day will continue to increase, which will worsen pavement deterioration unless design changes are implemented.
  • Given these changes, the City of Toronto identified the increase of pavement performance grades as a pro-active approach in anticipation of the warmer temperature profiles for the 2030 and 2050 time horizons.

Acknowledgements

The authors would like to express their sincere gratitude to Prabir Das and the City of Toronto for their invaluable contributions to this case study.

References

  1. City of Toronto. (2019). Pavement Design and Rehabilitation Guideline. Infrastructure Asset Management & Programming: Transportation Services Division. Toronto, ON. Available from: https://www.toronto.ca/wp-content/uploads/2019/04/9659-TS_Pavement-Design-and-Rehabilitation-Guideline.pdf
  2. City of Toronto (2016). Resilient City – Preparing for a Changing Climate Status Update and Next Steps. Toronto, ON. Available from: https://www.toronto.ca/legdocs/mmis/2016/pe/bgrd/backgroundfile-98049.pdf
  3. Climate Atlas of Canada. (n.d.) Urban Heat Island Effect. Available from: https://climateatlas.ca/urban-heat-island-effect
  4. Pavement Interactive. (n.d.) Superpave Performance Grading. Pavement Tools Consortium. Available from: https://pavementinteractive.org/reference-desk/materials/asphalt/superpave-performance-grading/
  5. Pavement Interactive. (n.d.) Asphalt Modifiers. Pavement Tools Consortium. Available from: https://pavementinteractive.org/reference-desk/materials/asphalt/asphalt-modifiers/