Permafrost in the Northwest Territories

Thawing permafrost, one serious result of rapid warming in Canada’s Arctic, is causing widespread impacts to northern infrastructure. Using a climate risk analysis protocol (the PIEVC Protocol), a risk assessment was undertaken to better understand the threat from permafrost degradation in the Northwest Territories.

Writing Credits: Leigh Phillips. Contributing Authors: Nathalie Bleau, Kenneth Chow, Charles Curry, Jeremy Fyke, Robert Lepage, Trevor Murdock, Stacey O'Sullivan, Dan Sandink, Ryan Smith, Kari Tyler.

Key Points

  • Climate change induced permafrost thaw will have major socioeconomic impacts on the built environment in Canada’s north.
  • Assessing risks from thawing permafrost at the local scale is difficult due to limited data availability and complex interactions between the different variables that influence permafrost breakdown.
  • Design criteria should follow a risk-based approach that incorporates degrees of uncertainty and ranges of data, rather than the traditional approach of adhering to fixed numerical thresholds.

According to a 2019 Environment and Climate Change Canada report, Canada is warming at twice the average global rate, while the Arctic is warming at three times that rate. In Canada’s north, many buildings and other infrastructure are built atop frozen ground that isn’t permanently frozen anymore. A 2017 analysis by the Northwest Territories Association of Communities put the annual cost associated with infrastructural impacts of thawing permafrost at $51 million, in a region with few financial resources compared to southern Canada. In the Yukon, thawing permafrost has compromised the structural performance of Dawson City’s recreation centre so severely that it forced the temporary closure of the centre in late 2017, and has created the need for an entirely new building in the near future. Many houses in the north (particularly in Nunavut, where permafrost is essentially continuous throughout the territory) have been built on the assumption that the frozen ground beneath them will remain solid – an assumption that can no longer be made.

In response to this threat, in 2019, the Northwest Territories’ Ministry of Municipal and Community Affairs tasked the professional services firm WSP with performing a screening-level risk assessment1 of the hazards posed by a changing climate (including thawing permafrost) across the territory, using the Public Infrastructure Engineering Vulnerability Committee (PIEVC) climate-risk analysis Protocol.

The team of climate scientists and engineers immediately ran into issues accessing the relevant data.

“A common challenge regarding all the permafrost work that we did on buildings in the north was how hard it was to get good aggregated data on actual permafrost conditions.”

–Elise Paré, WSP

While geoscientists have amassed a great deal of permafrost data, including location-specific data from geotechnical investigations for specific projects, the information has not yet been aggregated at the territorial level to update previous maps of permafrost conditions. These data gaps may be remedied in the coming years by the NSERC PermafrostNet partnership, a network of researchers currently working to improve understanding of Canadian permafrost and permafrost thaw.

In the meantime, the WSP consultants utilized the available permafrost maps to consider climate change impacts on permafrost on a broad scale rather than at a granular level where they could say, for example, that one particular community might be at higher risk than another 30 km away. This high-level analysis was intended to be an important first step in assessing the risks posed by permafrost thaw, and will allow the territory to effectively focus future efforts. The hope is that with greater availability of localized permafrost data and climate projections, their estimates can be refined at a later date.

The PIEVC Protocol requires identification of thresholds above which there is risk of a negative impact from climate change. First, the climate threshold for permafrost thaw had to be identified. The consultants began with their best available map of permafrost in Canada and then overlaid a second map describing temperature. Roughly speaking, the -1ºC isotherm (a contour line connecting locations with the same temperature) marks an upper threshold for the maintenance of permafrost. If future-projected temperatures exceed that -1ºC threshold for a sustained period, then some degree of permafrost degradation can be expected. Data available at ClimateData.ca can be used to illustrate how both average and minimum temperatures are projected to change across the Northwest Territories. A northward shift of minimum temperatures near the -1ºC threshold can be viewed in Figure 1.

Figure 1. Mean daily minimum temperature for northern Canada

Left: Mean daily minimum temperature for northern Canada, centred on the Northwest Territories, in the 1990’s (1981-2010). Right: Projected mean daily minimum temperature for the same region in the 2060’s (2051-2080) under a high emissions scenario (RCP 8.5). Daily minimum temperatures near -1ºC (green shades), are not seen in this region in the 1990s, but are projected to be achieved by the 2060s, indicating some degree of permafrost thaw can be expected in these regions. (Note that daily minimum temperatures of -1ºC indicate even warmer daily mean temperatures). Maps of mean and minimum temperatures can be obtained from ClimateData.ca.

While increasing temperatures are important, this was only the first step of the analysis, since permafrost also responds to ground moisture. Wet and warm conditions, occurring together, can accelerate the thermal breakdown of permafrost. To examine this effect, the WSP consultants seized on work by permafrost scientist Steve Kokelj of the Northwest Territories Geological Survey, which indicated that permafrost slump could occur when daily rainfall exceeded 40 mm.

To apply this rainfall threshold up to the current time horizon, WSP used historical rainfall intensity-duration-frequency (IDF) curves produced by Environment and Climate Change Canada (ECCC). These datasets describe the historical frequency of extreme rainfall of short duration (from five minutes up to 24 hours) at a particular location. IDF curves are used by engineers and water resource managers for flood forecasting and urban drainage design. Historical IDF data are readily available via ClimateData.ca.

The challenge with using IDF curves for this application though, stress the WSP consultants, is that they are based on rate-of-rainfall data in the past, and cannot on their own be used to estimate extreme rainfall in a changing climate. Moreover, IDF curves are available only at selected locations across Canada. WSP therefore made use of the IDF_CC Tool developed at Western University to estimate the probability of future rain events surpassing the 40 mm threshold. This tool provides IDF curve projections across the whole Canadian territory. “There are limitations associated with the use of this climate change data at such a significant spatial scale, so the Tool outputs should be paired with a sensitivity analysis specific to the area of the project, before being relied upon for design purposes,” Paré adds. Despite these limitations, however, they are a good starting point. “This is what we had to use for projecting sub-hourly extreme storm events, which are used in building design criteria,” explains her colleague, Jean-Phillipe Martin.

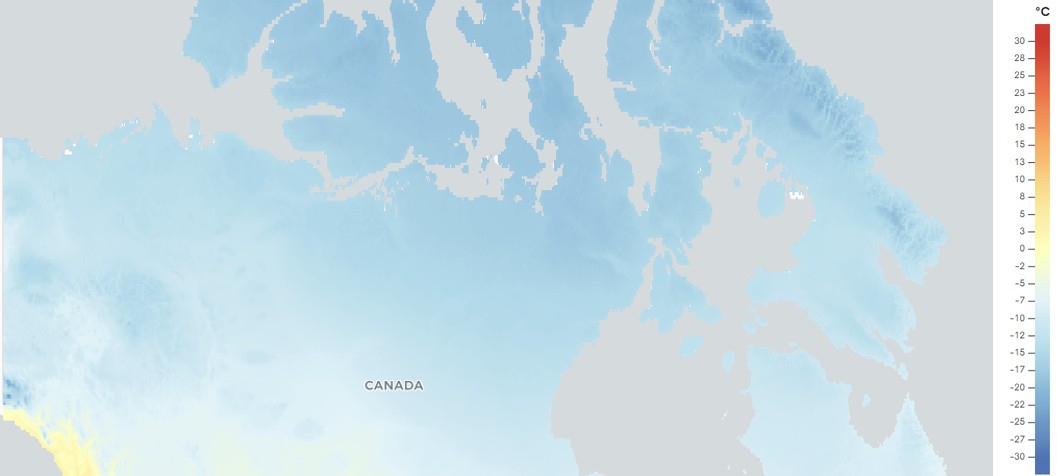
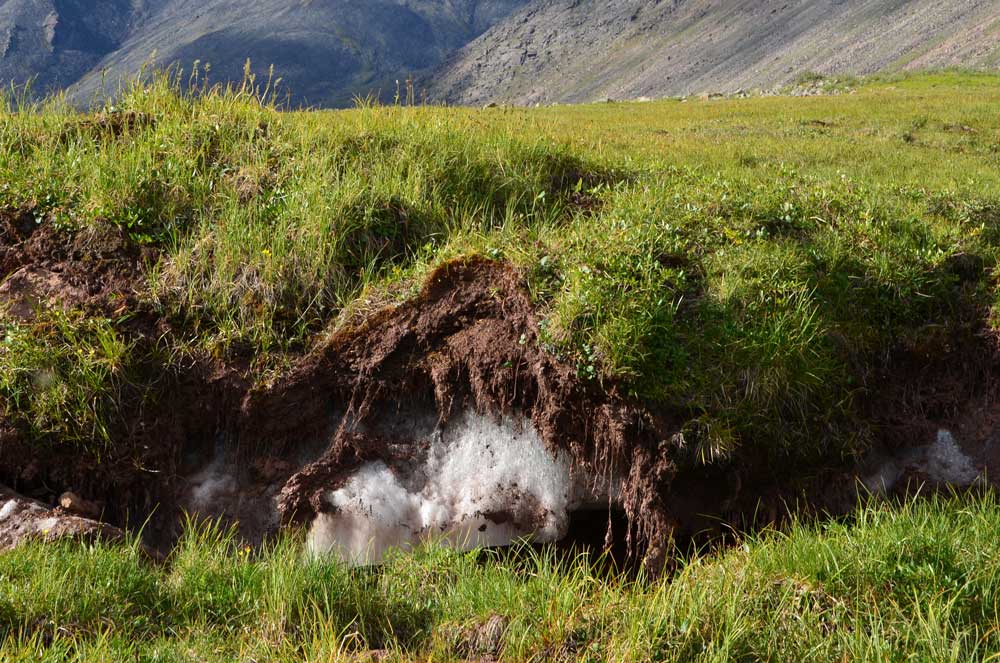
Ultimately, the consultants concluded that while increasing temperature is the primary driver of permafrost thaw, increasing precipitation and precipitation extremes could accelerate degradation, particularly where heat is transmitted to ice-rich permafrost via rain, causing thawing through a process called thermo-erosion. It was further concluded that greater permafrost thaw hazard is due to a higher incidence of ice-rich permafrost and fine-grained sediments. Thawing of ice-rich permafrost can cause abrupt and dramatic changes to the landscape, such as slumping, sinkholes, landslides, and the sudden expansion or drainage of water bodies.

For this reason, WSP concluded that permafrost thaw was a major concern for buildings in the northern Sahtu and Beaufort-Delta regions of the territory, where the permafrost is ice-rich. The team identified buildings that house critical services such as hospitals, schools, and community centres as most at risk.

The WSP consultants also understood the importance of viewing climate projections as ranges of possible outcomes, due to the inherent uncertainty in future socioeconomic development and greenhouse gas emissions pathways. Dealing head-on with the uncertainty in future climate projections is something that both Paré and Martin say needs to be more widely adopted across the engineering and planning community.

“The most important thing about any of these indicators is that they allow us to initiate a discussion about changing our paradigm in designing for future climate,” says Paré.

“Engineers tend to want a specific number, such as those provided in standards and codes, where the risk of uncertainty has been managed collectively by others,” she explains. “When integrating climate projections into design criteria, a risk management approach should be taken,” she adds. The changing climate has necessitated working with degrees of uncertainty and ranges of data rather than with precise data that are assumed to be certain. In this respect, changes in the approach and language of experts are necessary. The products developed by ClimateData.ca can help to hasten this evolution.

“You should not just have just one number. You should actually be thinking: ‘What are the consequences of failure? How badly will it go if I get it wrong?’ This is way more important than being able to say whether it will be a 20% or 22% increase.” This kind of thinking, Paré concludes, is how we can start to embrace a risk-based approach to designing buildings in the rapidly changing north.

Acknowledgements

The authors would like to express their sincere gratitude to Elise Paré, Jean-Phillipe Martin, and the team at WSP for their invaluable contributions to this case study.

References

  1. WSP Canada (2021). Government of Northwest Territories Assessment of Climate Change Impacts on Infrastructure in All NWT Communities. Online:  https://www.maca.gov.nt.ca/sites/maca/files/resources/gnwt_pievc_report_final_released.pdf

Related Variables

Explore variables to learn about how data was used to impact climate related decisions in specific contexts.

Mean temperature describes the average temperature for the 24-hour day.

The average temperature is an environmental indicator with many applications in agriculture, engineering, health, energy management, recreation, and more.

Technical description:

The average of the daily maximum temperature (Tmax) and the daily minimum temperature (Tmin). Use the Variable menu option to view annual, monthly or seasonal values for this variable.


Version 3.30 (2022-10-31) – this data is updated annually.

Intensity Duration Frequency (IDF) curves relate short-duration rainfall intensity with its frequency of occurrence and are often used for flood forecasting and urban drainage design.

Intense precipitation events can deliver large amounts of rain over short periods of time. This rain, as well as related flooding, can overwhelm storm drains, flood basements, wash out bridges and roads, and trigger landslides. To reduce the risk of these impacts, engineers, hydrologists, planners and decision makers need accurate information about extreme rainfall events. IDF curves are one important source of this information.

Climate change is expected to increase extreme rainfall in Canada. Because of this, IDF curves based on historical observations alone are inappropriate for long-term decision-making. To account for climate change impacts to extreme rainfall and IDF curves, Environment and Climate Change Canada recommends use of a scaling methodology. ClimateData.ca provides historical and climate change-scaled IDF data for all ECCC IDF stations in Canada.

Additional guidance about integrating climate change into IDF curves can be found on the Learning Zone. For further technical information on how IDF Curves are produced, please refer to Environment and Climate Change Canada’s Engineering Climate Datasets page or contact the Engineering Climate Services Unit at [email protected].