Introduction
Ontario’s provincial and municipal governments own a lot of buildings. A current estimate of the value of these structures—which include hospitals, schools, courthouses, culture and sport facilities, and much more—is pegged at over $250 billion. Keeping these structures in good standing currently costs the Ontario government over $10 billion per year.
It is well known that climate change will impact the costs associated with maintaining and operating buildings. Some climate-related hazards, like extreme heat and rainfall events, are likely to increase in frequency and intensity in the future, whereas others, like extreme cold days and freeze-thaw cycles, are likely to decrease. Until very recently, the operating and maintenance costs associated with these changing climate hazards were not known, and thus constituted a financial risk to the province.
In 2021, the Financial Accountability Office (FAO) was tasked with estimating the additional costs that certain climate change hazards could have on the long-term deterioration of Ontario’s public buildings. This ambitious effort to better understand the financial risks of climate change on buildings necessitated a detailed understanding of how climate change is likely to impact the frequency and intensity of weather hazards across Ontario. Seeking climatological expertise, the FAO partnered with the Canadian Centre for Climate Services (CCCS) to provide customized, infrastructure-relevant, climate change projections for the province.
Custom climate data for Ontario
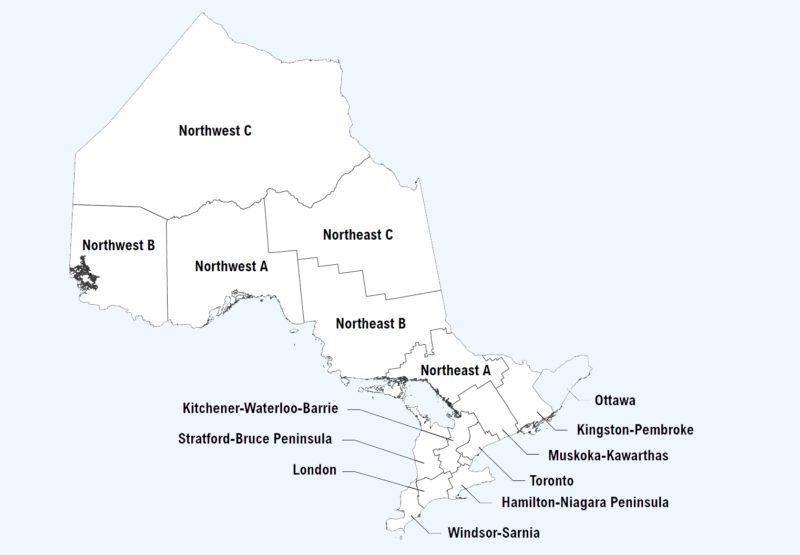
Ontario is a very large province, spanning several unique climates and geographies. Because of this, the project team divided Ontario into 15 sub-regions, shown in the figure below, in order to better analyze changes in local climate. For each region, annual and 30-year average climate change projections for the period spanning 1976 to 2100 were computed from an ensemble of the 24 statistically downscaled climate model projections available on ClimateData.ca. For each variable and time period, the 10th, 50th, and 90th percentiles of the RCP2.6 (low), RCP4.5 (medium), and RCP8.5 (high) emissions scenarios were summarized in order to showcase the range in climate model projections.
Need help understanding these terms? Learn more about ranges in climate model projections.
The 15 climate sub-regions defined for this project. Source CIPI: Buildings – Assessing the financial impacts of extreme rainfall, extreme heat and freeze-thaw cycles on public buildings in Ontario.
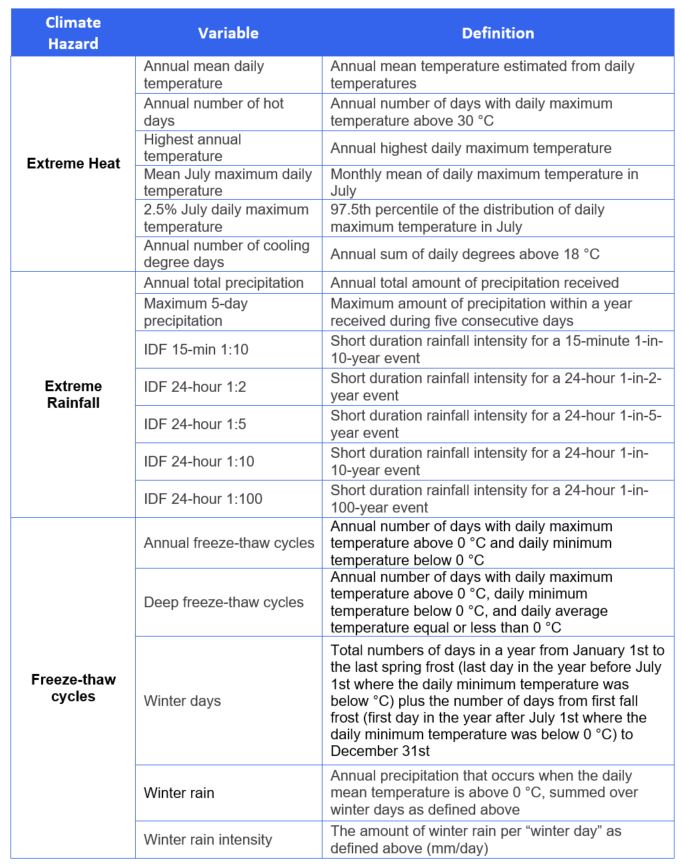
From these climate model projections, and in some cases combined with on-the-ground historical information, CCCS computed 18 custom indices related to the top climate hazards identified by FAO as being particularly impactful on buildings: extreme heat, extreme rainfall, and freeze-thaw cycles. The table below details these 18 indices.
Infrastructure deterioration model
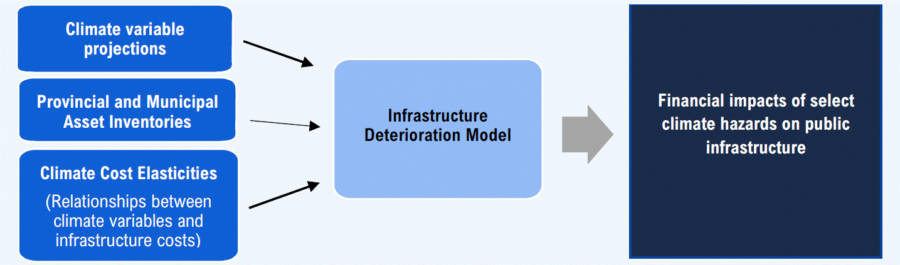
A key next step for the FAO was developing a relationship between changes in climate hazards and impacts to buildings. WSP, an engineering firm contracted by the FAO, provided these engineering-climate cost relationships using an Infrastructure Deterioration Model to assess cost impacts. This model included estimates for the following metrics:
- the change in the useful service life of typical infrastructure;
- the change in the annual operations and maintenance (O&M) expense;
- the cost to design a climate resilient component (renewal adaptation) with the same functionality, and;
- the cost to retrofit the component to be resilient to the climate hazard.
Source CIPI: Buildings – Assessing the financial impacts of extreme rainfall, extreme heat and freeze-thaw cycles on public buildings in Ontario.
Results
The results of this effort point to large increases in the costs of operating and maintaining the province’s infrastructure unless proactive steps are taken to both mitigate climate change as well as adapt Ontario’s public infrastructure to changes in climate hazards.
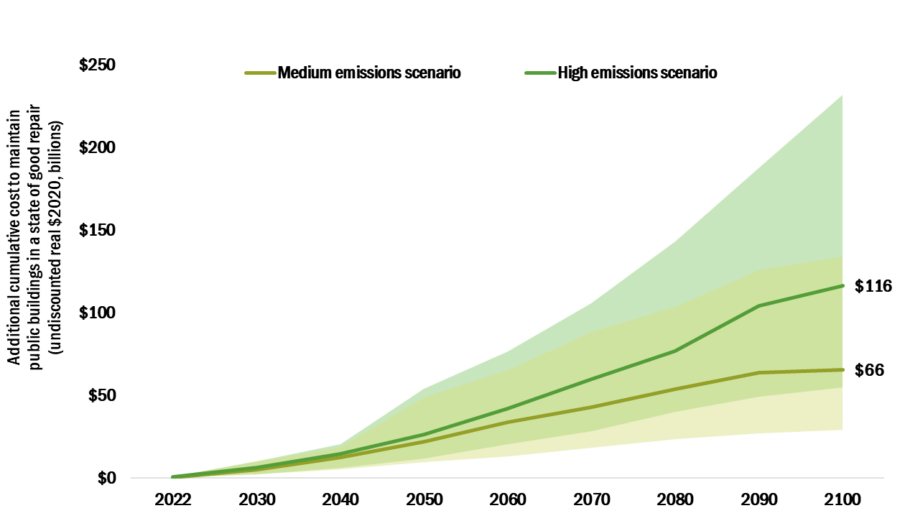
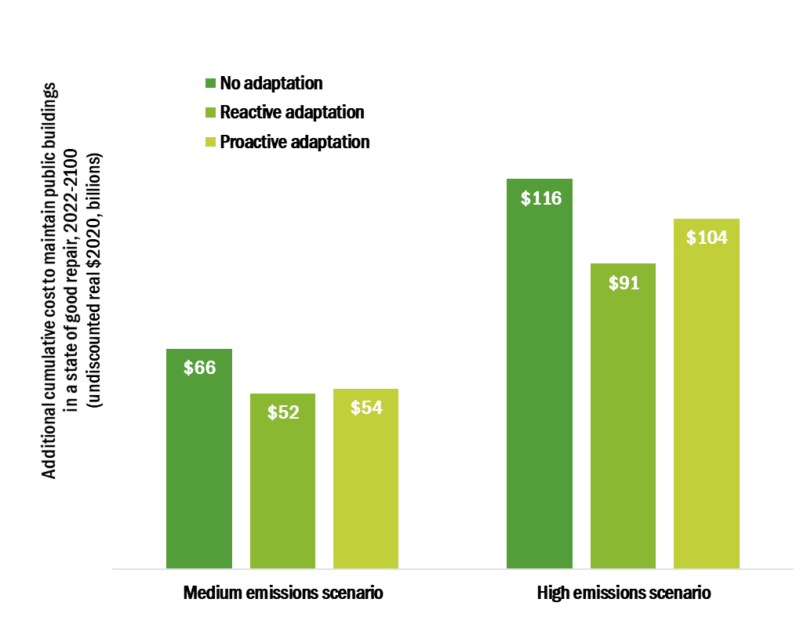
For example, in a medium emissions scenario (RCP4.5), the project team estimated an increase of $66 billion by 2100 (8 percent above baseline) in costs due to climate change. In the high emissions scenario (RCP8.5), costs increase to $116 billion by 2100 (15 percent above baseline). These costs mainly stem from faster deterioration of structures due to increased climate loads and weathering, necessitating higher operation and maintenance costs, and a decrease in asset life span, leading to an increase in asset replacement costs.
The solid line is the median (or 50th percentile) projection. The coloured bands represent the range of possible outcomes in each emissions scenario. The costs presented in this chart are in addition to the projected baseline costs over the same period. Source: CIPI: Buildings – Assessing the financial impacts of extreme rainfall, extreme heat and freeze-thaw cycles on public buildings in Ontario.
Additionally, the project team costed two different adaptation strategies: reactive (assets adapted at the end of their service lives) and proactive (assets adapted more rapidly via retrofits). Reactive and proactive adaptation actions were projected to be more effective for reducing future costs associated with the acceleration of deterioration of assets from climate change than no adaptation. This finding is in line with other studies that have found that adaptation reduces the long-term costs associated with climate change.
The costs presented in this chart are in addition to the baseline costs over the same period. Determining the most cost-effective strategy for an individual asset would require comparing the costs of different adaptation strategies over its service life, for a broader range of climate hazards and societal costs, and in consideration of its specific circumstances. Source: CIPI: Buildings – Assessing the financial impacts of extreme rainfall, extreme heat and freeze-thaw cycles on public buildings in Ontario.
In summary
The FAO’s results show that climate change will materially increase the cost of maintaining Ontario’s public buildings in a state of good repair. The extent of these additional costs on taxpayer-supported provincial and municipal budgets over the long term will depend on how quickly we can reduce greenhouse gas emissions and, thus, halt global climate change. Perhaps the most important outcome of this work is its broad assessment of the impacts of climate change on the operation, maintenance and replacement costs of buildings. This study demonstrates that adaptation, while expensive in the short-term, is less costly in the long term for Canadian tax payers.
To learn even more, read the full report linked here.