Climate Data in Action: Future Weather Files

Introduction

Buildings provide shelter and protect their occupants from the outside environment. To do this effectively, building designers need to be able to model how a location’s climate—the temperature, humidity, hours of sunlight, wind, and more—will impact the buildings energy performance, or the ability to remain comfortable and safe no matter what the outdoor conditions are. Most designers and engineers use historical data from local weather stations when modelling building performance. This assumes that the climate is stationary, or unchanging. However, the climate is changing. So, how can designers ensure they are designing with the future climate in mind?

Performance simulations

Building performance simulation allows designers to test different building designs on a computer and see how they would perform under real-world conditions. There are many building simulation tools available that use complex mathematical models to calculate energy flows in a building. These tools can evaluate the building’s performance in a number of categories, including energy simulation, thermal load calculations, HVAC system selection and sizing, thermal comfort analysis and indoor air quality, as well as lighting and daylighting simulation.

These simulations are used at almost every stage of the design process and provide valuable insight into building performance that cannot be obtained through measurement alone. The performance of a building is affected by the envelope design (walls, windows, roofs, etc.), building materials, building systems (lighting, cooling, heating, ventilation, etc.), internal loads (number of people, equipment, schedule, etc.), and, importantly for this story, the local climate conditions.

Weather files

In order to run these simulations, the tools require a weather file. A weather file is a text file that contains data on the local climate conditions, including temperatures, relative humidity, atmospheric pressure, solar radiation, wind speed and direction, and cloud cover. Until very recently, weather files were only constructed from weather stations records—meaning they are historical rather than future-facing. Building designers rely on weather files to create spaces that are safe, comfortable, and energy efficient, and so using only historical data to simulate the performance of a building may not reflect the types of weather conditions the building will have to endure in the future. Because buildings are designed to last for many decades, if not centuries, the amount of climate change the building may experience could be substantial over its lifetime.  As the climate warms, this means estimates of energy consumption and comfort levels will be different for the future.

Future weather files

Building professionals need a way to consider the impacts of future climate change on building designs. One way to achieve this is through the use of future weather files. Just like historical weather files, future weather files are text files that contain data on future weather conditions for a particular location. They often contain the same information as the historical files, meaning they can sometimes be easily integrated into existing performance simulations.

Two sets of future weather files are currently available for various locations in Canada, developed by the Pacific Climate Impacts Consortium (PCIC) and the National Research Council of Canada (NRC). These two datasets use different techniques to incorporate future climate data into the weather files.

PCIC applied the “morphing technique” to adjust the historical weather files. The result are, three 30-year typical meteorological year (TMY) weather files, using the RCP8.5 scenario, for the following time periods: 2011 to 2040 (2020s), 2041 to 2070 (2050s), 2071 to 2100 (2080s).

The NRC, in contrast, used a regional climate model output to create eight weather files that include a baseline file (1991 to 2021), and seven future periods representing different levels of global warming, from +0.5°C to +3.5°C. Aside from the TMY files, extreme and moisture weather files are also provided.

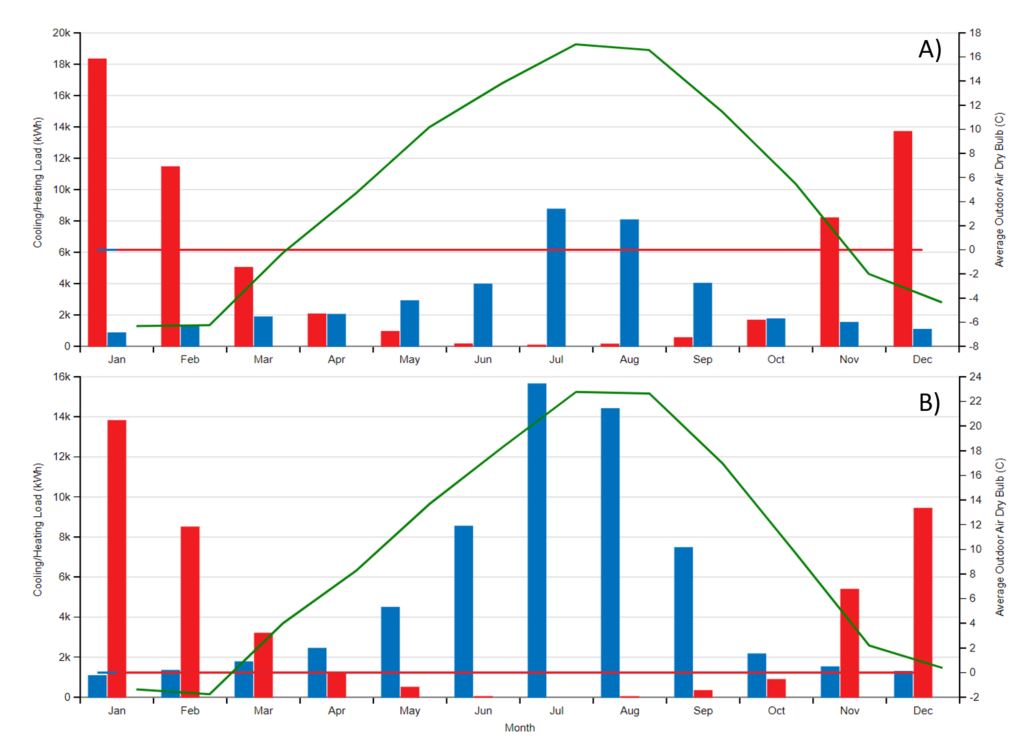
As you can see from the example figure below, future weather files can be very different from historical weather files. The blue bars on these graphs illustrate cooling load, or the amount of energy required for air conditioning. The bottom chart, which using a future weather file, shows much higher cooling demand in summer compared to the historical chart.

What’s coming next?

We will soon be launching a new learning zone resource on these two data sets, which will provide more information on their differences and guidance on which one to use. If this type of content is useful to you, please take the time to let us know. You can send your feedback to [email protected]. And make sure to sign up for our newsletter so you don’t miss future releases. You’ll find the sign-up form at the top of the News page.