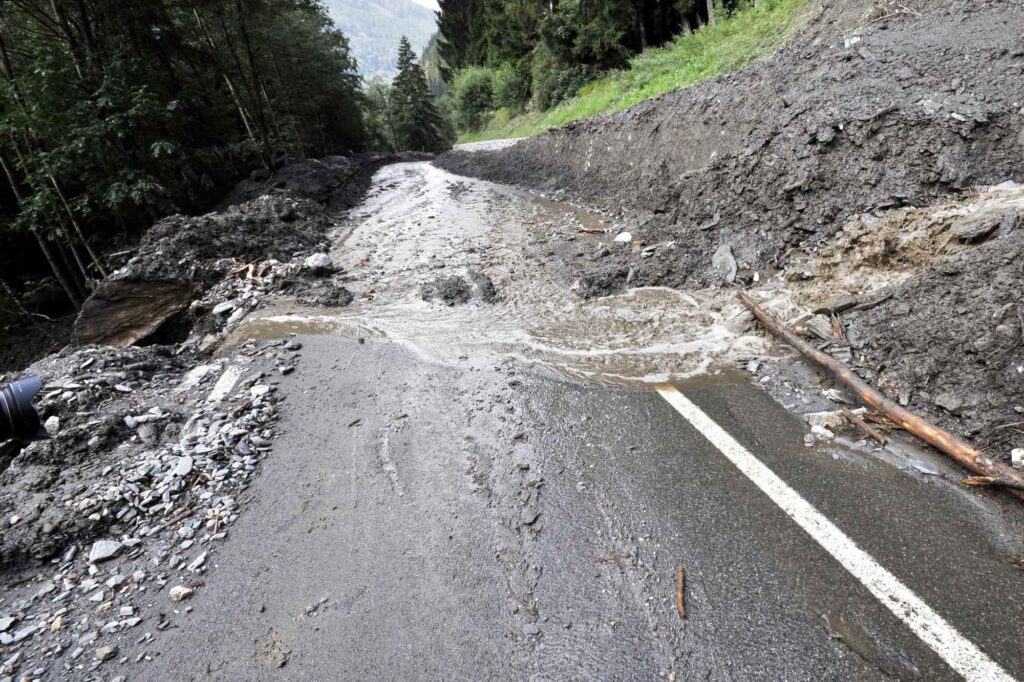
Transportation authorities across Canada are grappling with the changing frequency and intensity of precipitation events. From washed out highways in BC, to flooded commuter rail tracks in Toronto, extreme precipitation events are impacting the transportation sector across Canada.3,8 Extreme precipitation events lead to a myriad of other risks in the transportation sector: vehicle collisions, construction delays, and reduced commuter comfort, for example.5,9,10 As total precipitation levels increase, or as the severity and frequency of extreme precipitation events increase, the climatic impacts on transportation infrastructure are forecast to increase as well.
Transportation authorities are familiar with designing their infrastructure and operations with weather and current climate conditions in mind; but a rapidly changing climate is a new challenge. In fact, like many road authorities in Canada, the Ontario Ministry of Transportation (MTO) had focused on observed climate data to inform their selection of culvert sizes based on historical precipitation intensity-duration-frequency (IDF) curves.3,11 However, in response to projected changes in precipitation due to climate change, new initiatives have emerged to develop IDF curve projections. The MTO now selects culvert sizes based on future projected rainfall to allow adequate future capacity for extreme precipitation events.11 The same kind of reflection and work has been done in Quebec with the Ministry of Transport, academics, and several collaborators.
In another example, Canadian engineers had already begun to notice that our infrastructure is vulnerable to increasing damage from extreme precipitation. Engineers Canada partnered with Natural Resources Canada and several other collaborators to create a protocol to assess the risks to public infrastructure: PIEVC (see our case study here). After some initial testing, the PIEVC Protocol was used by the BC Ministry of Transportation and Infrastructure to assess the risks created on the Coquihalla Highway by extreme precipitation.8 It was found that heavy rain and snow events, among other things, were already creating challenging, even unsafe conditions on the Coquihalla Highway (located in a mountainous, coastal region of BC).8
In some instances, decision makers require information about precipitation projections for specific situations. ClimateData.ca currently offers a range of precipitation datasets, including: total precipitation, maximum 1-day total precipitation, and wet days with more than 1, 10, or 20 mm of precipitation.
Further, some users may be interested in the frequency of days for which there is more extreme precipitation (e.g. the number of days with maximum precipitation greater than 27 mm). These custom data extractions for projected precipitation can be defined and downloaded by users on our Analyze page.


