Map of the Month: Last Spring Frost

Introduction

In this series, we examine the many climate change maps available on ClimateData.ca. This month, we focus on maps showing projected changes in the date of last spring frost—the average calendar date when minimum temperatures consistently remain above 0°C. The last spring frost is a key seasonal milestone, as discussed below.

Why the Date of Last Spring Frost Matters

The Last Spring Frost marks the approximate beginning of the growing season for frost-sensitive crops and plants. When the lowest temperature of the day remains above 0°C for one consecutive day (before July 15th), the date of the last spring frost is established.

Changes in the last spring frost date have implications for agriculture, horticulture, and natural ecosystems. An earlier last spring frost may extend the growing season, providing opportunities for additional planting cycles and enabling the cultivation of crops that require longer growth periods. However, an earlier growing season can also increase vulnerability to late-season frost events, which may damage young plants.

Beyond agriculture, shifts in last spring frost dates affect ecosystems. Many plant species and pollinators rely on seasonal temperature cues for life cycle events such as flowering, migration, and reproduction. If these cues change, mismatches in ecological timing could occur, affecting biodiversity and food web dynamics.

Deciphering the Map’s Message

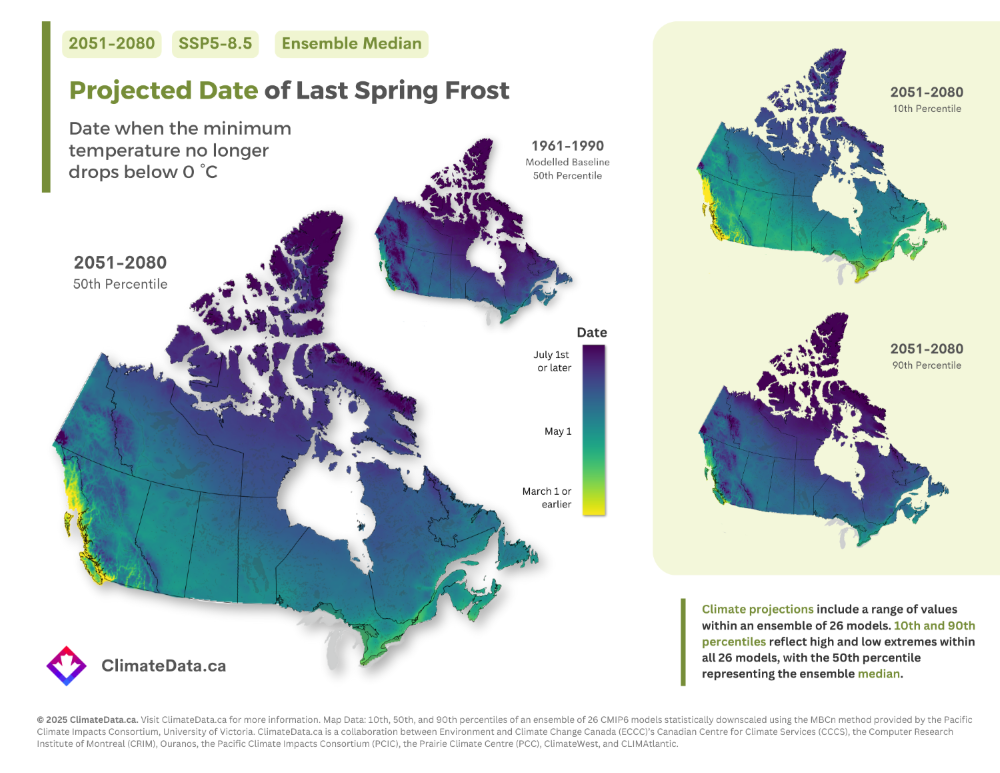
The left side of the figure below compares two periods: the modelled historical baseline (1961-1990; small inset map) and the median projected future (2051-2080) date of last spring frost under the SSP5-8.5 scenario, the scenario associated with the highest projected warming on ClimateData.ca (largest map).

Additionally, the smaller maps on the right side of the figure illustrate the range of projected values for the 2051-2080 period, highlighting the 10th and 90th percentiles. These percentiles represent the spread of outcomes within the 26-model ensemble, with the 10th percentile indicating an earlier last spring frost and the 90th percentile representing a later one. These maps are included because, as discussed further below, understanding variability in last spring frost dates is essential for effective adaptation planning.

Map Insights

The map reveals that the last spring frost is projected to occur earlier in the season across Canada. The shift towards earlier frost-free conditions is particularly noticeable in southern regions, where agricultural activity is most prominent.

While these static map images effectively illustrate broad patterns of change, it can be difficult to extract precise values from them, when viewed at a national scale. However, the maps on ClimateData.ca allow users to zoom in and click on specific regions to obtain precise dates for the last spring frost. The table below highlights selected locations across Canada to provide a clearer picture of regional projections. To explore an interactive version and find the last spring frost date for your community, visit the Last Spring Frost Interactive Map on ClimateData.ca.

Table: Projected Changes in Last Spring Frost Dates for Selected Canadian Locations

Location Modelled Historical Period (1961–1990) Projected Future Period (2051–2080; SSP5-8.5)
Median (50th Percentile) 10th Percentile Median (50th Percentile) 90th Percentile
Ottawa, ON May 9 April 3 April 16 April 24
Montreal, QC May 1 March 25 April 3 April 20
Toronto, ON April 28 March 24 April 5 April 14
Winnipeg, MB May 21 April 24 May 2 May 9
Regina, SK May 19 April 26 May 5 May 11
Calgary, AB May 20 April 20 May 3 May 10
Edmonton, AB May 18 April 19 April 29 May 6
Fredericton, NB May 13 April 6 April 24 May 2
Halifax, NS May 10 March 27 April 14 April 21
St. John’s, NL May 24 April 10 April 30 May 9


Important Map Caveats

It is important to note that these maps illustrate long-term, thirty-year average values derived from an ensemble of 26 global climate models. The actual date of last spring frost will still vary from year to year. In some years, an early last frost may be followed by an unexpected cold event, which could impact crops and ecosystems.

Additionally, readers should keep in mind that these maps are based on a single emissions scenario: SSP5-8.5, which, as mentioned above, represents the highest level of projected climate change available on ClimateData.ca. The platform also provides projections under three other scenarios—SSP1-2.6, SSP2-4.5, and SSP3-7.0. Examining projected changes across multiple scenarios is important for gaining a more comprehensive understanding of potential future climate outcomes.

It is also worth mentioning that regions such as the West Coast of Canada, particularly areas like Vancouver and Victoria, experience mild climates where frost is rarer. Therefore, changes in last spring frost dates are less relevant in these areas.

Understanding this variability is essential for adaptation planning. Farmers, gardeners, and land managers should consider the full range of potential outcomes when planning for the growing season. Learn more about climate model ensembles in our Learning Zone article on the topic.
Climate Change and Agricultural Implications

As the climate changes, Canadian farmers face new challenges and opportunities. While a longer growing season may allow for diversified crop production, there is also increased risk from extreme weather events such as heatwaves and droughts. In addition, changing frost dates could influence the timing of pest outbreaks and the spread of plant diseases, requiring adjustments in management strategies.

To adapt effectively, agricultural producers should integrate climate-smart practices, such as selecting resilient crop varieties, adjusting planting schedules, and implementing frost protection measures. For more resources on climate change and agriculture, visit our article: Get Climate Smart: Resources for the Agricultural Sector.

These maps highlight the importance of proactive planning in the face of climate change. Reducing global greenhouse gas emissions is essential if we are to limit the most severe impacts of warming, while adaptation measures can help communities and industries prepare for changing conditions.

To explore more climate maps, including projected changes in the date of last spring frost under different emissions scenarios and time periods, visit our interactive map page on ClimateData.ca.