Important Map Caveats
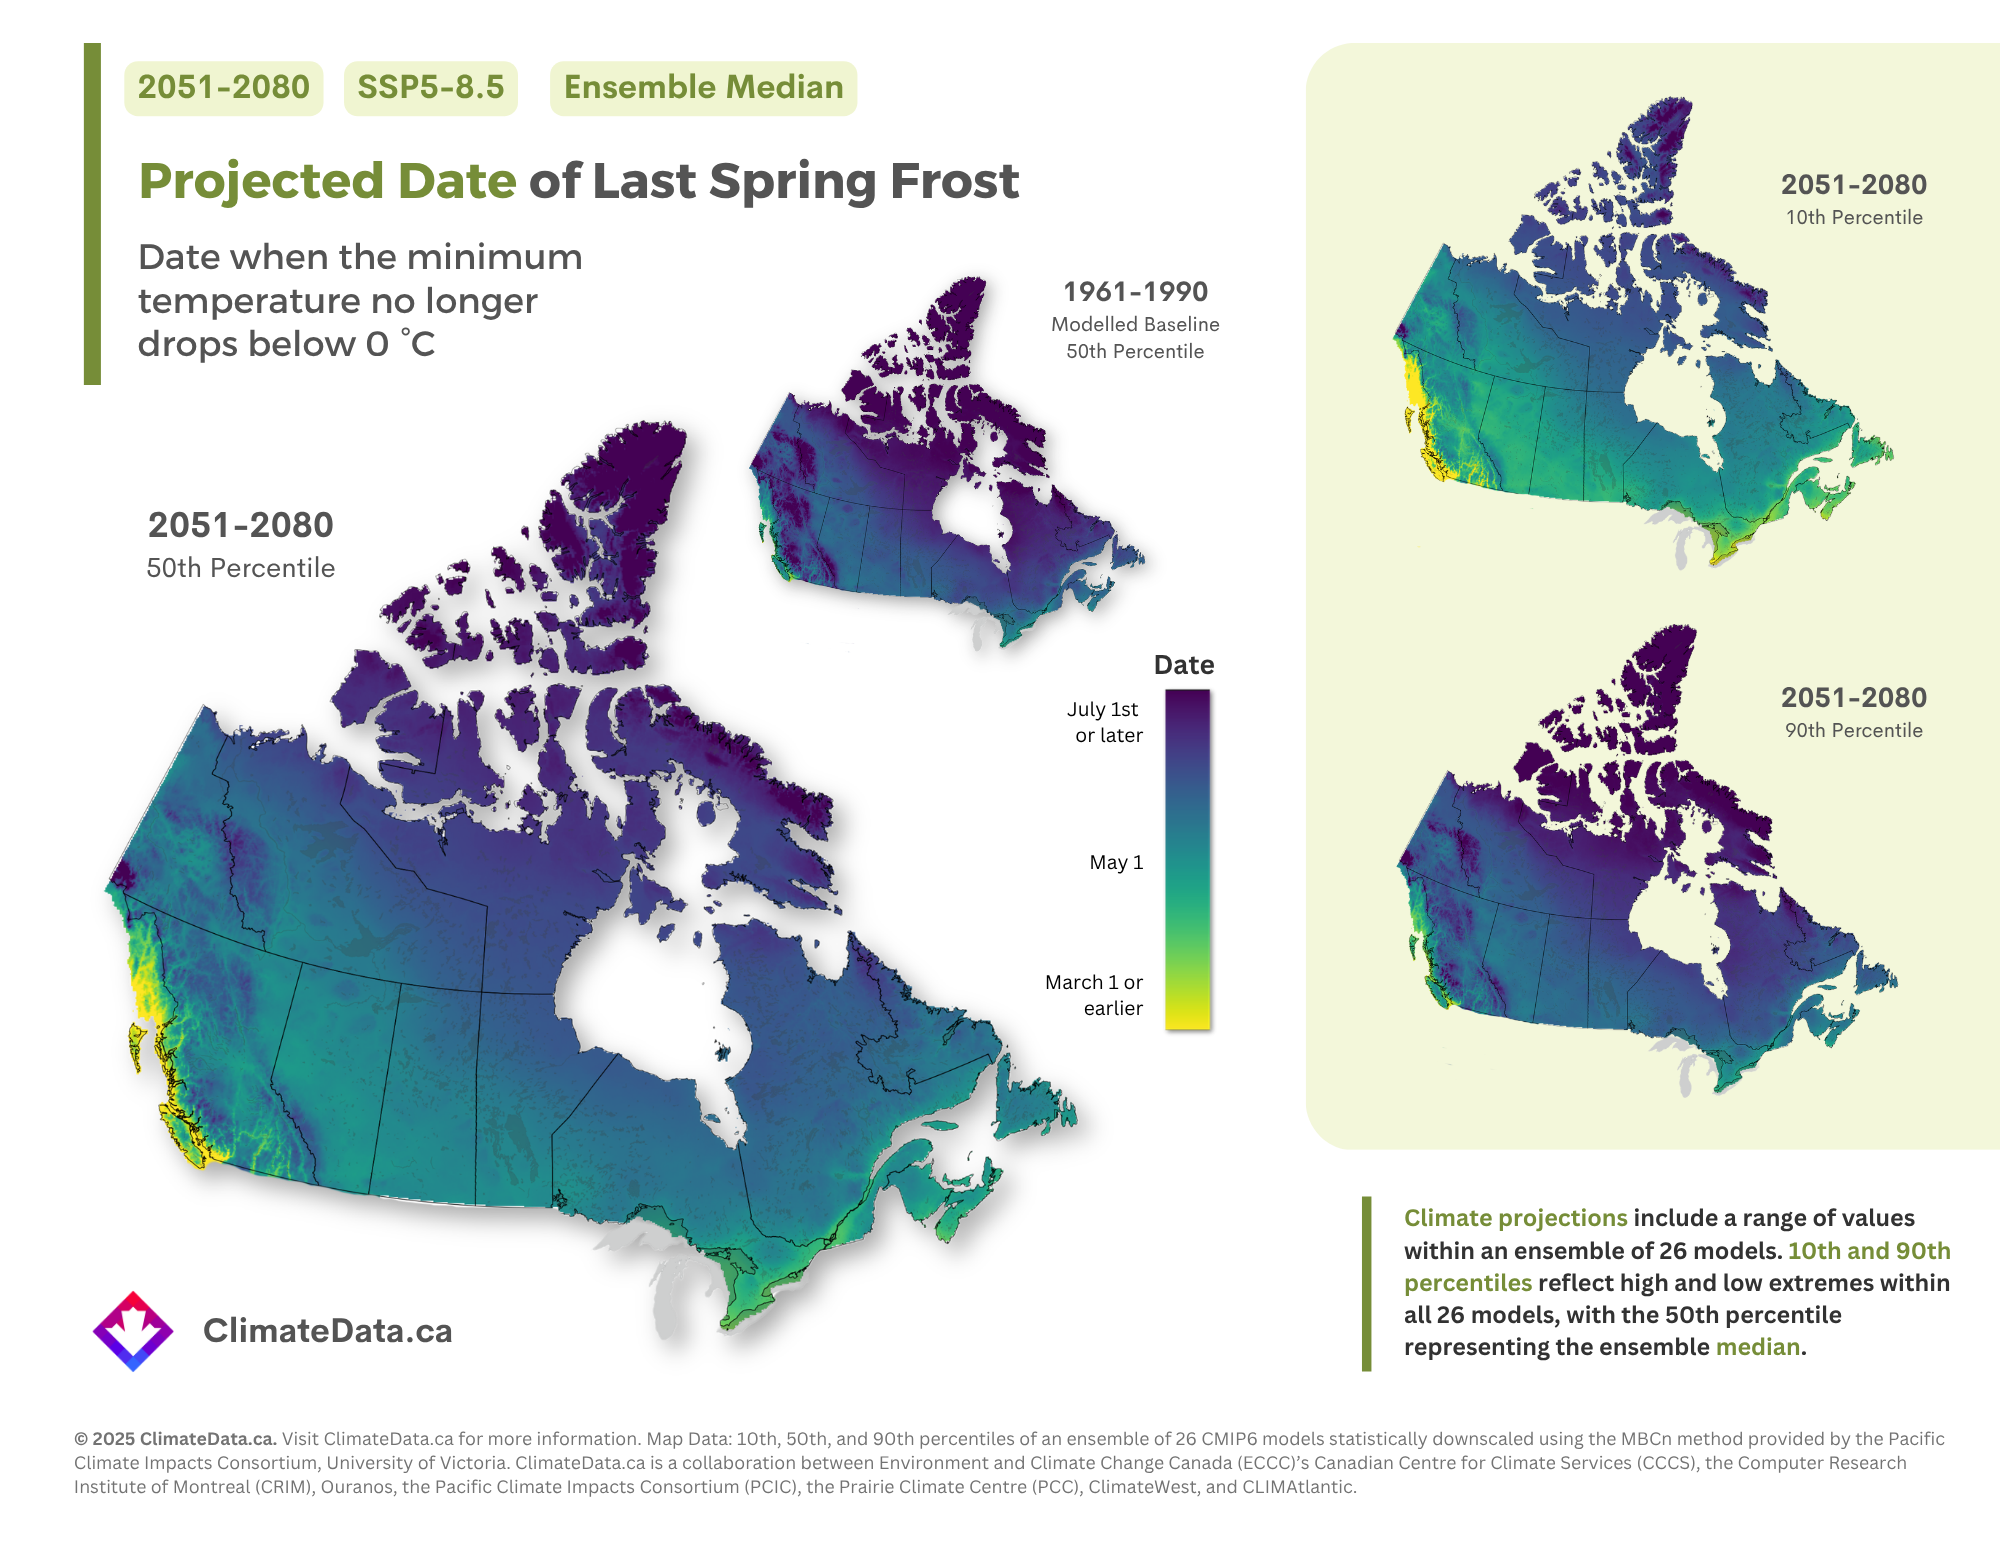
It is important to note that these maps illustrate long-term, thirty-year average values derived from an ensemble of 26 global climate models. The actual date of last spring frost will still vary from year to year. In some years, an early last frost may be followed by an unexpected cold event, which could impact crops and ecosystems.
Additionally, readers should keep in mind that these maps are based on a single emissions scenario: SSP5-8.5, which, as mentioned above, represents the highest level of projected climate change available on ClimateData.ca. The platform also provides projections under three other scenarios—SSP1-2.6, SSP2-4.5, and SSP3-7.0. Examining projected changes across multiple scenarios is important for gaining a more comprehensive understanding of potential future climate outcomes.
It is also worth mentioning that regions such as the West Coast of Canada, particularly areas like Vancouver and Victoria, experience mild climates where frost is rarer. Therefore, changes in last spring frost dates are less relevant in these areas.
Understanding this variability is essential for adaptation planning. Farmers, gardeners, and land managers should consider the full range of potential outcomes when planning for the growing season. Learn more about climate model ensembles in our Learning Zone article on the topic.