Top Cold Events of Winter 2025/2026: What Attribution Science Tells Us About Extreme Cold in a Warming Climate

Date July 17, 2026
Author Aaron Tamminga and Ryan Smith
Topics Get Climate Smart
Share this post

Introduction

Canada is warming nearly twice as quickly as the global average, with winter temperatures increasing faster than any other season. One result of this warming is that periods of extreme cold are becoming less frequent and less intense across much of the country. However, cold extremes have not disappeared. Even in a warming climate, natural climate variability and large-scale atmospheric circulation patterns can still produce periods of unusually cold weather.

The winter of 2025/2026 provides a useful example. Although the season was 1.7°C warmer than the 1961–1990 average across Canada, Environment and Climate Change Canada’s Rapid Extreme Weather Event Attribution system identified 14 significant cold events. Attribution analysis found that all 14 events were less likely to occur because of human-caused climate change. Of these events, two were classified as less likely, ten as much less likely, and two as far less likely compared to a climate without human-caused warming.

Winter 2025/2026 Cold Events Across Canada

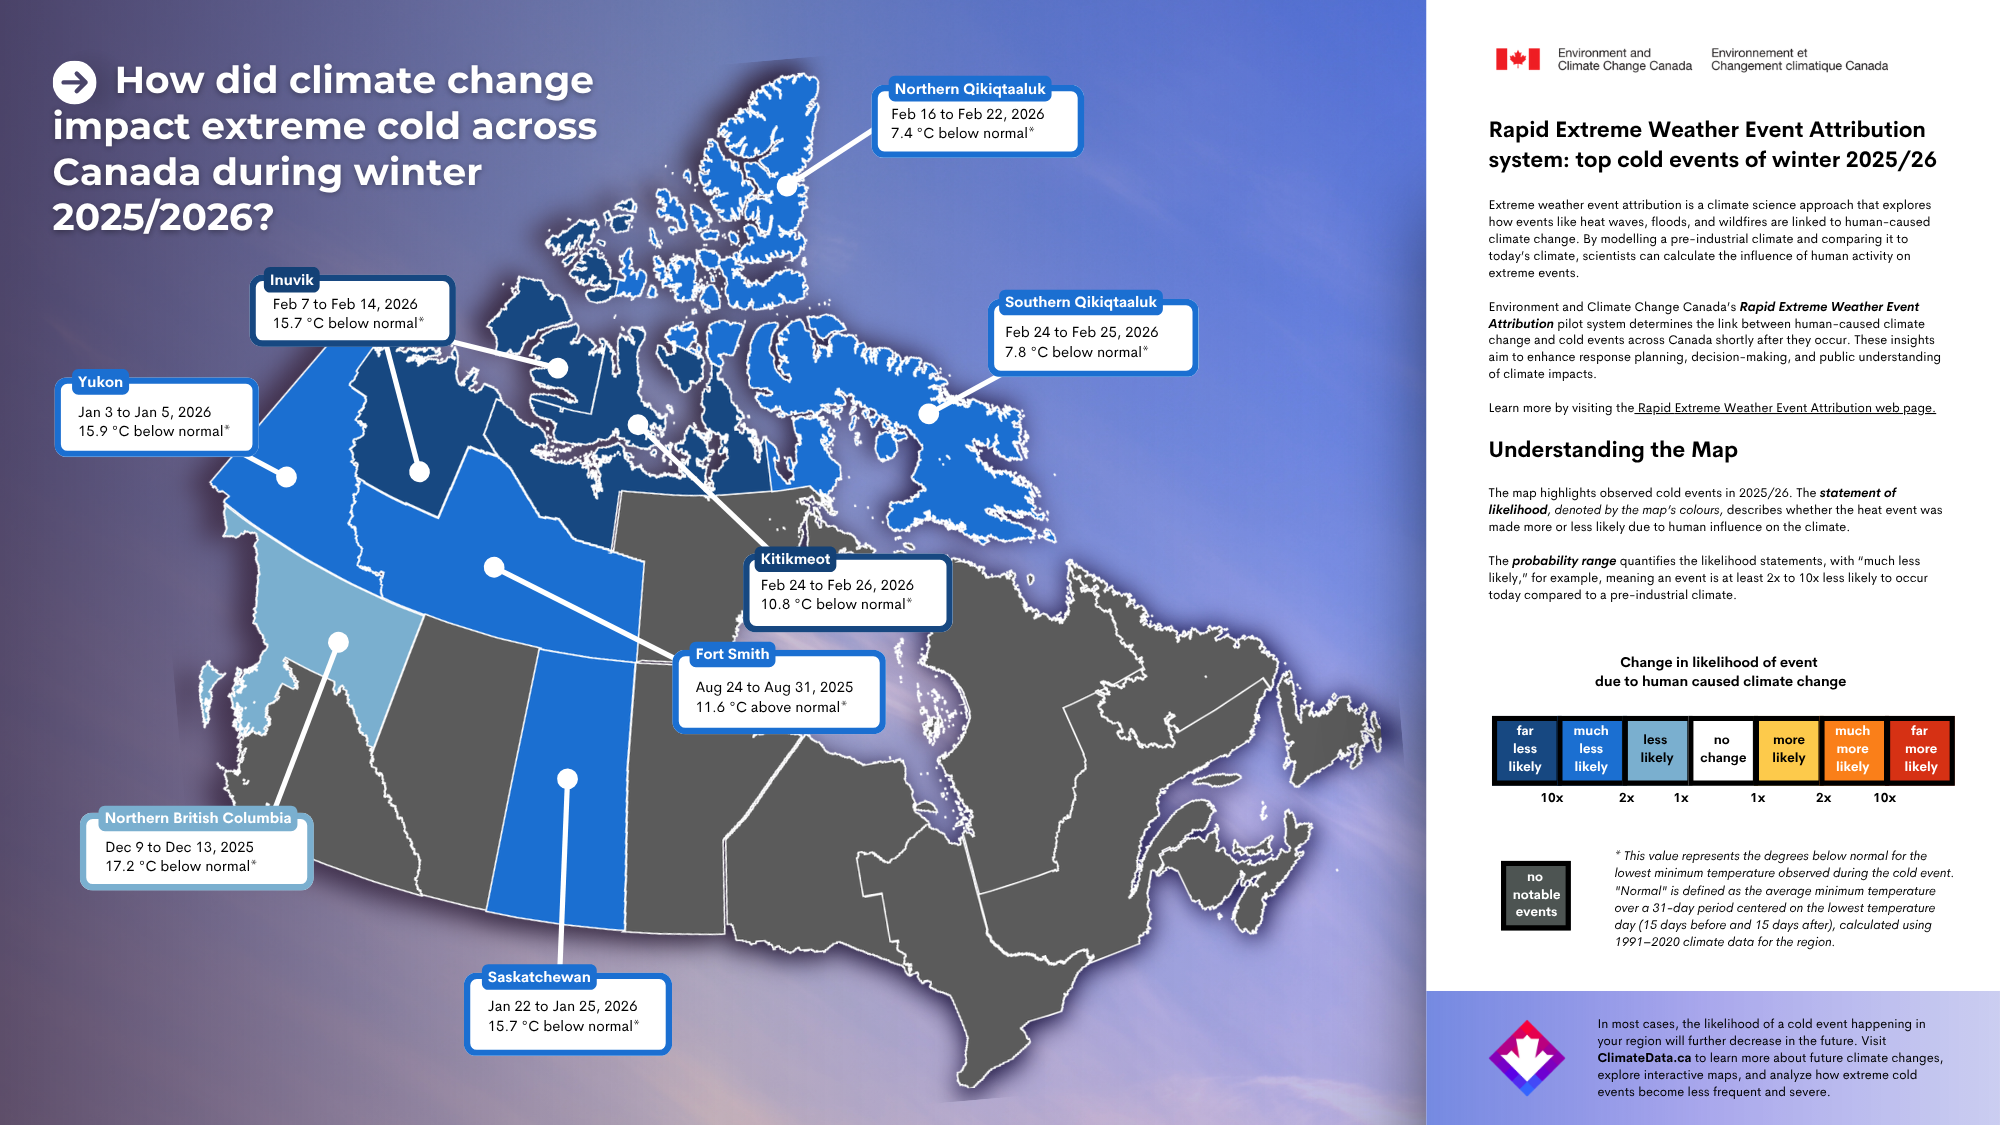
The map below summarizes the coldest event identified during winter 2025/2026 in each of the 17 regions analyzed by the attribution system. Regions that did not experience temperatures cold enough to trigger the system are shown in grey. In regions with multiple cold events, only the coldest event is shown. Most of the identified events occurred in northern and western Canada.

The largest departure from normal conditions occurred in the Yukon, where a 20-day cold period from December 8 to 27, 2025 brought an average regional daily minimum temperature of -41.2°C, approximately 17°C colder than normal for that time of year. Because temperatures are averaged across the entire Yukon analysis region, some locations experienced even colder conditions. According to the attribution analysis, an event of this magnitude is much less likely to occur in today’s climate than it would have been in a climate without human-caused warming.

The full set of 14 events identified is shown in the table below, with additional temperature information, a statement of likelihood for the effect of climate change on current probabilities compared to a climate without any human-caused warming, and a statement of future likelihood describing how the probability of an event of the same magnitude would change in a future climate with an additional 2 °C global warming. As climate change continues in the future, cold extremes comparable to the events identified here will continue to occur, but they will become even less common than in the current climate. Of the 14 events assessed in winter 2025/2026, two are projected to shift from less likely to much less likely, five are projected to shift from much less likely to far less likely, and seven are projected to remain in the same likelihood range in a modelled future climate.

RegionDates of cold eventColdest daily low (°C)Normal daily low (°C)Below normal (°C)Current likelihoodFuture likelihood
(2°C warming)
YukonDec 8–27, 2025−41.2−23.917.3Much less likelyMuch less likely
Northern British ColumbiaDec 9–13, 2025−32.0−14.817.2Less likelyMuch less likely
Northern British ColumbiaDec 20–27, 2025−31.7−15.815.9Less likelyMuch less likely
YukonJan 3–5, 2026−40.9−25.015.9Much less likelyMuch less likely
SaskatchewanJan 22–25, 2026−35.2−19.515.7Much less likelyMuch less likely
Inuvik, Northwest TerritoriesFeb 7–14, 2026−45.3−29.615.7Far less likelyFar less likely
Fort Smith, Northwest TerritoriesFeb 17–18, 2026−38.3−25.412.9Much less likelyMuch less likely
Inuvik, Northwest TerritoriesMar 2–3, 2026−39.9−28.211.7Much less likelyFar less likely
Kitikmeot, NunavutFeb 24–26, 2026−43.1−32.310.8Far less likelyFar less likely
Kitikmeot, NunavutFeb 8–17, 2026−43.0−33.49.6Much less likelyFar less likely
Inuvik, Northwest TerritoriesJan 5–7, 2026−39.1−29.69.5Much less likelyMuch less likely
Kitikmeot, NunavutMar 2–4, 2026−40.9−31.69.3Much less likelyFar less likely
Southern Qikiqtaaluk, NunavutFeb 24–25, 2026−40.8−33.07.8Much less likelyFar less likely
Northern Qikiqtaaluk, NunavutFeb 16–22, 2026−41.9−34.57.4Much less likelyFar less likely

Box 1: How does the Rapid Extreme Weather Event Attribution system work?

The Rapid Extreme Weather Event Attribution system was developed by scientists in Environment and Climate Change Canada’s Climate Modelling Division to assess how human-caused climate change affects the probability of extreme weather events.

For temperature extremes, the system continuously monitors conditions across 17 regions of Canada. When unusually cold temperatures occur, the system compares how likely an event of that magnitude would be in three different climates:

  • A pre-industrial climate (1850–1900), before significant human-caused warming;
  • Today’s climate; and
  • A future climate representing an additional 2°C of global warming.

Using climate model simulations and observations, the system estimates how the probability of the event changes between these climates. Results are communicated using likelihood categories that describe how climate change has altered the odds of the event occurring.

Likelihood Statement

Change in Probability

Less likely

At least 1x to 2x less likely

Much less likely

At least 2x to 10x less likely

Far less likely

More than 10x less likely

For example, if a cold event is classified as much less likely, it means an event of that magnitude is estimated to be at least two to ten times less likely to occur in today’s climate than it would have been in a climate without human-caused warming.

Example Cold Event: Saskatchewan January 22 to 25, 2026.

Residents of the Prairies experienced periods of extreme cold this winter, leading to weather warnings in several provinces due to severe wind chill and cold temperature risks. The following set of figures uses a four-day cold event in Saskatchewan from January 22 to 25, 2026 to demonstrate how the Rapid Extreme Weather Event Attribution system identifies and analyzes such cold spells.

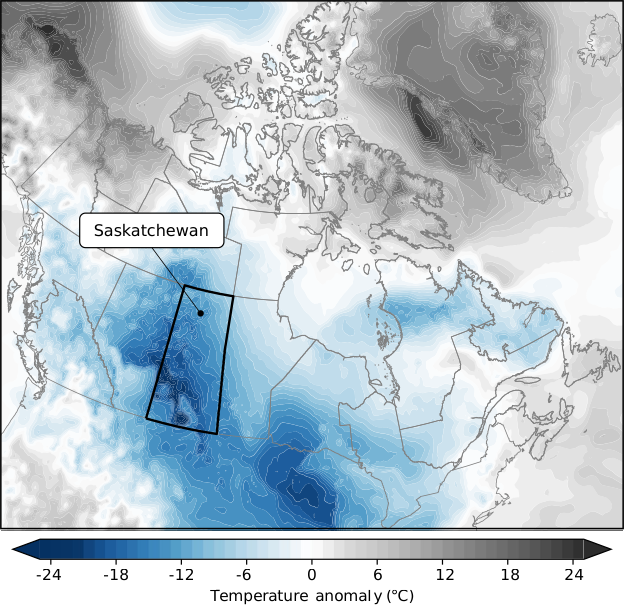
The first figure shows a map of temperature anomalies (defined as the difference in daily minimum temperature between the analyzed date and the 1990-2021 base period) across Canada on the coldest day of the event. These temperature anomalies are derived from the ERA5 reanalysis product1, which uses a weather model together with observations to provide a spatially complete snapshot of climate conditions in recent history. On the coldest day of the event, colder than normal conditions extended across much of Alberta, Saskatchewan, and southern Northwest Territories.

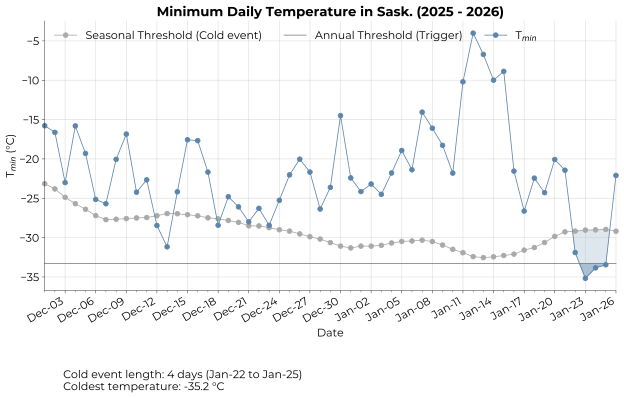
The second figure shows a time series of observed minimum daily temperatures (Tmin) from ERA5 data in December 2025 and January 2026 averaged over the Saskatchewan region. The solid grey annual threshold line represents the trigger criterion to identify an event, calculated as the median annual minimum temperature (coldest day of the year) for the region from 1991-2020. In the case of the January cold event, this threshold was exceeded from January 23 to January 25, shown by the dark blue shaded area. Following the event, the final start and end dates are determined based on the seasonal threshold (dotted grey line), which is calculated as the 10th percentile of daily minimum temperatures from the 1991-2020 period for the dates of interest. The period where temperatures were below this threshold is shown by the light blue shaded area. Based on the seasonal threshold, the event lasted from January 22 to January 25.

Figure credit: Dr. Elizaveta Malinina

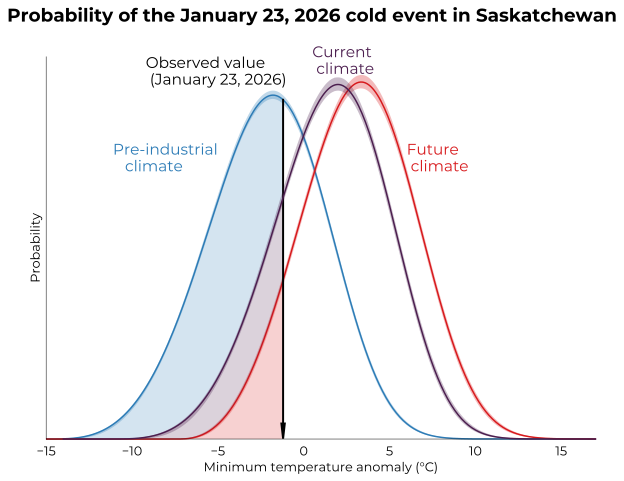
To determine the influence of human-caused climate change on the event, the attribution system compares how the distribution of the temperature of the coldest day of the year (represented as anomalies relative to 1991-2020) changes between the simulated pre-industrial, current, and future climates. These distributions come from multi-model climate ensembles from the Coupled Model Intercomparison Project Phase 6 (CMIP6)2. The figure below shows the distribution of minimum temperature anomalies for Saskatchewan for each time period based on 23 CMIP6 models. As the modelled climate warms from pre-industrial to current to future conditions, the distribution of minimum temperature anomalies shifts to the right. This shift indicates increased overall temperatures and decreased probability of extreme cold, which occurs at the far-left tail of each distribution. During the example event in Saskatchewan, the observed coldest daily minimum temperature anomaly was -1.2 °C on January 23. On the figure, this temperature is shown by the vertical black line.

The probability of an event colder than was observed on January 23 happening in each of the three climates is represented by the shaded area under each curve. A smaller shaded area under the curve indicates a lower probability. Under pre-industrial conditions, an event with a -1.2 °C anomaly falls near the centre of the distribution of minimum temperatures, with just over half of the area under the curve shaded. This means that such a temperature would be expected to occur frequently.  Under the warmer conditions of the current climate, a value of -1.2 °C falls farther towards the left of the distribution with less area under the curve shaded, indicating a lower probability of such a temperature occurring. In a warmer future climate with 2 °C global warming, the -1.2 °C anomaly becomes even less common as the distribution continues to shift to the right and only a small portion of the area under the curve is shaded.

Figure credit: Dr. Elizaveta Malinina

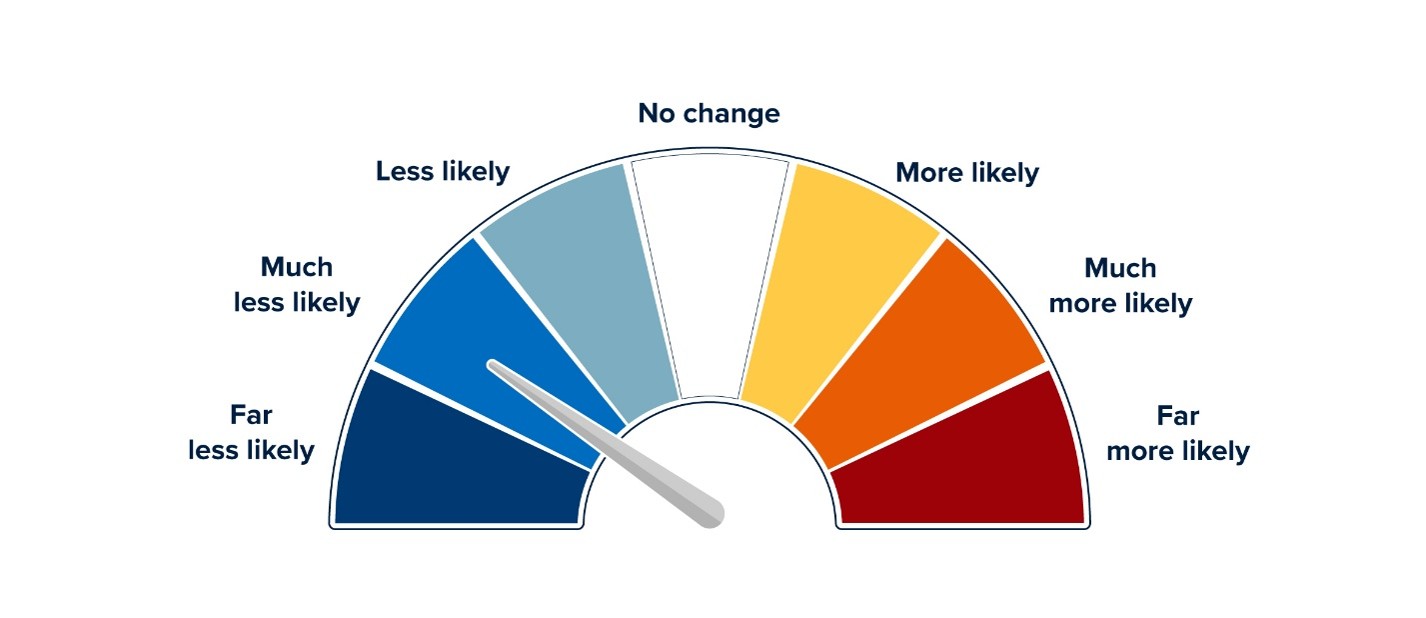
Because of the difference in probability between the current climate and the pre-industrial climate, the Saskatchewan event was determined to be at least 2x to 10x less likely in the current climate than in a climate without human-caused climate change, which corresponds to a likelihood statement of much less likely. The likelihood statement for this event in the current climate is communicated using the indicator scale graphic as shown below.  

Conclusion

Environment and Climate Change Canada’s Rapid Extreme Weather Event Attribution system provides Canadians with valuable context about how human-caused climate change affects the probability of extreme weather. In addition to the cold extremes discussed here, the system analyzes extreme heat events in the summer and extreme precipitation throughout the year, with plans to expand the system to other weather variables as Environment and Climate Change Canada scientists pilot new capabilities and more data and research become available. The automated operation of the system allows for quick dissemination of results as events occur across the country, improving understanding of the link between human-caused climate change and extreme weather.

Importantly, while attribution science proves these events are becoming less frequent and less severe, it is useful to remember that cold snaps remain a fundamental, structural feature of Canadian winters. Even in a warming climate, natural variability and complex atmospheric shifts mean that disruptive cold extremes are not disappearing, and cold snaps are here to stay. For a deeper look into how these winter hazards are evolving and how to prepare for them, read ClimateData.ca’s article on Cold Snaps and Climate Change. Ultimately, tracking these shifting patterns helps to inform Canada’s mitigation and adaptation initiatives, ensuring infrastructure and communities remain resilient in a changing climate.

For More Information

Visit Environment and Climate Change Canada’s Extreme Weather Event Attribution website to learn more. The latest results from the attribution system can be found on the Government of Canada Open Government Portal.

Visit ClimateData.ca to learn more about future climate changes, explore interactive maps, and analyze how extreme cold temperatures become less frequent under a range of emissions scenarios.

References

1. Hersbach, H., Bell, B., Berrisford, P., Hirahara, S., Horányi, A., Muñoz‐Sabater, J., Nicolas, J., Peubey, C., Radu, R., Schepers, D. and Simmons, A. (2020). The ERA5 global reanalysis.Quarterly Journal of the Royal Meteorological Society146(730), pp 1999-2049.

2. Eyring, V., Bony, S., Meehl, G. A., Senior, C. A., Stevens, B., Stouffer, R. J., and Taylor, K. E. (2016). Overview of the Coupled Model Intercomparison Project Phase 6 (CMIP6) experimental design and organization. Geoscientific Model Development9(5), pp 1937-1958.