This article can be explored in 3 formats:
Full article
(continue reading below)

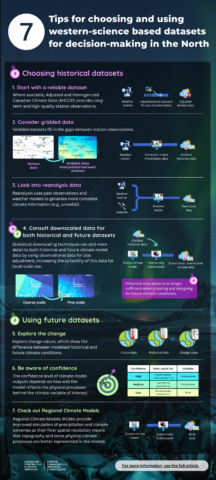
Infographic
(click to download)
Print friendly infographic
(click to download)
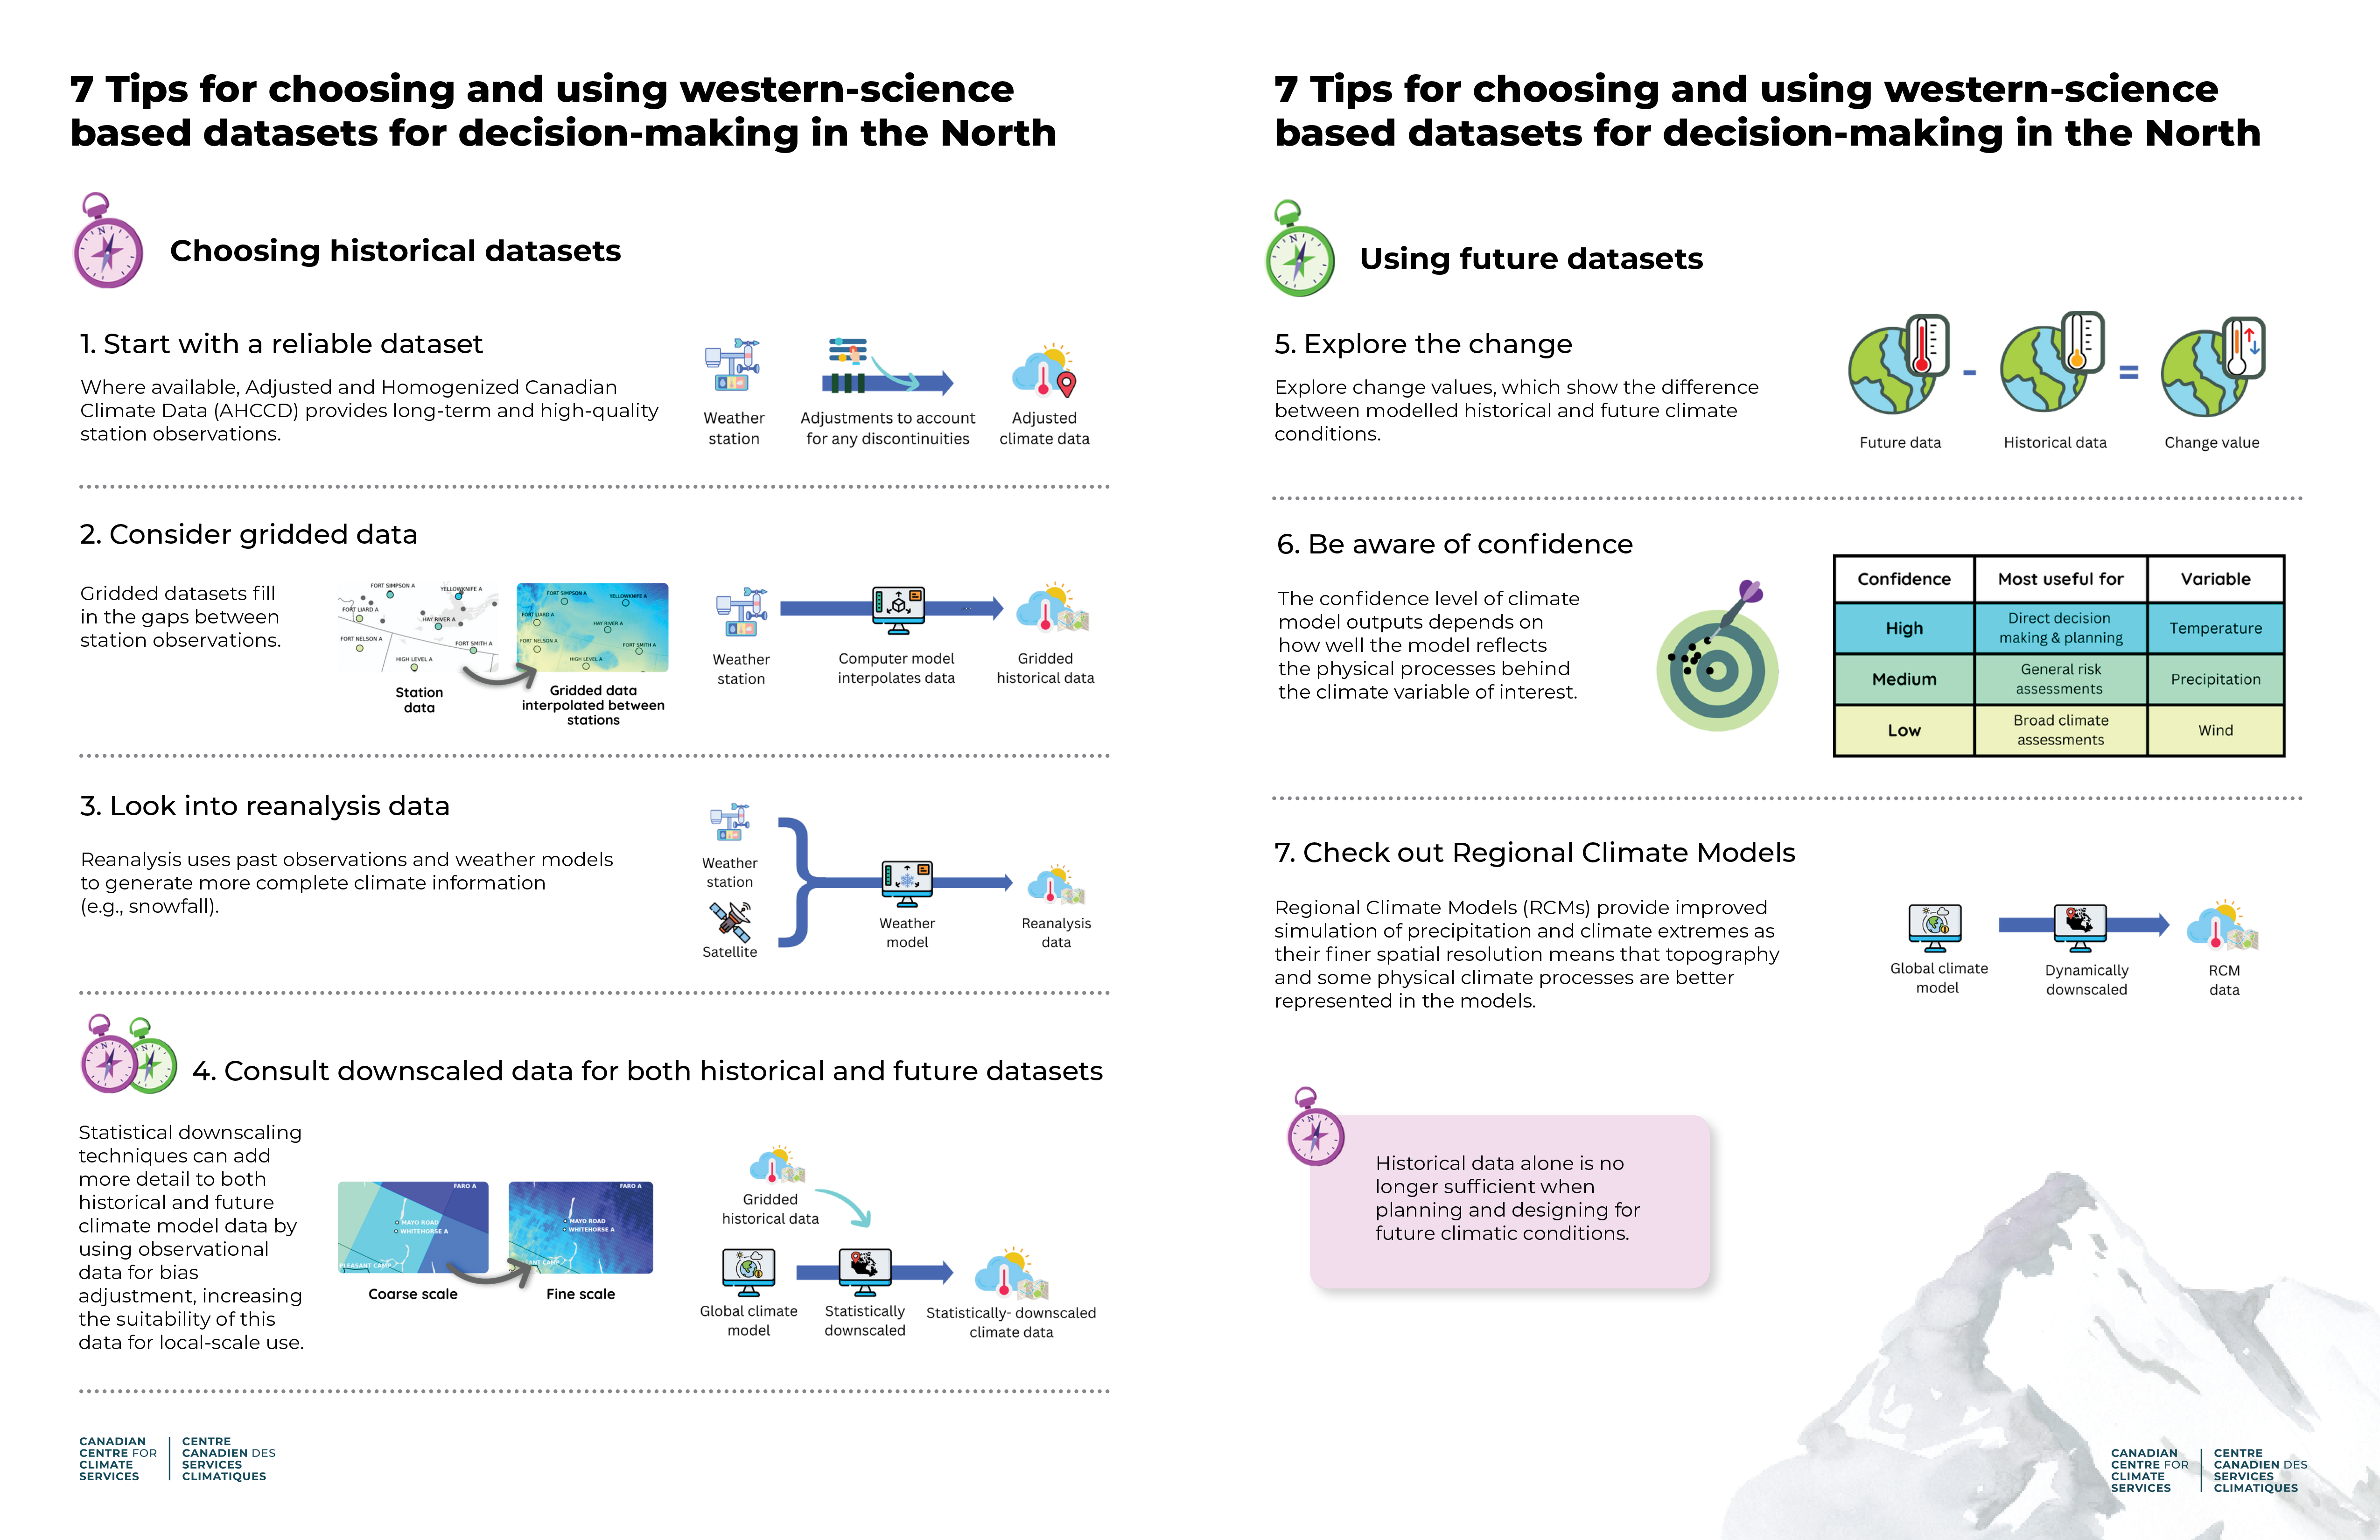
This article provides intermediate level tips for using future and historical climate data for decision making in the North.
Northern Climate Data Resources
Article
20 minutes
Full article
(continue reading below)
Infographic
(click to download)
Print friendly infographic
(click to download)
The article Overview of Available Western Science-based Climate Data for Northern Canada introduces Western climate datasets available for the North, while Getting Started with Western Science-based Climate Data for Northern Canada provides general tips for using climate data. This article goes into more depth with seven best practices for choosing and using historical data and future climate data in the North. While the climate datasets on ClimateData.ca are based on Western scientific techniques, the partners behind the platform recognize the value of Indigenous Science and Knowledge Systems for supporting Indigenous-led adaptation planning. In this context, Western climate science can be considered as an additional piece of information to support Indigenous Peoples, and their self-determined climate actions.
Choosing historical data:
Tips for using future climate data:
With so much climate data available, how do you know which dataset aligns best with your work? Table 1 describes some common types of historical climate datasets and their uses. The table includes summaries of four tips to guide you through the data selection process, mentioned in the first section of this article. Historical data is useful for contextualizing future projections but should not be used alone for future planning and design. The second section describes three tips for using climate projections in your work.
Table 1. Historical dataset types and some common uses
| 1) Adjusted and Homogenized Canadian Climate Data (AHCCD) | 2) Gridded interpolated datasets | 3) Reanalysis data | 4) Downscaled historical climate model data | |
| Description |
|
|
|
|
| Common uses |
|
|
|
|

Figure 1. Map showing the locations of AHCCD stations in northern Canada.
Adjusted and Homogenized Canadian Climate Data (AHCCD) provides long-term and high-quality historical climate information that has been thoroughly reviewed and quality controlled, as explained in Overview of Available Western Science-based Climate Data for Northern Canada. While there are a limited number of stations that provide AHCCD data in northern Canada, they provide robust information where they exist (see Figure 1). The AHCCD dataset is particularly suitable for the analysis of climate trends (see more information at 2023 AHCCD). Outside of AHCCD locations, one can consider using data from nearby locations at a similar elevation and with similar terrain to understand historical trends in climate data.
To determine whether an AHCCD location is reasonably representative of another location of interest, there are several factors to consider. These factors include the similarities between the locations’ topography, proximity to a waterbody or urban area, and how the climate information will be used in the project. For example, if the location of interest is next to a large water body, such as Great Bear Lake, even a relatively close station (e.g.,10 km away) may not be representative of local conditions even if the terrain is otherwise similar. If two locations are quite homogeneous with little variation in elevation and terrain, data from a more distant station (e.g., 25 km away) may be suitable for representing local climate conditions. For more general and descriptive applications of historical data, information from regional stations may be acceptable. However, for more specific applications, such as building design values, information would ideally be from stations that are as close as possible to the location of interest.
Adjusted precipitation datasets (that are part of AHCCD) consider and correct known errors in precipitation measurements. However, this dataset is still more uncertain than the equivalent temperature dataset due to difficulties associated with measuring precipitation accurately. This is true throughout Canada. This effect is especially noticeable in cold seasons because snowflakes are light and fall more slowly, meaning that wind can more easily interfere with snow measurements. This explains why winter precipitation datasets have more uncertainty than rain datasets.
Although there is some level of uncertainty associated with any observed data, the AHCCD dataset includes the best historical data we have for Canada and is most useful for considering historical climate trends. Box 4.1: An example of climate data inhomogeneity from Canada’s Changing Climate Report (2019) illustrates how changes at a weather station can impact the temperature record. 1
Temperature and total precipitation AHCCD datasets correct for these issues and others, and are available in the download section of ClimateData.ca.
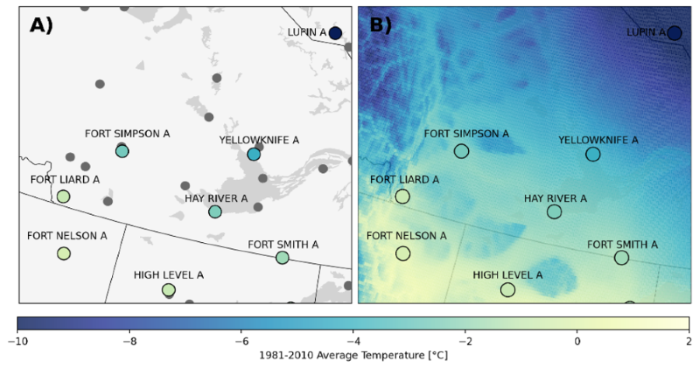
Figure 2. Illustrative example around Yellowknife of how weather station data can be interpolated to transform station data into gridded data. A) AHCCD stations noted with filled and outlined grey circles, with the average temperature for 1981-2010 noted by colour filled circles where available. B) The same AHCCD data points overlayed on the historical gridded dataset, NRCANMet, which is based on quality-controlled, unadjusted station data.
As described in the Overview of Available Western Science-based Climate Data for Northern Canada, gridded historical data is available from a variety of sources such as gridded interpolated observations, reanalyses, and modelled historical datasets. These datasets can be useful in areas where there is low station density. Deciding which gridded dataset to use will depend on the specific project. Further research may be required to determine exactly which dataset is most suitable.
Gridded interpolated observations (called gridded historical data on ClimateData.ca), like NRCANMET or PCIC-Blend, are a reliable source of temperature data . This holds true even in areas where stations are sparse. These types of gridded historical data, however, may be less effective at representing precipitation conditions due to the complex factors that drive local-scale precipitation, such as topography and proximity to bodies of water. 2
For some locations, reanalysis datasets or regional climate model (RCM) simulations driven by reanalyses may be a better source for precipitation estimates over the historical period.3
In areas with few observations and complex topography, gridded observational data might not give a clear picture of the local conditions. In such cases, reanalysis data can be a useful alternative.
An atmospheric reanalysis combines many observations (from weather stations, radar, satellites, etc.) with a weather model to create a spatially continuous dataset, filling in the gaps between observations by simulating weather and climate processes. This physics-based approach can provide more realistic spatial patterns for variables such as precipitation that vary greatly within a relatively small area due to atmospheric processes and factors such as topography.
Reanalysis also produces data on variables that are difficult to measure (e.g., snowfall) or are not often measured (e.g., temperatures at different heights in the atmosphere or soil temperatures). Reanalysis data, therefore, can potentially enable more in-depth climate analyses, especially for variables where there is little observed data.
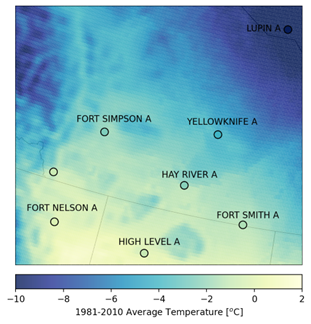
Figure 3. Average temperature around Yellowknife for 1981-2010 from ERA5-Land. Average temperatures for the same period from AHCCD stations show in black circles.
Reanalysis prioritizes physical consistency and realism; however, uncertainties exist in reanalysis data because no weather model or observation is perfect. If the observations that are incorporated into the model have some biases or discrepancies, it can affect the quality of the reanalysis data. Technical documentation and papers that discuss the methodologies used to construct datasets can provide readers with information on potential strengths and limitations of datasets. While it is important to be aware of these limitations, reanalysis data can provide good representations of climate conditions in areas with sparse observations or complex topography.
CaSR4 and ERA5-Land5 are two examples of reanalysis datasets that have coverage in northern Canada, both with resolutions of approximately 10km (ERA5-Land is shown in Figure 3). You can learn more about reanalysis data with the Quick Guide to Reanalysis Datasets.
In contrast, gridded observational datasets, like NRCANMet or PCIC-Blend are more grounded on real-world measurements and will more closely reflect available station data at locations with weather stations. This means that in well-observed areas, interpolated datasets may be as good as or better than reanalysis datasets.
Additionally, weather stations tend to be in towns and at airports; in mountainous regions these are often in valleys. This means that the station observations may not accurately represent the climate of the wider region. In these cases, a different historical data product may be more useful. For example, if you’re seeking historical data for the greater Whitehorse (YT) area, i.e., away from the Whitehorse airport, downscaled climate model data for the historical period can be helpful. Even though there may be weather stations nearby, mountainous or varying terrain can cause variations in climate that are not represented in the available observations. Using a downscaled model-based product may be beneficial since it can be more regionally representative, as illustrated in Figure 4.
For more information on choosing historical datasets in northern Canada, please refer to the Northern Climate Data Working Group Report.8
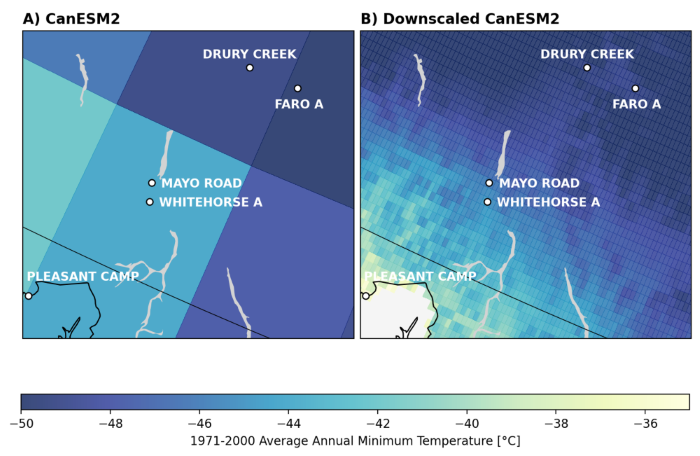
Figure 4. Illustrative example of downscaling climate model output around Whitehorse, YT, for 1981-2010 average annual minimum temperatures. (A) shows global climate model output from CanESM2, and (B) shows CanESM2 results that have been downscaled using NRCANMET data. White circles show AHCCD stations in the area.
It is important to incorporate future climate information in decision-making and business practices. Table 2 describes some best practices for the use of future climate data and some key points to remember. The subsequent section outlines some helpful tips and missteps to avoid when using climate projections.
Table 2. Best practices for the use of future climate data and some key points to remember
| 1) Use change values | 2) Factor in confidence levels | 3) Consider regional climate models (RCMs) | |
| Description |
|
|
|
| Key points |
|
|
|

Figure 5. Projected mean temperature by the end of the century (2071-2100) for Whitehorse, YT. (A) “Actual” values (B) Delta values, also known as change values, relative to the 1971-2000 baseline period.
In regions where historical observations are sparse, confidence in projections downscaled using observations may be low. One way to overcome the limitations of these datasets is to use change values (also known and labelled on ClimateData.ca as “delta” values) rather than using the “absolute” values that are produced by the model.
Change values represent the change between the future and past climates, for example between 2041-2070 and 1971-2000 (the baseline period used on ClimateData.ca). When we calculate this change, we are assuming that any warm, cold, wet, or dry biases in the climate simulations are consistent over time. Therefore, the change value represents the change in climate in response to the emissions scenario used in the climate model simulations. When calculating change values, it is best practice to calculate the 30-year change values for each individual climate model prior to calculating median and other percentile values.
The downscaled climate model data available on ClimateData.ca is provided as absolute values by default but can easily be viewed as change values by using the “absolute/delta” toggle. For example, the 30-year “absolute” average annual temperature for Whitehorse, Yukon, is projected to be 5.2°C by the end of the century under the SSP5-8.5 emissions scenario (Figure 5A). The projected temperature change value for Whitehorse is an increase of ~6.2°C by the end of the century compared to 1971-2000 under the same emissions scenario (Figure 5B).
A change value can be used on its own to inform decisions, used in combination with local knowledge to provide a better understanding of how the climate may change in the future, or it can be applied to observed climate conditions that share the same baseline period as the modelled data to get more locally specific values. For example, the change value of 6.2°C temperature increase in Whitehorse can be added to data from a community weather station, or to a reanalysis dataset that has values for 1971-2000 (see the Overview of Available Western Science-based Climate Data for Northern Canada). Based on the Canadian Climate Normals for 1971-2000, the annual average temperature in Whitehorse was -0.7°C . Combining this value with our change value of 6.2°C, gives us a “back of the envelope” annual average temperature of 5.5°C by the end of the century. When applying change values, it is best practice to consider a range of values from multiple emissions scenarios. Projected changes in basic variables, such as mean temperature and total precipitation, at annual, seasonal or monthly timescales can be applied to local observed weather data for the baseline period to obtain more locally-relevant future values.
Though the same method can be applied to local extreme values, be aware that extreme events behave differently than average climate conditions and a simple application of a change may not accurately reflect future extreme events. Change values for future periods compared to a 1971-2000 baseline are available on ClimateData.ca for many variables and thresholds, and for almost all locations across northern Canada. For more information on change values visit comparing and using station-based and gridded climate data (coming soon).
The outputs of climate models have different levels of confidence, depending on the variable (as discussed in the Overview of Available Western Science-based Climate Data for Northern Canada). For example, since the relationship between temperature and the atmosphere’s energy balance is well understood, temperature is considered a “high confidence” variable. Precipitation projections are considered “medium confidence” because modelling precipitation involves representing complex physical processes like cloud formation. Table 1. summarizes information from Section 5.1 from the Climate-Resilient Buildings and Core Public Infrastructure Report: Plain language summary on the confidence tiers for climate data. 9
Table 1. Information about climate variable confidence tiers based on the Climate-Resilient Buildings And Core Public Infrastructure Report Plain Language Summary (Section 5.1). 9
| Confidence Tier | Description | Example Variables |
| High | Specific values of change can be directly used in decision-making and planning (e.g., temperature increasing by 6.2°C by 2100) | Temperature (and temperature-related indices) |
| Medium | Projected change in values can be used in general risk assessments, but only the direction of change is generally considered in planning (e.g., precipitation increasing by 2100) | Precipitation |
| Low | Projected changes should only be used in an investigative manner for broad (regional/territorial/provincial) climate assessments | Wind, relative humidity |
For precipitation, this means that sometimes the direction of the trend (increasing or decreasing) can be more representative, and therefore higher confidence, than the exact amount of change. Because individual model results can vary in both direction and size of change for lower-confidence variables, it is helpful to look at trends from multi-model ensembles. These ensembles can give a clearer signal about the overall trend, even if the specific values from the individual models differ. For example, if a multi-model ensemble mean shows a 14% increase in summer precipitation by mid-century compared to the baseline time period, there is more confidence that there will be an increase in summer precipitation, on average, than there is about the exact extent of the change (e.g., if it will be 12%, 14% or 16%).
There are also some variables that are considered low confidence, such as wind and snow depth projections from global climate models. While it is still better to consider this data rather than to use no future data at all, this data should be used with caution, whether using the actual or change values. For example, a northern community planning to build a new water treatment facility or cultural centre, could consider future wind projections to identify whether wind-related risks could increase over time. While the exact wind speeds in the projections may be considered low confidence, wind speed data can still help guide discussions around building design especially when used alongside local and Indigenous Knowledge. Communities could explore a range of possible outcomes to design with more resilient and flexible solutions in mind, such as methods for reinforcing structures, selecting materials that can withstand a broader range of conditions, or planning for backup power sources. This approach allows the data to inform planning but acknowledges that some uncertainty exists and that there may be less confidence in some variables.
RCMs may produce better results compared to GCMs for climate extremes. RCMs typically have higher spatial resolutions than GCMs (~25 to 50 km compared to hundreds of kilometres, respectively). This allows RCMs to capture finer details of topography and to better represent processes such as convection (how warm air rises), land-surface interactions, and atmospheric dynamics. Additionally, RCMs often better simulate mesoscale processes, which are crucial for extremes, especially convective precipitation in summer or orographic snowfall in mountainous terrain. 3 These components are important for understanding cloud and storm formation and, therefore, precipitation patterns and extreme precipitation events. Some RCMs may also include lake models and better represent islands and coastlines. Therefore, RCMs may simulate variables like precipitation more accurately than GCMs, including in areas with low weather station density, areas adjacent to coastlines, areas with complex terrain and localized weather patterns, or areas with large or many lakes. The level of confidence we have in both RCM-derived change values and actual values for precipitation-related variables may be higher than that for GCM-derived results.

Figure 6. Diagram of a GCM (left) and RCM (right). [Source: Ouranos10]
RCM results are not currently available on ClimateData.ca, although some of the datasets provided on the site are based on RCM output. Data from the Climate-Resilient Buildings and Core Public Infrastructure Report8, that is also available through PCIC’s Design Value Explorer, is RCM-based (CanRCM4 LE). The freezing rain data on Ouranos’ Climate Portraits is from simulations of the fifth generation of the Canadian Regional Climate Model (CRCM5). Other RCM datasets such as CORDEX and CanLEAD are available as raw model outputs.
Like any climate model, RCMs can have biases and uncertainties. It is recommended to use results from several RCM runs (an ensemble) for a range of emissions scenarios (if available) so that the projected plausible range of climate change is considered, and to follow the other applicable tips above.
In summary, using climate data effectively for northern regions requires a thoughtful approach to selecting and analyzing both historical and future datasets. By leveraging high-quality data sources like AHCCD, considering elevation and proximity to weather stations, and applying best practices for interpreting future projections, climate analyses can support northern decision-makers in making climate-smart decisions. Climate data will continue to evolve and become more robust as the science advances. For practitioners, it is important to stay up to date with the latest methods and datasets for adaptation planning.
If you’re starting a project, have questions about using climate data, or want to confirm if you’re using the right data, you can get expert help (for free) from the Climate Services Support Desk, which can be contacted via ClimateData.ca or the Canadian Centre for Climate Services.
1 D Zhang, X., Flato, G., Kirchmeier-Young, M., Vincent, L., Wan, H., Wang, X., Rong, R., Fyfe, J., Li, G., Kharin, V.V. (2019). Changes in Temperature and Precipitation Across Canada; Chapter 4 in Bush, E. and Lemmen, D.S. (Eds.) Canada’s Changing Climate Report. Government of Canada, Ottawa, Ontario, pp 112-193. Accessed on: https://changingclimate.ca/CCCR2019/chapter/4-0/
2 Abbasnezhadi, K., & Wang, X. L. (2024). Comparison of Gridding Methods for Precipitation Over Canada and Assessment of Station and Data Density Effects on Gridding Results. Atmosphere-Ocean, 62(4), 320–346. https://doi.org/10.1080/07055900.2024.2394829
3 Diaconescu, E. P., Gachon, P., Laprise, R., & Scinocca, J. F. (2016). Evaluation of Precipitation Indices over North America from Various Configurations of Regional Climate Models. Atmosphere-Ocean, 54(4), 418–439. https://doi.org/10.1080/07055900.2016.1185005
4 Khedhaouiria, D., Gasset, N., Fortin, V., Dimitrijevic, M., Lauer, A.. et Bulat, M. (2025): Canadian Surface Reanalysis [CaSR] v3: ECCC hourly 0.1° surface reanalysis across North America [IN PREPARATION]
5 Muñoz-Sabater, J., Dutra, E., Agustí-Panareda, A., Albergel, C., Arduini, G., Balsamo, G., Boussetta, S., Choulga, M., Harrigan, S., Hersbach, H., Martens, B., Miralles, D. G., Piles, M., Rodríguez-Fernández, N. J., Zsoter, E., Buontempo, C., and Thépaut, J.-N. (2021) ERA5-Land: a state-of-the-art global reanalysis dataset for land applications, Earth Syst. Sci. Data, 13, 4349–4383, https://doi.org/10.5194/essd-13-4349-2021
6 McKenney, D.W., Hutchinson, M.F., Papadopol, P., Lawrence, K., Pedlar, J., Campbell, K., Milewska, E., Hopkinson, R.F., Price, D., Owen, T. (2011) Customized Spatial Climate Models for North America. Bull. Am. Meteorol. Soc. 92, 1611–1622. https://doi.org/10.1175/2011BAMS3132.1
7 Sobie, S.R., Ouali, D., Curry, C.L. & Zwiers, F.W. (2024) Multivariate Canadian Downscaled Climate Scenarios for CMIP6 (CanDCS-M6). Geoscience Data Journal, 11, 806–824. Available from: https://doi.org/10.1002/gdj3.257
8 Diaconescu, E.P., P. Kushner, J. Lukovich, A. Crawford, E. Barrow, L. Mudryk, M. Braun, R. Shrestha, S. Gruber, S. Déry, S. Howell, and L. Matthews, 2023: An inventory of historical climate data and climate projections for the Canadian North; Government of Canada, Gatineau, QC, 698p. Accessed on: https://nordata.physics.utoronto.ca/en/
9 Environment and Climate Change Canada (2022). Climate-Resilient Buildings and Core Public Infrastructure Report: Plain Language Summary. ISBN: 9780660421988. URL: https://climate-scenarios.canada.ca/?page=CRBCPI-general-summary
10 Understanding Climate Change—Climate modelling. (n.d.). Ouranos. Retrieved September 3, 2024, from https://www.ouranos.ca/en/science-du-climat-modelisation-climatique
This project was undertaken with the support of:


