Guidance on Using Relative Sea-Level Change Datasets

Relative Sea-Level Change (RSLC) is the change in ocean height relative to the coastline, namely, the sea-level change experienced by coastal communities and ecosystems.  High-resolution projections of RSLC are important for informing adaptation strategies to increase the resilience of Canada’s diverse coastal environments against climate change impacts.

Time to completion
16 min

Key messages

  • Climate change is driving changes in sea level, presenting adaptation planning challenges for coastal communities in Canada’s coastal regions.
  • Relative Sea-Level Change data combines global sea-level inputs (thermal expansion of the oceans, meltwater from glaciers, ice caps and ice sheets, and terrestrial water storage), with the vertical motion of the land.
  • High-resolution projections of Relative Sea-Level Change are important for informing adaptation strategies to increase the resilience of Canada’s diverse coastal environments against climate change impacts.

Understanding relative sea-level change in Canada

Climate change is driving changes in sea level, presenting adaptation planning challenges for coastal communities in Canada’s coastal regions. Anticipated global sea level rise could surpass one metre by the end of the century1. However local changes in sea level can differ substantially from the projected global average change due to factors like local vertical land motion, namely, subsidence (sinking) and post-glacial rebound (uplift). As a result, high-resolution sea-level projections are important for informing adaptation strategies to increase the resilience of Canada’s diverse coastal environments and ensure the safety of coastal communities.

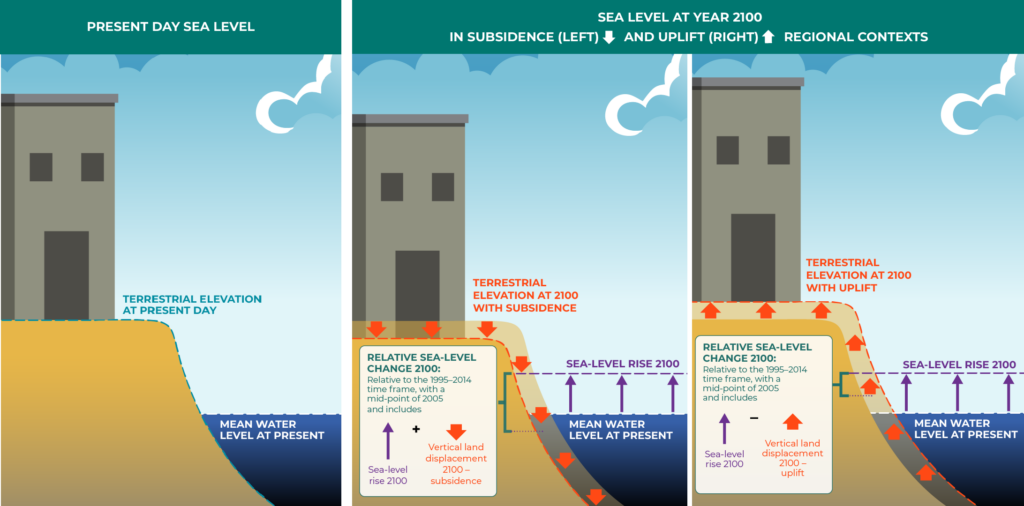
Relative sea-level change is the change in ocean level relative to the land. It includes the effects of global sea-level rise and local vertical land motion. It varies over time and is key to understanding the risks of coastal flooding that could impact local infrastructure, ecosystems, and communities.2 Local influences on relative sea-level change include local vertical land motion, oceanographic currents, and gravitational forces.3 For this reason, projected relative sea-level change can vary greatly across the country. During the coming century, some places in Canada are projected to experience relative sea-level increases that are higher than the global average, while others may experience decreasing relative sea levels due to upward land motion that is faster than the sea-level rise associated with climate change.3

Global sea-level rise

Global sea-level rise is driven by the following interconnected processes collectively:

Thermal expansion of the oceans
Seawater volume expands when it absorbs heat, a process called thermal expansion. Thermal expansion is the main driver of global sea-level rise. As global temperatures increase, seawater volume increases, resulting in rising global sea-levels.

Meltwater from glaciers, ice caps, and ice sheets
Meltwater from glaciers, ice caps, and the Antarctic and Greenland ice sheets contribute to global sea-level rise. As ice masses melt, not only do they release substantial amounts of freshwater into the oceans, but the thinning ice also leads to land uplift. Additionally, as the mass of these ice sheets diminishes, their reduced gravitational pull lowers regional sea levels, adding spatial complexity to sea-level change.

Terrestrial water storage
Changes in terrestrial water storage, including water from rivers, lakes, wetlands, snowpack, permafrost, soil moisture, and human-made reservoirs, influence regional sea-level change. In particular, holding back water (impoundment) with the construction of new dams and groundwater pumping can affect sea-level change.

Vertical land motion

Vertical land motion is the uplift or sinking (subsidence) of the Earth’s surface (Figure 1). In Canada, an important process driving vertical land motion is post-glacial rebound (also known as glacial isostatic adjustment). During the last ice age, which reached its peak about 20,000 years ago, the weight of the ice sheets that covered most of Canada lowered the surface of the Earth under the ice, while regions near the edges of the ice sheets rose. Deep in the Earth, mantle material flowed in response to this surface load. When the glaciers and ice sheets thinned and retreated, the depressed central regions started to rise, while the elevated regions sank. Post-glacial rebound is still taking place, thousands of years after the ice sheets thinned and shrank to the present-day remnant ice caps in the High Arctic.

At shorter time scales, there is also an effect sometimes termed “sea-level fingerprinting”. When glaciers melt and lose mass, an immediate elastic response of the solid Earth causes land uplift under the glacier. A simultaneous decrease in gravitational attraction lowers the surface of the nearby ocean. These effects are incorporated into global models of sea-level change.

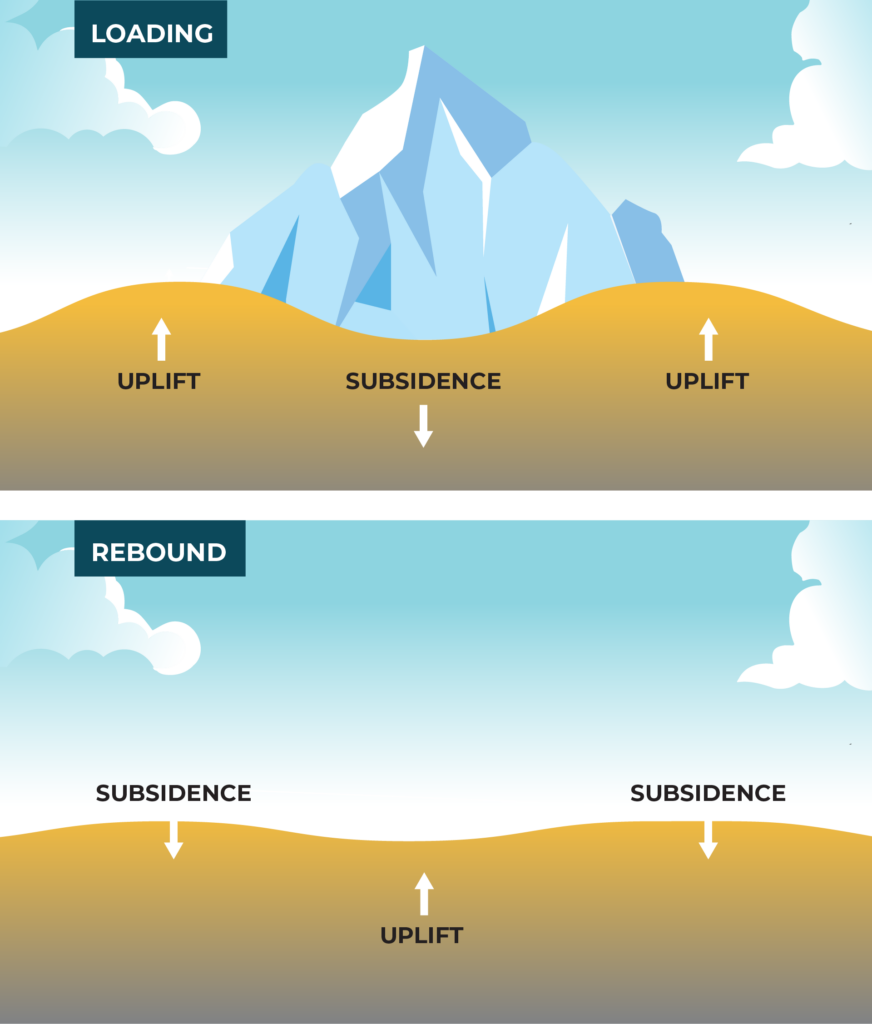
Figure 1. These diagrams show the response of the Earth (top – Loading) to the growth of a glacier or ice sheet on the Earth’s surface, and (bottom – Rebound) the response after the load is removed.

Regional variations in relative sea-level change across Canada

Relative sea-level changes in Canada exhibit significant regional variations that can diverge from the overall trend of rising global sea-level. Relative sea-level rise is projected to be higher in parts of Atlantic Canada compared to the global average because the coastal land mass is sinking in many areas. As sea levels rise, the frequency and magnitude of extreme water-level events will also increase in the coming century.3 Conversely, areas like Hudson Bay, Nunavut, and northern Québec (i.e., Nunavik) are projected to experience decreases in relative sea levels due to postglacial rebound causing the land to rise faster than sea levels are rising.4

Additionally, ocean currents play a crucial role in redistributing heat and salinity, potentially amplifying sea-level rise in specific regions. For example, forces associated with the Gulf Stream depress the surface of the ocean but a weakening of the Atlantic Meridional Overturning Circulation (AMOC) over the coming decades, and consequently a weakening of the Gulf Stream, could result in an additional effect causing sea levels to rise.

Understanding these regional differences is important for accurate projections of Relative Sea-Level Change (RSLC) at locations in Canada, where specific regional features and their associated projections vary.

The crustal velocity model used for the Relative Sea-Level Change data available on ClimateData.ca is based on measurements of land motion made on bedrock. In locations where there are thick deposits of unconsolidated sediment, such as sand and silt, sediment compaction may lead to additional ground subsidence not reflected in the crustal velocity model. Similarly, groundwater pumping may lead to enhanced rates of subsidence. Consequently, in locations where there is local knowledge of vertical land motion, the sea-level projections should be adjusted to incorporate this information.

Technical Note

The crustal velocity values used for generating the relative sea-level projections are provided on the timeseries plots so technical specialists can adjust projections to incorporate local knowledge of vertical land motion.


What are the relative sea-level change datasets available on ClimateData.ca?

To help Canadians prepare for projected sea-level changes, Natural Resources Canada (NRCan) has developed a new dataset of present and future relative sea-levels6. The dataset provides projections for Relative Sea-Level Change (RSLC), which is the change in ocean height relative to the coastline, namely, the sea-level change experienced by coastal communities and ecosystems.

Figure 2. Representation of sea level at present and at 2100 in relation to regional vertical land motion in the context of subsidence and uplift. A subsiding land surface makes sea-level rise appear greater than in areas where there is uplift of the land surface. Relative Sea-Level Change data is available on ClimateData.ca.

The latest RSLC data available on ClimateData.ca is from the Coupled Model Intercomparison Project Phase 6 (CMIP6), released in 2021. CMIP6 represents an evolution in the data provided in CMIP5, offering updated and enhanced information. In both cases, the original datasets have been downscaled for practical use on ClimateData.ca.

ClimateData.ca enables quick and easy visualization of the dataset as well as access to values for the entire coastline of Canada. In addition, this pan-Canadian dataset allows standardized comparison between different sites across provinces and territories.

Technical Note

For CMIP5, projections are available at a resolution of 0.1° (approximately 11 km latitude, 2 to 8 km longitude), for 2006 and every decade from 2010 to 2100, relative to the 1986 to 2005 baseline period. The CMIP6 projections are available at a resolution of 0.1° (approximately 11 km latitude, 2 to 8 km longitude) for every decade from 2020 to 2150, relative to the 1995 to 2014 baseline period. Learn more about the data.


Projected sea-level change in this dataset includes the effects of changes in glacier and ice-sheet mass loss, thermal expansion of the oceans, changing ocean circulation conditions, and human-caused changes in land water storage2. A land motion model developed by the Canadian Geodetic Survey7,8 was used to create this dataset, replacing the land motion values used by the CMIPs with a model that reflects effects of nearby and regional projected ice mass change for sites in Canada.

For more information on the models of vertical land motion and sea-level change, please see the RSLC variable description.

How do the CMIP6 projections differ from the previous ones (CMIP5)?

CMIP6 model projections have many similarities to those from CMIP5. However, the results of the CMIP6 experiment represent several years of scientific advancement over CMIP5, particularly in terms of some processes relating to global sea level rise. When starting new projects, it is recommended to use the CMIP6 results.12 Past or ongoing projects using CMIP5 results are still valid, however, for projects using CMIP5 results, it is advisable to compare results to CMIP6.

When comparing relative sea-level change data between the CMIP5 and CMIP6 datasets, notable differences emerge, especially towards the end of the century. While the two datasets are in general agreement at most Canadian locations, discrepancies do appear in certain areas, such as Hudson Bay.

For Hudson Bay (near Churchill) and the Northwest Territories (near Tuktoyaktuk/Tuktuyaaqtuuq), CMIP6 projects higher sea levels than CMIP5. This difference in projected sea-levels can be attributed to the updated modeling of the Greenland Ice Sheet’s impact in the CMIP6 models. As Greenland’s ice melts, it reduces the gravitational pull on nearby waters, leading to higher sea-levels further away. This effect, known as the “sea-level fingerprint,” is more pronounced in the updated projections, suggesting a greater impact on sea levels in these regions due to changes in ice mass and the subsequent response of the Earth’s elastic crust.

Figure 3: Projected relative sea-level change in 2100 for AR5 (CMIP5 RCP8.5 – top left) and AR6 (CMIP6 SSP5-8.5 – top right) and the difference between the two (bottom; SSP5-8.5 – RCP8.5). [Source: James, T.S and Anslow, F. (NRCan)]

Guidance on the Use of this Dataset

How can the future projections dataset be used?

Relative sea-level change projections, when combined with other types of data such as estimates of storm surge, waves, tides, and additional local-scale vertical land motion—including subsidence of river deltas or coastal marshes—can significantly contribute to coastal flood risk assessments and inform strategic adaptation decisions. For additional coastal datasets available for Canada, scroll to the Additional Resources section.

Moreover, datasets like RSLC and Vertical Allowances (see Additional Resources section below) can be instrumental in conducting detailed risk assessments, designing resilient infrastructure, and crafting robust adaptation strategies. By considering relevant projections and allowances, communities are better equipped to develop and execute plans that increase their resilience to the impacts of regional sea-level change and extreme water-level events.

Guidance on emissions scenarios for the latest RSLC data (CMIP6)

Sea-level projections are available for four Shared Socio-Economic Pathways (SSPs)  (SSP1-2.6, SSP2-4.5, SSP3-7.0, SSP5-8.5) as reported in the Sixth Assessment Report of the IPCC.1,2 For each scenario, the lower, median, and upper estimates of the likely range of projected relative sea-level change are provided, corresponding to the 17th, 50th, and 83rd percentiles of the full ensemble of global climate models.

Two low-probability but high-impact scenarios are also provided. The first (SSP5-8.5 High ice sheet loss A) is based on CMIP6 low-confidence projections that incorporate additional information on Antarctic Ice Sheet stability. This projection lies above the upper envelope of the SSP5-8.5 scenario. The second (SSP5-8.5 High ice sheet loss B) is based on an approach from Van de Waal et al.12 that was co-developed by scientists and practitioners by combining physical evidence and approaches currently used in policy environments. This scenario is equivalent to the 98.33rd percentile of the medium confidence SSP5-8.5 projection.

For long-term decisions that may be influenced by sea-level changes, the precautionary principle would imply the use of at least the 83rd percentile values of the SSP5-8.5 scenario. In the case of very low tolerance to risk and for very long project timeframes, it may be appropriate to consider the two low-probability but high-impact scenarios.

For more details, see the technical guidance on the use of sea-level projections6, or read and access the full publication and data. Learn more about the CMIP5 dataset including emissions scenarios.

The future is uncertain, and we don’t know exactly what it will look like, including how global emissions responsible for climate change will evolve. To address this uncertainty, multiple emissions scenarios have been developed to frame a range of potential futures. Considering multiple scenarios is the best practice to account for this uncertainty.

For more information on emissions scenarios, see ClimateData.ca: Understanding Shared Socio-economic Pathways (SSPs), and Introduction to Decision Making Using Climate Scenarios.

Additional Resources

  • Vertical Allowance (ClimateData.ca): Developed by Fisheries and Oceans Canada, Vertical Allowances are recommended heights to be added to an infrastructure design based on a combination of historical and future coastal water levels. Gridded CMIP6 data is available at a resolution of 0.1° (approximately 11 km latitude, 2 to 8 km longitude) from 2020 to 2150 for multiple emissions scenarios.
  • Canadian Extreme Water Level Adaptation Tool (CAN-EWLAT): CAN-EWLAT is a planning tool developed by Fisheries and Oceans Canada for climate change adaptation of coastal infrastructure related to future water-level extremes and changes in what is known as, wave climate. Wave climate is the distribution of wave height, period, and direction averaged over a period of time for a particular location. The tool includes 1) Vertical Allowances and 2) wave climate along with sea-level change at tide gauges and small craft harbour locations (not gridded).
  • CanCoast – Coastal Materials Version 2.0: Geospatial database of the physical characteristics of Canada’s marine coasts. Includes both feature classes that are not expected to change through time, and feature classes that are expected to change as climate changes e.g., wave-height change with sea ice, sea-level change, ground ice content, coastal materials, tidal range, and backshore slope.
  • Canadian Coastal Climate Risk Information System: Developed by National Research Council Canada, the web application hosts numerical simulations of storm surges and waves in British Columbia coastal waters under historical and future climate (RCP8.5) scenarios. The project is the first of its kind to utilize unstructured, computational models to simulate storm surges and waves for the entire western Canada coastal region, while maintaining the high spatial resolution in coastal sub-basins needed to capture local dynamic responses.
  • Coastal Adaptation Toolkit: Includes two online tools – one for Communities, and one for Property Owners – and a companion resource containing three guidance documents. To help communities and property owners build awareness of their coastal environment, their different adaptation options available, and the applicability of the options under different scenarios.

References

  1. Fox-Kemper, B., H.T. Hewitt, C. Xiao, G. Aðalgeirsdóttir, S.S. Drijfhout, T.L. Edwards, N.R. Golledge, M. Hemer, R.E. Kopp, G. Krinner, A. Mix, D. Notz, S. Nowicki, I.S. Nurhati, L. Ruiz, J.-B. Sallée, A.B.A. Slangen, and Y. Yu, 2021. Ocean, Cryosphere and Sea Level Change. In Climate Change 2021: The Physical Science Basis. Contribution of Working Group I to the Sixth Assessment Report of the Intergovernmental Panel on Climate Change [Masson-Delmotte, V., P. Zhai, A. Pirani, S.L. Connors, C. Péan, S. Berger, N. Caud, Y. Chen, L. Goldfarb, M.I. Gomis, M. Huang, K. Leitzell, E. Lonnoy, J.B.R. Matthews, T.K. Maycock, T. Waterfield, O. Yelekçi, R. Yu, and B. Zhou (eds.)]. Cambridge University Press, Cambridge, United Kingdom and New York, NY, USA, pp. 1211–1362, DOI: 10.1017/9781009157896.011.
  2. IPCC, 2023: Climate Change 2023: Synthesis Report. Contribution of Working Groups I, II and III to the Sixth Assessment Report of the Intergovernmental Panel on Climate Change [Core Writing Team, H. Lee and J. Romero (eds.)]. IPCC, Geneva, Switzerland, pp. 35-115, doi: 10.59327/IPCC/AR6-9789291691647.
  3. Greenan, B.J.W., James, T.S., Loder, J.W., Pepin, P., Azetsu-Scott, K., Ianson, D., Hamme, R.C., Gilbert, D., Tremblay, J-E., Wang, X.L. and Perrie, W. (2019): Changes in oceans surrounding Canada; Chapter 7 in (eds.) Bush and Lemmen, Canada’s Changing Climate Report; Government of Canada, Ottawa, Ontario, p. 343–423.
  4. Lemmen, D.S., Warren, F.J., James, T.S. and Mercer Clarke, C.S.L. editors (2016): Canada’s Marine Coasts in a Changing Climate; Government of Canada, Ottawa, ON, 274p.
  5. Hu, A., & Bates, S. C. (2018). Internal climate variability and projected future regional steric and dynamic sea level rise. Nature communications9(1), 1068.
  6. James, T.S., Brierley-Green, C., and Anslow, F., 2024. Relative Sea-level Projections for Canada based on the IPCC Sixth Assessment Report and the NAD83v70VG National Crustal Velocity Model; in preparation, Geological Survey of Canada Open File.
  7. Robin, C.M.I., Craymer, M., Ferland, R., James, T.S., Lapelle, E., Piraszewski, M., and Zhao, Y., 2020. NAD83v70VG: A new national crustal velocity model for Canada; Geomatics Canada, Open File 0062, 1 .zip file,  https://doi.org/10.4095/327592
  8. Canadian Geodetic Survey. (2019). NAD83(CSRS) v7. https://webapp.geod.nrcan.gc.ca/geod/tools-outils/nad83-docs.php
  9. IPCC, 2014: Climate Change 2014: Synthesis Report. Contribution of Working Groups I, II and III to the Fifth Assessment Report of the Intergovernmental Panel on Climate Change[Core Writing Team, R.K. Pachauri and L.A. Meyer (eds.)]. IPCC, Geneva, Switzerland, 151 pp.
  10. Church, J.A., P.U. Clark, A. Cazenave, J.M. Gregory, S. Jevrejeva, A. Levermann, M.A. Merrifield, G.A. Milne, R.S. Nerem, P.D. Nunn, A.J. Payne, W.T. Pfeffer, D. Stammer and A.S. Unnikrishnan, 2013a. Sea Level Change. In: Climate Change 2013: The Physical Science Basis. Contribution of Working Group I to the Fifth Assessment Report of the Intergovernmental Panel on Climate Change [Stocker, T.F., D. Qin, G.-K. Plattner, M. Tignor, S.K. Allen, J. Boschung, A. Nauels, Y. Xia, V. Bex and P.M. Midgley (eds.)]. Cambridge University Press, Cambridge, United Kingdom and New York, NY, USA.
  11. Church, J.A., P.U. Clark, A. Cazenave, J.M. Gregory, S. Jevrejeva, A. Levermann, M.A. Merrifield, G.A. Milne, R.S. Nerem, P.D. Nunn, A.J. Payne, W.T. Pfeffer, D. Stammer and A.S. Unnikrishnan, 2013b. Sea Level Change Supplementary Material. In: Climate Change 2013: The Physical Science Basis. Contribution of Working Group I to the Fifth Assessment Report of the Intergovernmental Panel on Climate Change e [Stocker, T.F., D. Qin, G.-K. Plattner, M. Tignor, S.K. Allen, J. Boschung, A. Nauels, Y. Xia, V. Bex and P.M. Midgley (eds.)]. Available from climatechange2013.org and www.ipcc.ch.
  12. van de Wal, R. S. W., Nicholls, R. J., Behar, D., McInnes, K., Stammer, D., Lowe, J. A., et al. (2022). A high-end estimate of sea level rise for practitioners. Earth’s Future, 10, e2022EF002751. https://doi.org/10.1029/2022EF002751