Get Climate Smart: Floods and Droughts

Are you wondering how climate change will influence the frequency or severity of floods and droughts where you live? You’re not alone. The Support Desk at the Canadian Centre for Climate Services (CCCS) regularly receives questions on this topic from Canadians across the country. The CCCS is here to help and can be reached through their web form, email ([email protected]), phone (1-833-517-0376), or the ClimateData.ca ‘Have a question?’ form. Keep reading to learn more about the potential effects of climate change on floods and droughts in Canada.

The Support Desk at the Canadian Centre for Climate Services (CCCS) frequently receives inquiries about how climate change will affect specific regions, including the potential for increased severity of droughts or increased frequency of floods. We offer guidance on accessing future climate projections for specific variables that our clients can use to assess their vulnerabilities and risks related to drought and floods.

What kind of information can I find to help understand my risks for flooding and drought?

1. ClimateData.ca

ClimateData.ca provides many different datasets and variables that relate to flooding and drought hazards. Here we will cover some of the most relevant ones:

  • Flood-related
    • Short-duration Rainfall IDF Data relate short-duration rainfall intensity with its frequency of occurrence. This is often used for flood forecasting and urban drainage design.  Extreme rainfall is projected to increase in Canada as the climate warms. Intense precipitation can lead to storm drains being overwhelmed, bridges being washed out, and landslides, for example. IDF data provide information on extreme rainfall events that engineers and planners can use to inform their plans and actions.
    • Relative Sea level change is the change in ocean level relative to land. Relative sea level change could increase the occurrences of coastal flooding in many areas of Canada. Sea-level change data combined with storm surges and wave data provides insights into the risks of damage to coastal infrastructure and ecosystems due to climate change.
    • Precipitation variables like Total Precipitation, Wet Days > 20mm, Maximum 1-Day Total Precipitation and others can all help demonstrate how seasonal and annual patterns of precipitation are likely to change in the future.
  • Drought-related
    • Air temperature variables such as Hottest Day or Days with Tmax > 30°C / >32°C influence evaporation rates and are key for understanding the potential for drought-like conditions.
    • The Maximum Number of Consecutive Dry Days describes the longest spell of days where less than 1mm of precipitation falls per day. Drought conditions may result when hot, dry periods occur frequently and/or are long-lasting.
    • The Standardised Precipitation Evapotranspiration Index (SPEI) is a drought index based on the difference between precipitation and potential evapotranspiration. Negative SPEI values indicate a water deficit, where potential evapotranspiration exceeds precipitation. Positive values indicate the opposite, a water surplus. The SPEI index is used by the agricultural sector and even has some applications in wildfire planning.


Example Map: Number of Wet Days >= 10 mm

Decade
Opacity

2. The Climate Atlas of Canada

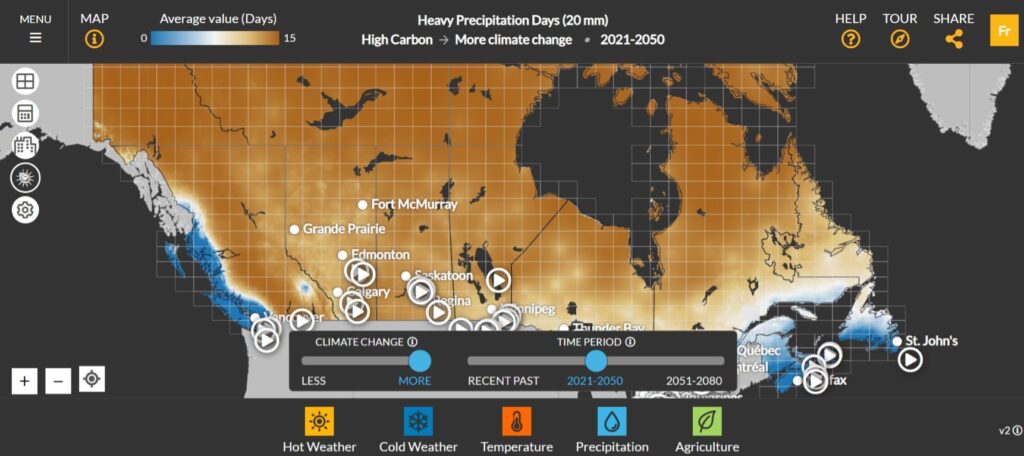
Similar to ClimateData.ca, the Climate Atlas includes several future climate variables that are related to droughts and floods, including “Dry Days”, “Extremely Hot days”, “Number of Heat Waves”, “Heavy Precipitation Days” and “Max 1-day Precipitation.”

The Climate Atlas contains several great articles and videos including “Wildfires, Water, and Our Health”, which explains more about the relationships between drought and wildfire, and “Storms of the Future”, a short video on storms and flooding in Nova Scotia.

A great feature on the Climate Atlas, similar to ClimateData.ca, is that you can click on any grid cell or area on the map and a time series graph for the variable you selected will be displayed. From here, you can access more information like detailed climate data that includes more charts, extra downloads such as climate reports in PDF format and data in CSV format. The basic Climate Reports provide region-specific climate information and an easy-to-read synthesis of climate data.

3. Infrastructure Canada’s Climate-Resilient Buildings and Core Public Infrastructure Initiative

Floods can have a huge impact on infrastructure and periodically we receive requests from Canadians who are applying for infrastructure grants. For grant applications relating to infrastructure, we often direct people to Infrastructure Canada’s Climate-Resilient Buildings and Core Public Infrastructure Initiative, specifically the report “Climate-Resilient Buildings and Core Public Infrastructure: an assessment of the impact of climate change on climatic design data in Canada .” This report provides an assessment of how climatic design data relevant to users of the National Building Code of Canada (NBCC 2015, Table C-2) might change as the climate continues to warm. This report has projections for climatic design variables such as temperature, precipitation and moisture, wind pressures, and snow and ice. This is a good place to get detailed information about how to include climate change considerations in a building design, and in grant applications related to infrastructure.

4. Regional and Provincial Information

There are several places where regional/provincial information on flood preparedness and risk can be found. Detailed information on current local floods is also listed on these sites:

5. National Reports

  1. In the National Issues Report led by Natural Resources Canada (2021), there is a whole chapter on water resources (Chapter 4) that includes information on water availability, water quality issues and water-related natural hazards like floods and droughts. These issues are explored through case stories such as Case Story 4.1 that discusses extreme water level variability on the Great Lakes. Flood management in Canada is also highlighted in box 4.1. In addition, floods and droughts are discussed in more detail in section 2: Climate Risks.
  2. Canada’s Changing Climate Report led by Environment and Climate Change Canada (2019) is full of information and resources about climate change in Canada. The list of headline statements from this report highlights that: A warmer climate will intensify some weather extremes in the future.
    • Extreme hot temperatures will become more frequent and more intense. This will increase the severity of heatwaves and contribute to increased drought and wildfire risks.
    • More intense rainfalls will increase urban flood risks.
    • Coastal flooding is expected to increase in many areas of Canada due to sea level rise.
    • The loss of sea ice in Arctic and Atlantic Canada further increases the risk of damage to coastal infrastructure and ecosystem as a result of larger storm surges and waves.


Moreover, Chapter 6: Changes in Freshwater Availability Across Canada discusses potential impacts of climate change on freshwater systems and what this can mean for floods and droughts. Some relevant sections include:

6. The Map of Adaptation Actions

The Map of Adaptation Actions is a tool that allows users to search for and explore case studies of communities and sectors in Canada that are adapting to our already changing climate.

To find inspiration through concrete examples of how Canadian communities are preparing for and adapting to more frequent floods and droughts you can search the map by filtering for drought or flooding and then browse relevant case studies on the map. Here are three examples:

  1. Building Climate Change Adaptation Capacity of First Nations in Far Northern Ontario Through Knowledge Exchange and Collaboration illustrates how collaboration and knowledge sharing helped to build climate change adaptation capacity in First Nations communities in northern Ontario. Climate impacts such as droughts and floods were considered in this initiative.
  2. Government of the Northwest Territories’ (NWT) Department of Transportation’s  Change and Challenge: Climate Change Adaptation Plan for the GNWT Department of Transportation., which showcases how flooding was an important consideration in developing a climate change adaptation plan.
  3. Courtenay River Municipal Natural Assets Initiative highlights how the city of Courtenay in BC explores using natural assets in the Courtenay River corridor to mitigate flood risks.

Contact Us

The Climate Services Support Desk is here to help Canadians find the information they need to better understand how climate change may affect their lives and communities. Whether you have questions about specific data or science related to climate change, or you’re looking for general information on how to adapt to changing weather patterns and environmental conditions, the Support Desk is here to help.

If you’re not sure where to start or if you have specific questions, we encourage you to reach out to the Support Desk directly. Simply click the “Have a question?” button at the top of the ClimateData.ca homepage, and one of our trained professionals will be happy to assist you. Don’t hesitate to reach out – we’re here to help you find the answers you need.