In this series, we take a deep dive into the many climate change maps available on ClimateData.ca. This month, we are focusing on maps showing projected changes in the number of days per year with a minimum temperature less than -25 °C. The number of these “cold days” is an important threshold, as we will discuss below.
Why Cold Days Matter
Cold weather is an important aspect of life in Canada. Many places in Canada are well adapted to very cold winters. Cold temperatures affect our health and safety, determine what plants and animals can live in the area, limit or enable outdoor activities, define how we design our buildings and vehicles, and shape our transportation and energy use.
Deciphering the Map’s Message
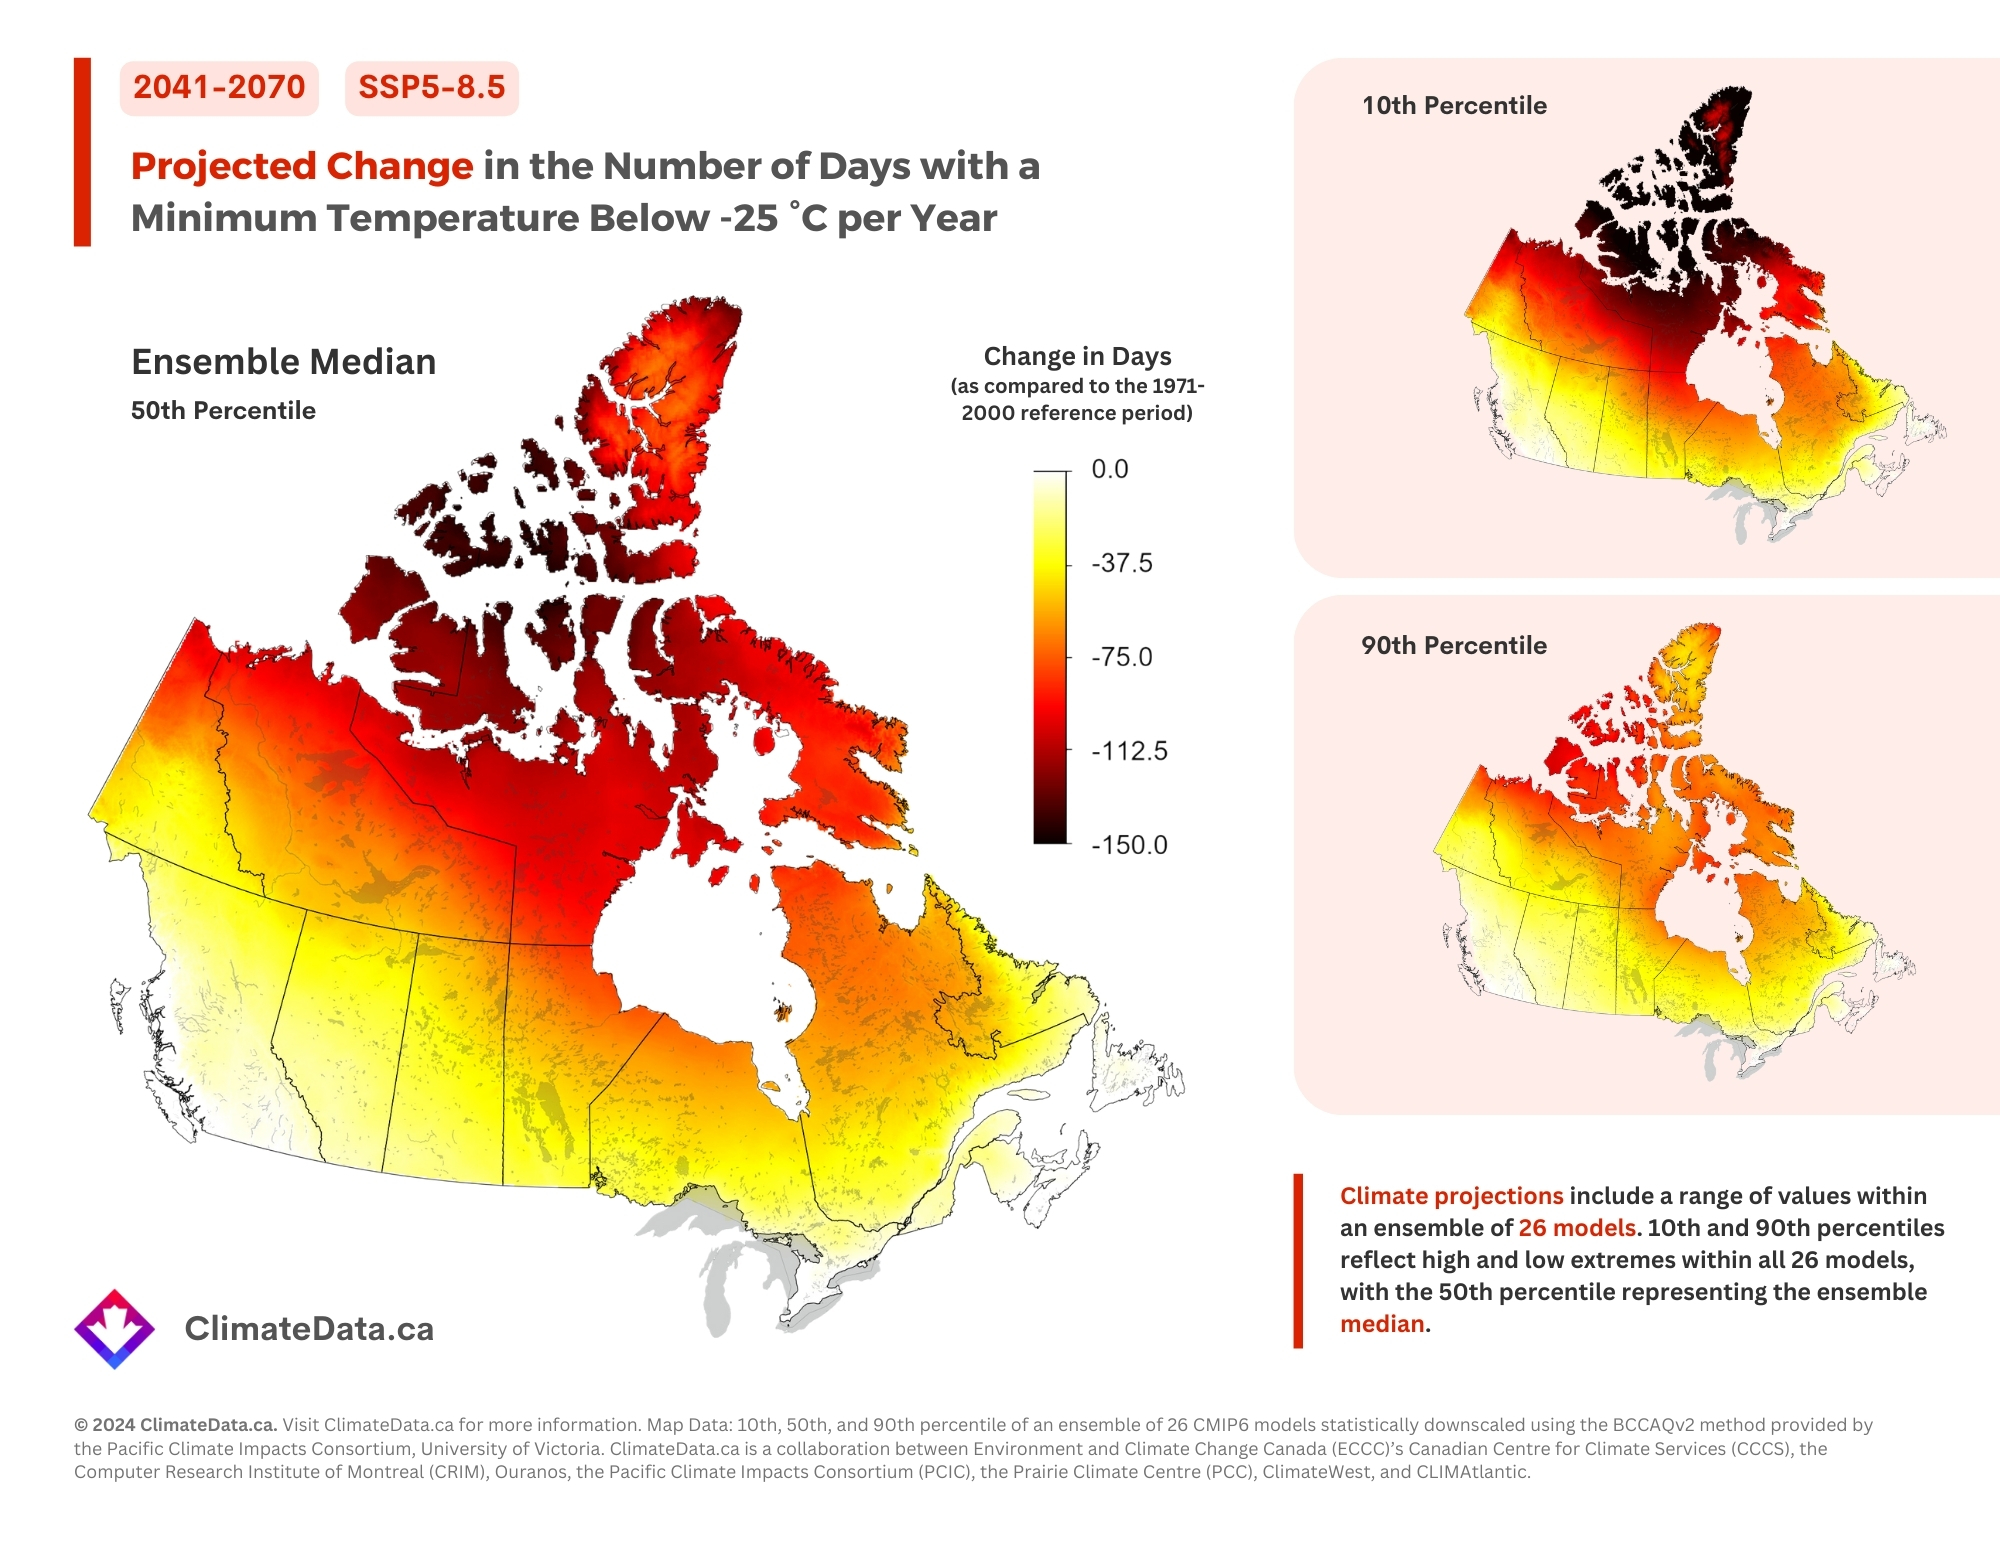
We call the map below a delta map. It shows the change in the number of days with a minimum temperature below -25 °C per year between the historical baseline (1971-2000) and the projected future (2071-2100) under SSP5-8.5, the climate change scenario resulting in the most warming on ClimateData.ca. To learn more about the importance of using 30-year time periods when examining changes in climate, visit our learning zone article on the subject.
Why are there three maps on the image below?
The future climate remains uncertain, primarily due to unknowns in future greenhouse gas emissions, but also due to model assumptions and differences amongst models, as discussed in our Learning Zone article on model uncertainty.
The large, main map shows the multi-model ensemble median value, and the two smaller maps show the 10th and 90th percentile. Combined, the three maps illustrate a more complete range of projected future changes in -25 °C days for this future period and emissions scenario than you would get from just a single map. Read our Learning Zone article on multi-model ensembles to learn more about percentiles.
Map Insights
These maps illustrate the very large changes in cold days across Canada that are likely under the SSP5-8.5 scenario. The most pronounced loss of cold is expected in northern regions, which currently experience a higher frequency of such days. In some areas, the decrease may reach up to 150 days per year compared to the recent past, as indicated by the 10th percentile inset map.[1] Both the ensemble median and the 90th percentile maps show a widespread decrease in cold days throughout the country, albeit to varying extents.
These data underscore the need to assess the impacts and risks associated with ongoing climate change, in this case, emphasizing the changes projected under the highest emissions scenario, end-of-century, and upper percentile of the multi-model ensemble. This shift suggests major impacts on natural ecosystems and human activities that depend on extreme cold. The diminishing cold will notably influence infrastructure planning and economic activities that are sensitive to extreme cold conditions.
Important map caveats
On ClimateData.ca, SSP5-8.5 is the scenario with the highest amount of climate change by end of century. Not shown here are the SSP2-4.5 and SSP1-2.6 scenarios. SSP2-4.5 is a “moderate” emissions scenario. SSP1-2.6 is the lowest emission scenario on ClimateData.ca. To learn more about emission scenarios, please visit our learning zone article on the topic.
Browse more maps and data
To browse more maps on ClimateData.ca, including projected changes in -25 °C days under different time periods and scenarios, please visit our interactive map page.
[1] If it appears that the 10th and 90th percentile values are reversed in these delta maps, it is important to understand that they represent negative values (a decrease from the baseline). Therefore, the 10th percentile, which typically indicates the lower end of the ensemble, actually shows the largest decreases in this context.