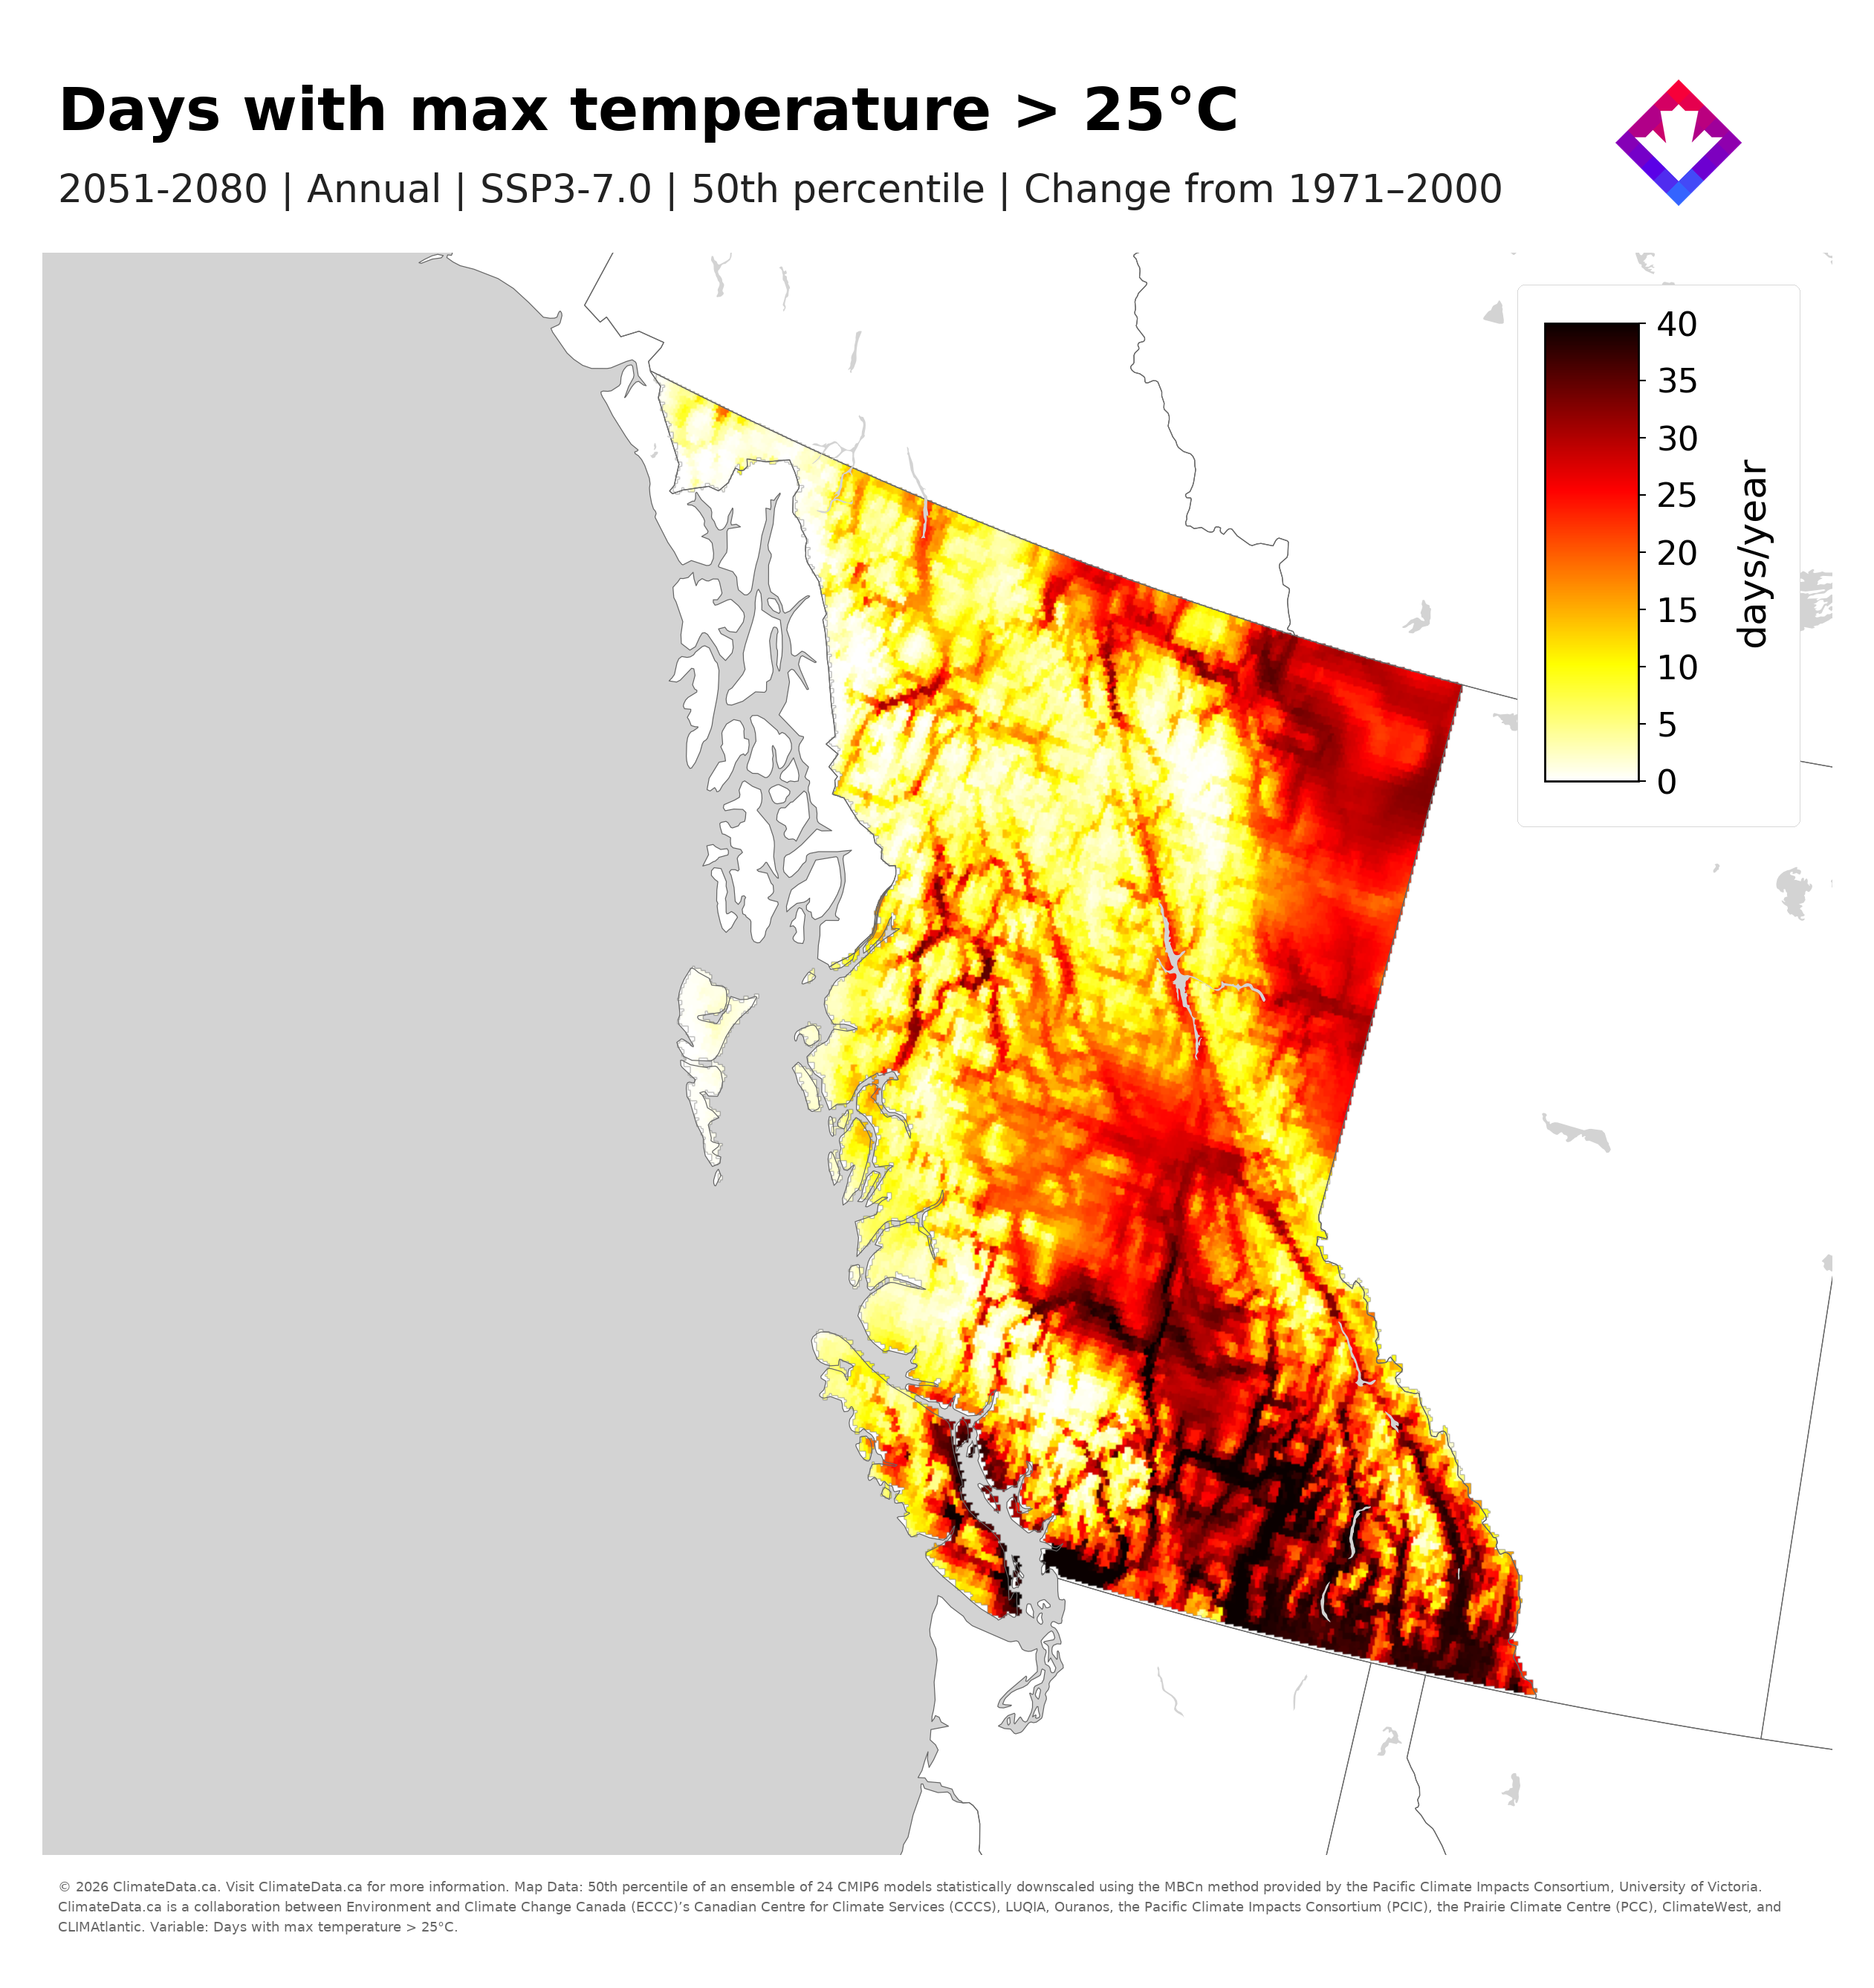
Seasonal Perspectives: A look at the spring and summer 2026 seasonal forecasts for British Columbia

Date June 2, 2026
Author Frances Delaney and Hayley Dosser, Canadian Centre for Climate Services
Topics Case studies, Seasonal to decadal forecasts
Share this post

Introduction

Parts of British Columbia are entering the 2026 spring and summer season under abnormally dry conditions according to the Canadian Drought Monitor. Below-average snowpack, ongoing drought, and warmer-than-normal temperatures have raised concerns about water availability and wildfire risk across southern and central parts of the province.

This article looks at how seasonal forecasts and longer-term projections of temperature and precipitation obtained from ClimateData.ca can be used to better understand conditions over the coming months and decades, as well as to help put this year’s challenges into context.

Box 1: Current State of Wildfires in BCAs of May 14th, 22 wildfires were burning across British Columbia, following 93 wildfire starts reported during the month of April [1]. Of the active fires, four were currently classified as “out of control,” three were considered to be “being held,” while the remainder were listed as “under control” [2] (Figure 1). Historical wildfire activity maps for the same date in previous years are available through the Canadian Wildland Fire Information System (CWFIS) static map viewer, allowing comparisons of seasonal fire activity across years. Many of the active wildfires are located in the southern and central Interior, regions currently classified by the Canadian Drought Monitor as ranging from “Abnormally Dry” to “Severe Drought” (see Figure 3). Historical drought conditions can also be explored through archived Canadian Drought Monitor maps. Early-season wildfire activity can be influenced by a combination of factors, including below-normal snowpack, persistent drought, and warmer-than-average temperatures. Together, these conditions can contribute to landscapes drying out earlier in the spring and remaining vulnerable for longer periods of time.Figure 1: Current wildfires as of May 11, 2026. Source: BC Wildfire Service.

Setting the Stage: Current Snowpack and Drought Conditions

Snowpack

One factor contributing to early-season wildfire concerns in British Columbia is the below-average snowpack observed in several parts of the province. Snowpack provides insurance against dry soil and vegetation during the spring and summer by slowly releasing meltwater into ecosystems and waterways as temperatures warm.While provincial snowpack was measured at approximately 83% of normal overall, conditions varied considerably by region. Areas with well-below normal snowpack included Vancouver Island, the South Coast, Skagit, Okanagan, Lower Thompson, and Upper Fraser West (Figure 2).In Metro Vancouver, the snowpack that the district relies on for water was reported to be roughly 50% of normal, prompting regional officials to implement lawn watering restrictions beginning May 1.[1]

Figure 2: The Basin Snow Water Index Map of British Columbia, as of May 1, 2026. All blue areas exhibit near to well above normal snowpack (90% to >140% of normal), green to peach areas range from 60% to 89%, while regions in orange to red remain well below normal at 59% or less of normal snowpack. Source: BC Ministry of Water, Land and Resource Stewardship (2026).


Did you know? ClimateData.ca recently added new snowfall and rainfall projections, allowing users to explore how precipitation patterns may change across Canada under future climate conditions. The datasets include projections for indicators such as total snowfall, snowfall season length, and extreme rainfall events. Read more here: New: Snowfall and Rainfall Projections on ClimateData.ca – ClimateData.ca.


Drought

Long-term drought conditions are also present across parts of southern and central British Columbia (Figure 3). Many regions experienced wetter-than-normal conditions during March, and above-normal amounts of snow this winter have brought relief from a long-term drought in northeastern BC. However, long-term moisture deficits have persisted across much of the interior.

Parts of the Thompson-Okanagan and Kootenays received less than 40% of normal precipitation over recent months [3]. Many of the regions experiencing low snowpack are also currently classified by the Canadian Drought Monitor as “Abnormally Dry” to “Severe Drought,” including:


  • Southern Vancouver Island
  • Skagit
  • Nicola
  • Okanagan
  • Boundary
  • Lower Thompson
  • Upper Fraser West


Together, below-average snowpack and earlier snowmelt are contributing to dry conditions in several regions of the province heading into the spring and summer season.

Figure 3: Drought Conditions in BC as of  April 30, 2026. Bright yellow demonstrates “Abnormally dry” conditions, light brown/peach shows “Moderate Drought” conditions, and orange shows areas of “Severe Drought”. Source: Current drought conditions – agriculture.canada.ca.


Seasonal Forecasts: What’s in store for B.C. this spring and summer?


With these early-season dry conditions in place across the Okanagan and southern interior, what might conditions look like over the coming months?

ClimateData.ca now includes monthly and seasonal temperature and precipitation forecasts. These forecasts are produced by Environment and Climate Change Canada and are updated each month. Unlike daily weather forecasts, seasonal forecasts provide information about the likelihood of above-, near-, or below-normal temperature and precipitation over the next one to three months and over rolling 3-month seasons covering the next twelve months. Seasonal temperature and precipitation forecasts cannot predict extreme events or daily weather, rather, they provide information about average conditions for the month or season as a whole.

These forecasts can help provide additional context for short-term planning and preparedness. For British Columbia, the May to July 2026 seasonal forecasts suggest an elevated likelihood of warmer-than-normal conditions across much of the province (Figure 4 a).

Figure 4 a) Seasonal temperature forecast for May to July 2026. The forecast gives the probabilities of temperatures being above, near, or below normal (relative to the 1991 to 2020 historical climatology).

Figure 4 b) Seasonal temperature forecast for unusual conditions for May to July 2026. The forecast gives the probabilities of temperatures being unusually high (above the 80th percentile of the historical climatology for 1991 to 2020) or unusually low (below the 20th percentile).

Seasonal Temperature Forecast for May to July 2026

The temperature forecast available on ClimateData.ca (Figure 4a) shows that all of BC is likely to experience warmer than normal temperatures; with the majority of the province having a 90-100% probability of being warmer than normal. Additionally, a large portion of this warmer-than-normal area has a 70-100% chance of experiencing “unusually high” temperatures (Figure 4b). (Here “unusually high” refers to temperatures exceeding the 80th percentile of a historical climatology covering 1991 to 2020.) Generally, Vancouver Island, the interior and the western regions of the province show the highest probabilities of unusually high temperatures, while the north is less likely to experience unusually high temperatures, with probabilities of 30-40%. There is significant overlap between regions facing unusually high temperatures and those with low snowpack and drought, explored earlier in this blog. 

Monthly Precipitation Forecast for May 2026


The monthly precipitation forecast for May 2026 (Figure 5) suggests from 40% to over 60% probabilities of below-normal precipitation across parts of western and southern BC, including Vancouver Island.

Across much of the rest of the province, precipitation signals are weaker or more mixed. Monthly and seasonal precipitation forecasts are often less skillful than temperature forecasts, but they can still provide useful context when considered alongside existing drought conditions, snowpack levels, and longer-term climate trends.

Figure 5: Monthly precipitation forecast for May 2026. The forecast gives probabilities of above, near, or below normal precipitation, relative to 1991 to 2020. Hatching indicates areas where the prediction system skill is low and, as such, forecasts should be used with caution or the climatology should be used instead.

Monthly Wildfire Severity Forecast for May 2026


Natural Resources Canada’s Canadian Wildland Fire Information System provides several forecast products based on fire weather conditions, including the Forecast Severity Anomaly map for wildfires, which indicates how the monthly-average Forecast Severity Rating compares to historical conditions for specific locations. Maps are updated monthly, and the forecast uncertainty tends to decrease as the month of interest draws closer.

The May 2026 Forecast Severity Anomaly map indicates that Vancouver Island and southern BC are in the “well above average” category for wildfire severity, indicating more intense fire weather conditions relative to historical norms. In the central interior and northeastern regions, conditions fall within the “above average” category. By July, much of coastal BC, including Vancouver Island and Haida Gwaii, is in the “well above average” category.

Figure 6: The Forecast Severity Anomaly map for wildland fires displays at each location the category of the forecast severity rating determined by the percentiles of historical forecasts from 1991-2020. The five distinct categories are: well below average (below 10th percentile), below average (10th to 33rd percentile), average (33rd to 66th percentile), above average (66th to 90th percentile), well above average (above 90th percentile). Source: Forecast conditions – Canada.ca.

Looking Beyond This Season: Longer-Term Climate Projections

Seasonal forecasts help provide insight into conditions over the coming months and seasons, but longer-term climate projections can help us understand how underlying climate patterns may continue to change over coming decades.

Many of the factors influencing conditions in British Columbia this spring, including warmer temperatures, earlier snowmelt, dry soils, and drought, are closely connected to broader long-term climate trends. Exploring future projections of temperature, precipitation, and fire weather conditions can help provide additional context for how climate-related risks such as wildfire and water shortages may evolve over time.

In this section, we examine projections related to:

Together, these datasets help illustrate how conditions linked to wildfire risk may change across BC later this century.

Figure 7a): Change in the annual number of days above 25°C (2051-2080 vs. 1971-2000) under a high emissions scenario (SSP3-7.0).

Figure 7b): Percent change in total summer (June, July, August) precipitation (2051-2080 vs. 1971-2000) under a high emissions scenario (SSP3-7.0).

Days Above 25°C

One way to examine future warming in BC is by looking at projected changes in the number of warm summer days each year (days with a maximum temperature above 25 °C). Climate projections show that much of the province is expected to experience overall increases in the number of days above 25 °C by the mid-to-late century period (2051–2080) compared to the historical baseline period (1971–2000), especially under a high emissions scenario (SSP3-7.0). Visit our Learning Zone article Understanding Shared Socio-economic Pathways (SSPs) to learn more about future emissions scenarios.

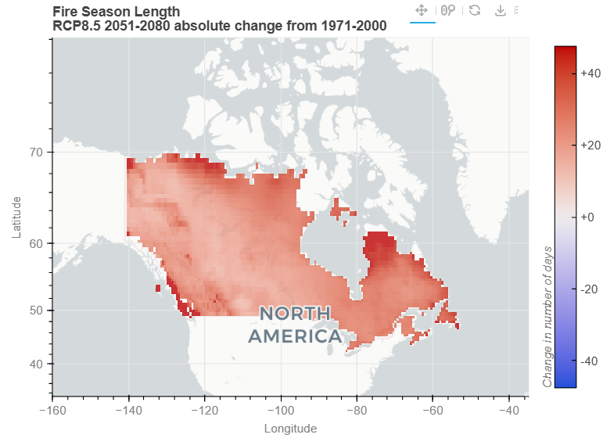
The largest increases are projected across southern BC, the central interior, parts of Vancouver Island, and northeastern regions of the province (Figure 7a). In some areas, projections show more than 40 additional days above 25 °C each year, on average.More frequent hot days can contribute to increased evaporation, drier soil and vegetation, longer snow-free periods, and conditions that support longer and more active fire seasons.

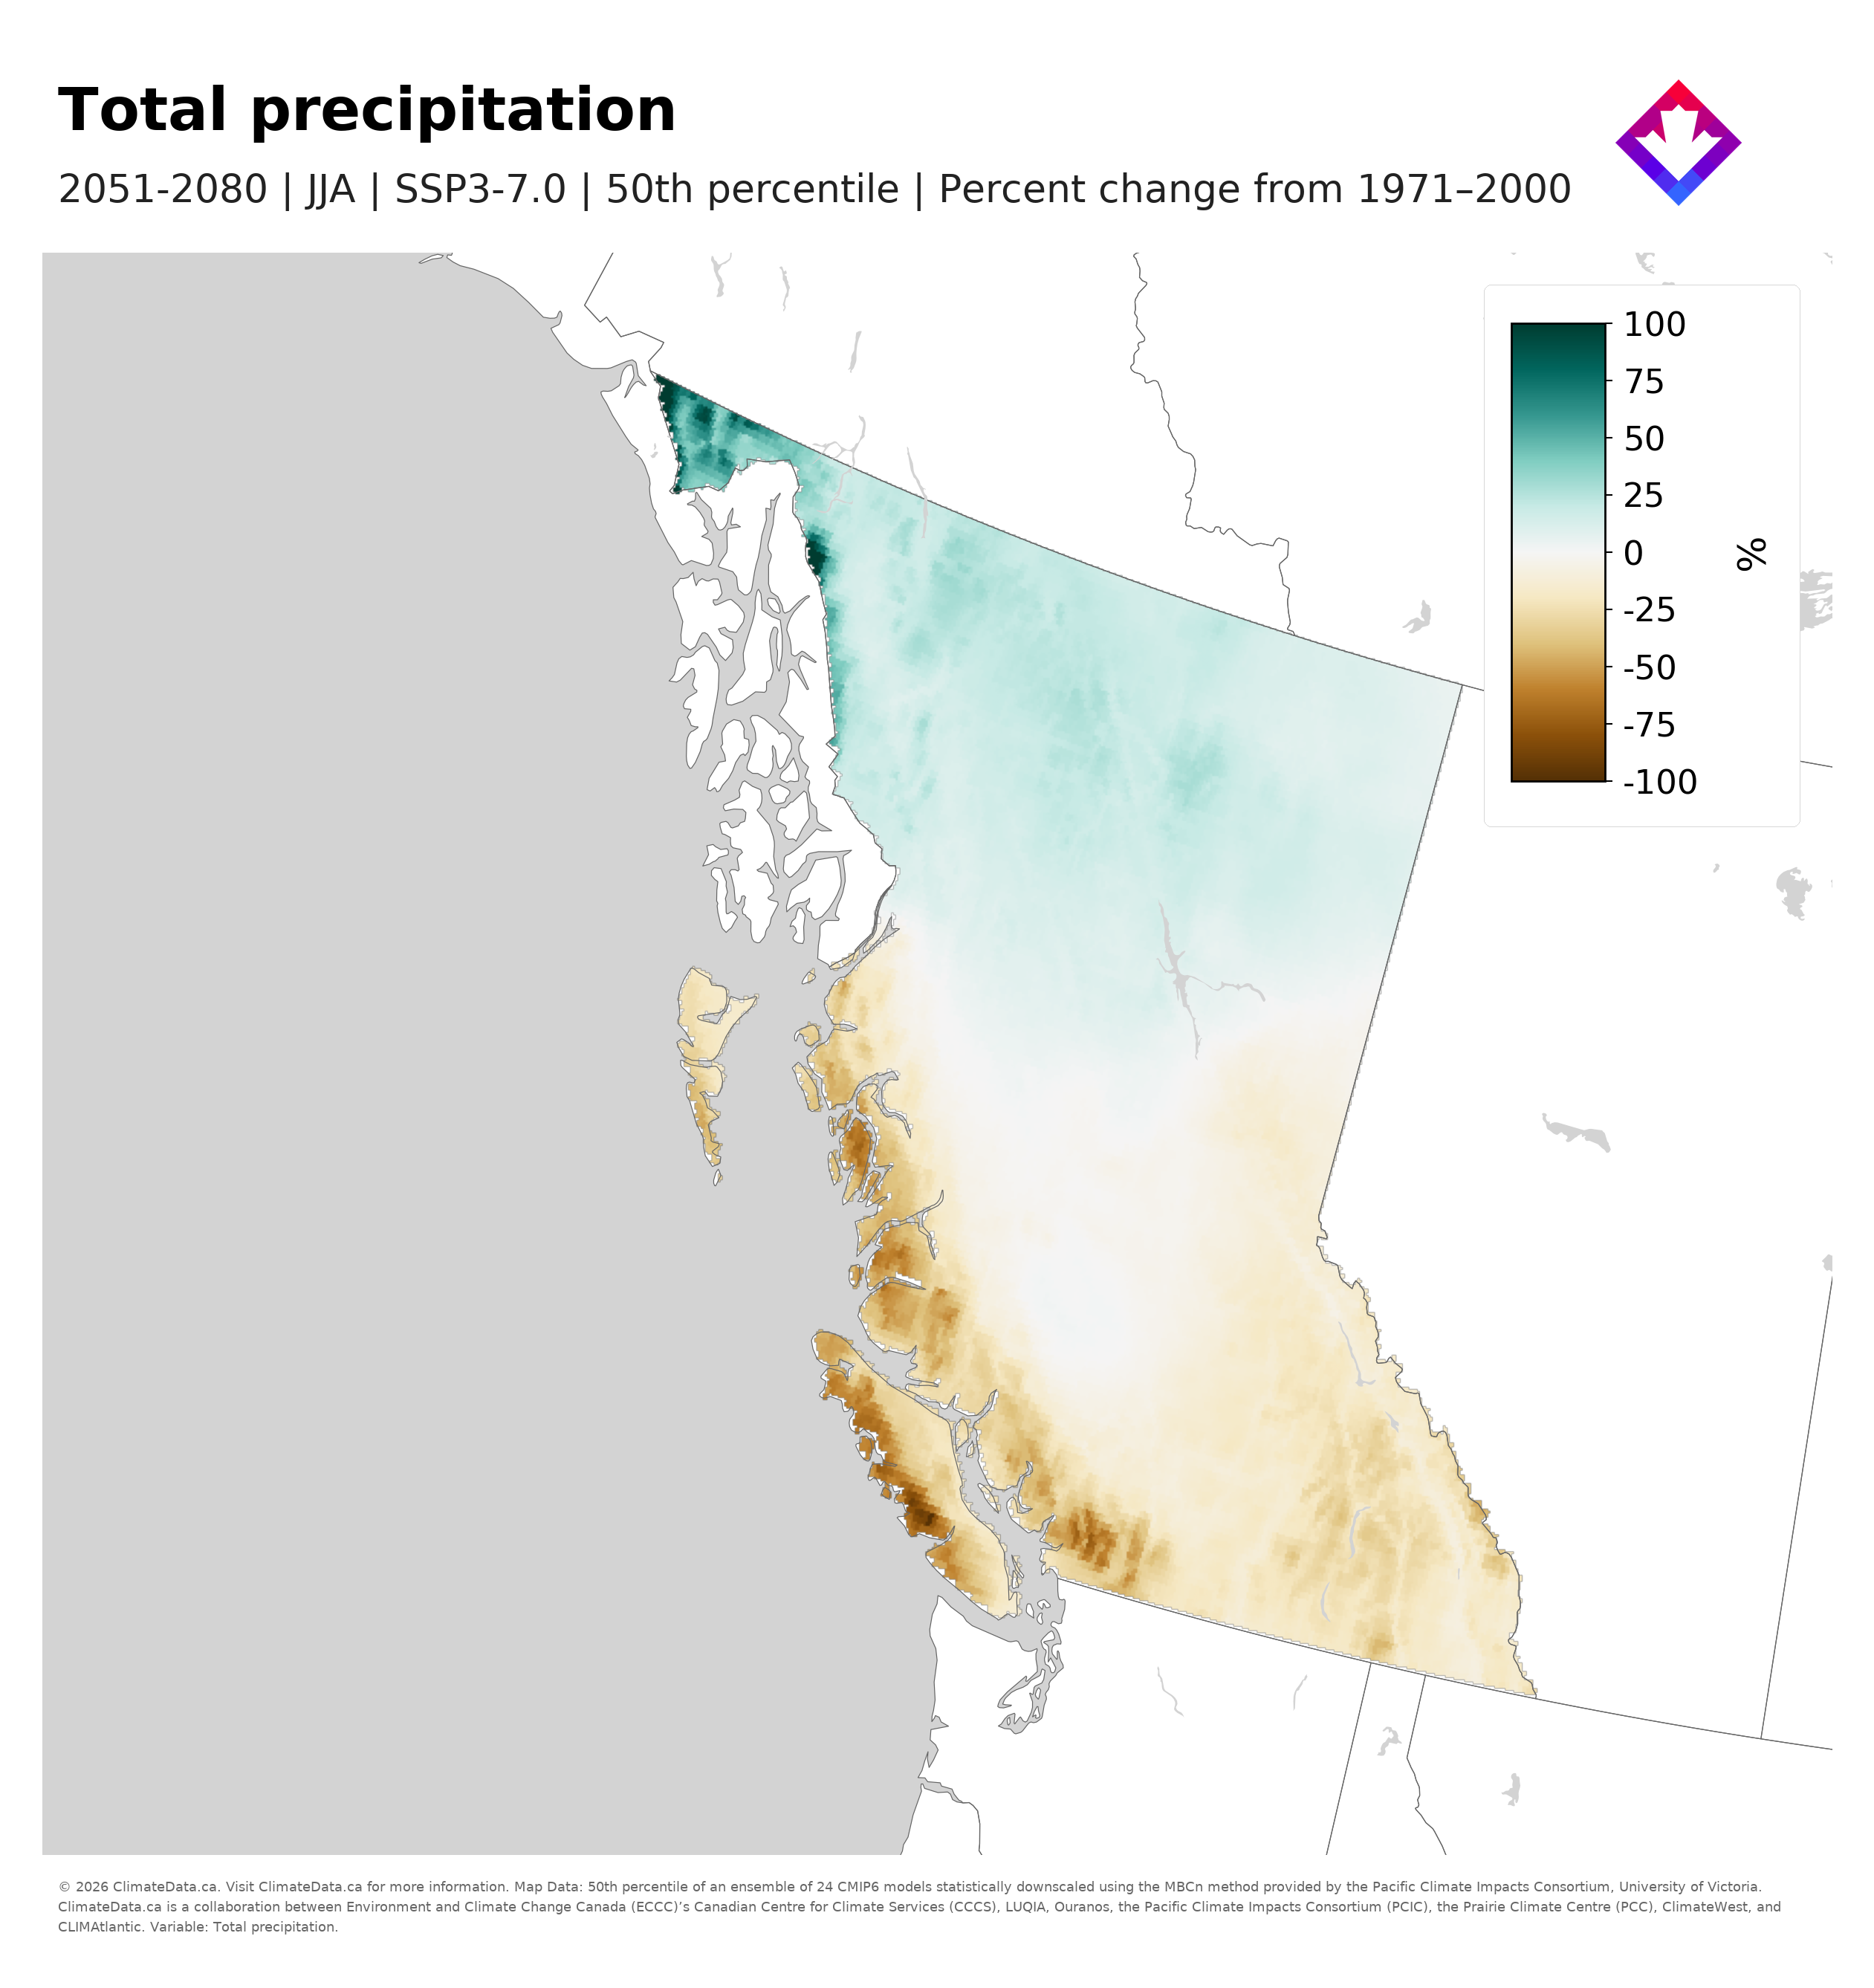
Total Summer Precipitation

Climate projections also suggest that by 2051–2080, much of the province is projected to receive less summer precipitation compared to the 1971–2000 average (southern half of B.C.), whereas the north is projected to receive more precipitation, on average (Figure 7b). The largest projected decreases occur along parts of the coast, including Vancouver Island and Haida Gwaii.Taken together, an increase in days above 25 °C combined with a decrease in total summer precipitation implies that present-day challenges related to diminishing snowpack and drought are likely to continue well into the future. These changes have important implications for water availability, ecosystems, and wildfire risk across British Columbia.
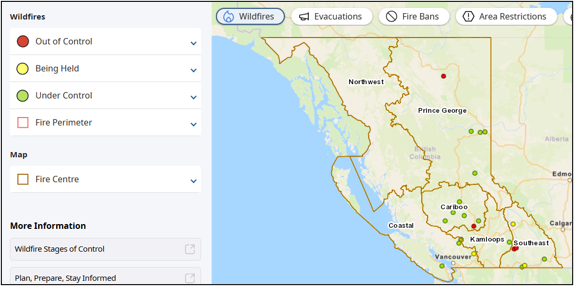
Fire Weather Projections on ClimateData.ca

In addition to temperature and precipitation projections, ClimateData.ca includes a fire weather projection app that allows users to explore future changes in indicators such as fire season length and the Build-Up Index (BUI).For example, projections available through the application suggest that fire season length is expected to increase in a very high emissions scenario (Figure 8).[4] British Columbia is projected to experience longer fire weather seasons in the future. Many parts of the province are projected to see increases of at least 20 additional fire weather days per year by 2051–2080 compared to the 1971–2000 baseline period. In some coastal regions, including parts of Vancouver Island and Haida Gwaii, projections indicate substantially larger increases in fire season length of 40 days or more.Fire season length does not predict the number, location, or severity of wildfires. However, longer fire seasons and increases in conditions that render wildfires more likely (as represented by increasing fire weather indicator values) suggest that conditions supportive of wildfire activity are projected to become more common in many regions of British Columbia and Canada in a warming climate.

Figure 8:This map shows the absolute change by 2051-2080 from 1971-2000 in the fire season length under the RCP8.5 emissions scenario The fire season length metric represents the annual count of days in the fire season. The fire season begins after three consecutive days with daytime maximum temperatures greater than 12°C and ends after three consecutive days of daytime maximum temperatures remaining below 5°C.

Key Takeaways

The conditions developing across southern British Columbia in spring 2026 highlight how closely connected snowpack, drought, temperature, precipitation, water availability, and wildfire risk can be.

While seasonal forecasts provide insight into possible conditions over the coming months and seasons, longer-term climate projections can help communities and decision makers better understand how these patterns may continue to evolve in the future.

Using climate data alongside seasonal outlooks and fire weather information can support longer-term planning, adaptation, and preparedness across the many sectors affected by these changing climate conditions.

References

[1] Fires, drought and water woes to begin B.C.’s wildfire season | Globalnews.ca

[2] BC Wildfire Service

[3] Current drought conditions – agriculture.canada.ca

[4] In the ClimateData.ca Fire Weather Projections App, “very high emissions scenario” refers to RCP8.5. This scenario represents a higher amount of global warming than SSP3-7.0, the scenario depicted in Figure 7a and 7b. Currently, the App does not provide projections for SSP3-7.0. RCP8.5 was selected here because, like SSP3-7.0, it is considered a high-end emissions scenario and can provide insight into the upper range of projected future climate conditions. In adaptation planning, examining these upper-end projections can be valuable because they help planners assess potential high-impact risks, test the resilience of decisions and infrastructure under more extreme future conditions, and better prepare for a wider range of possible outcomes.