A Menu of Climate Data for Toronto, Ontario

From historical observations and climate normals to seasonal forecasts and future projections

Date August 17, 2026
Author Ryan Smith and Rachel Malena-Chan, Canadian Centre for Climate Services
Topics Climate Data
Share this post

Finding the right data for your needs

Climate data can answer many different questions about a city. How has Toronto’s climate changed over the past century? What conditions are considered normal in the recent past? What might the next season bring? How could long-term averages and extremes change over the coming decades? And what could those changes mean for infrastructure, public health, natural systems, and everyday life?

No single dataset can answer all of these questions. The appropriate information depends on the decision being made, the time horizon involved, and the climate variable(s) of interest. ClimateData.ca offers observational datasets, climate normals, seasonal forecasts, future climate projections and specialized tools that allow users to examine these questions at different scales.

This article presents a menu of climate information for Toronto and shows how data from ClimateData.ca can be transformed into clear visual stories. The same datasets and tools can be applied to communities across Canada.
Historical trends: what has Toronto experienced?

Historical observations show how local conditions have varied and changed. For Toronto, Adjusted and Homogenized Canadian Climate Data (AHCCD) account for non-climatic changes in station records, such as changes in instruments or station location, making the dataset well suited to long-term trend analysis.

Download: AHCCD data

Learn: About the data (see Historical Datasets, AHCCD)

Ask: Which historical dataset should I use?

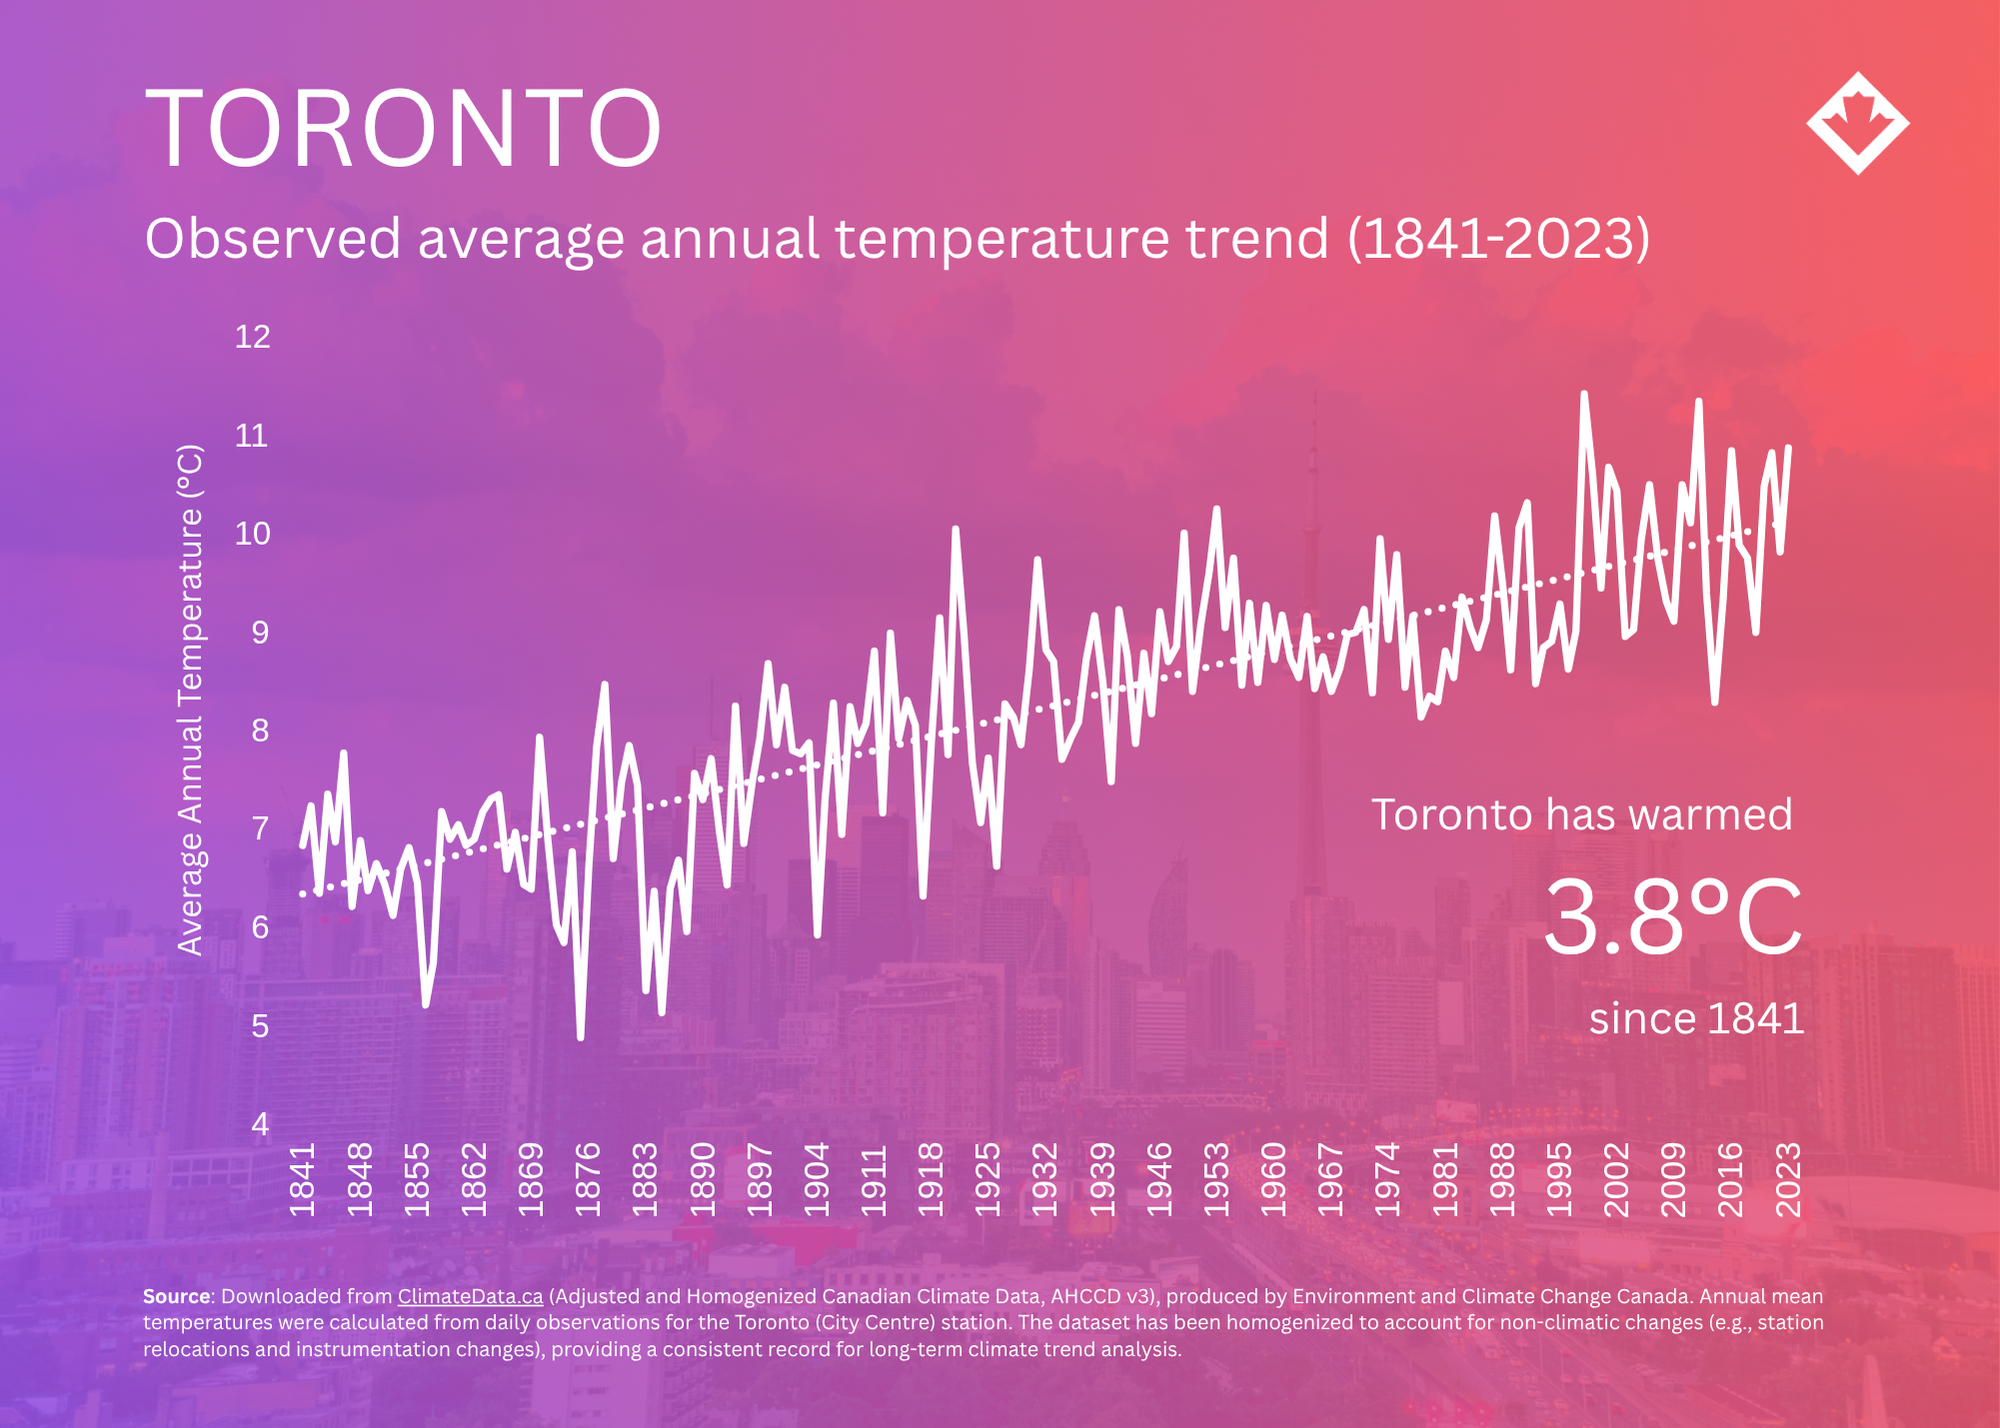
The annual values plotted below show year-to-year variability, while the trend line reveals the longer-term direction. Toronto’s annual average temperature increased by 3.8 °C between 1841 and 2023.

Figure 1. Observed average annual temperature for the Toronto (City Centre) station, 1841–2023. Annual values were calculated from daily observations obtained from the Adjusted and Homogenized Canadian Climate Data dataset available on ClimateData.ca. The dotted linear trend indicates an increase of 3.8 °C over the full period.

Climate normals: a reference for typical conditions

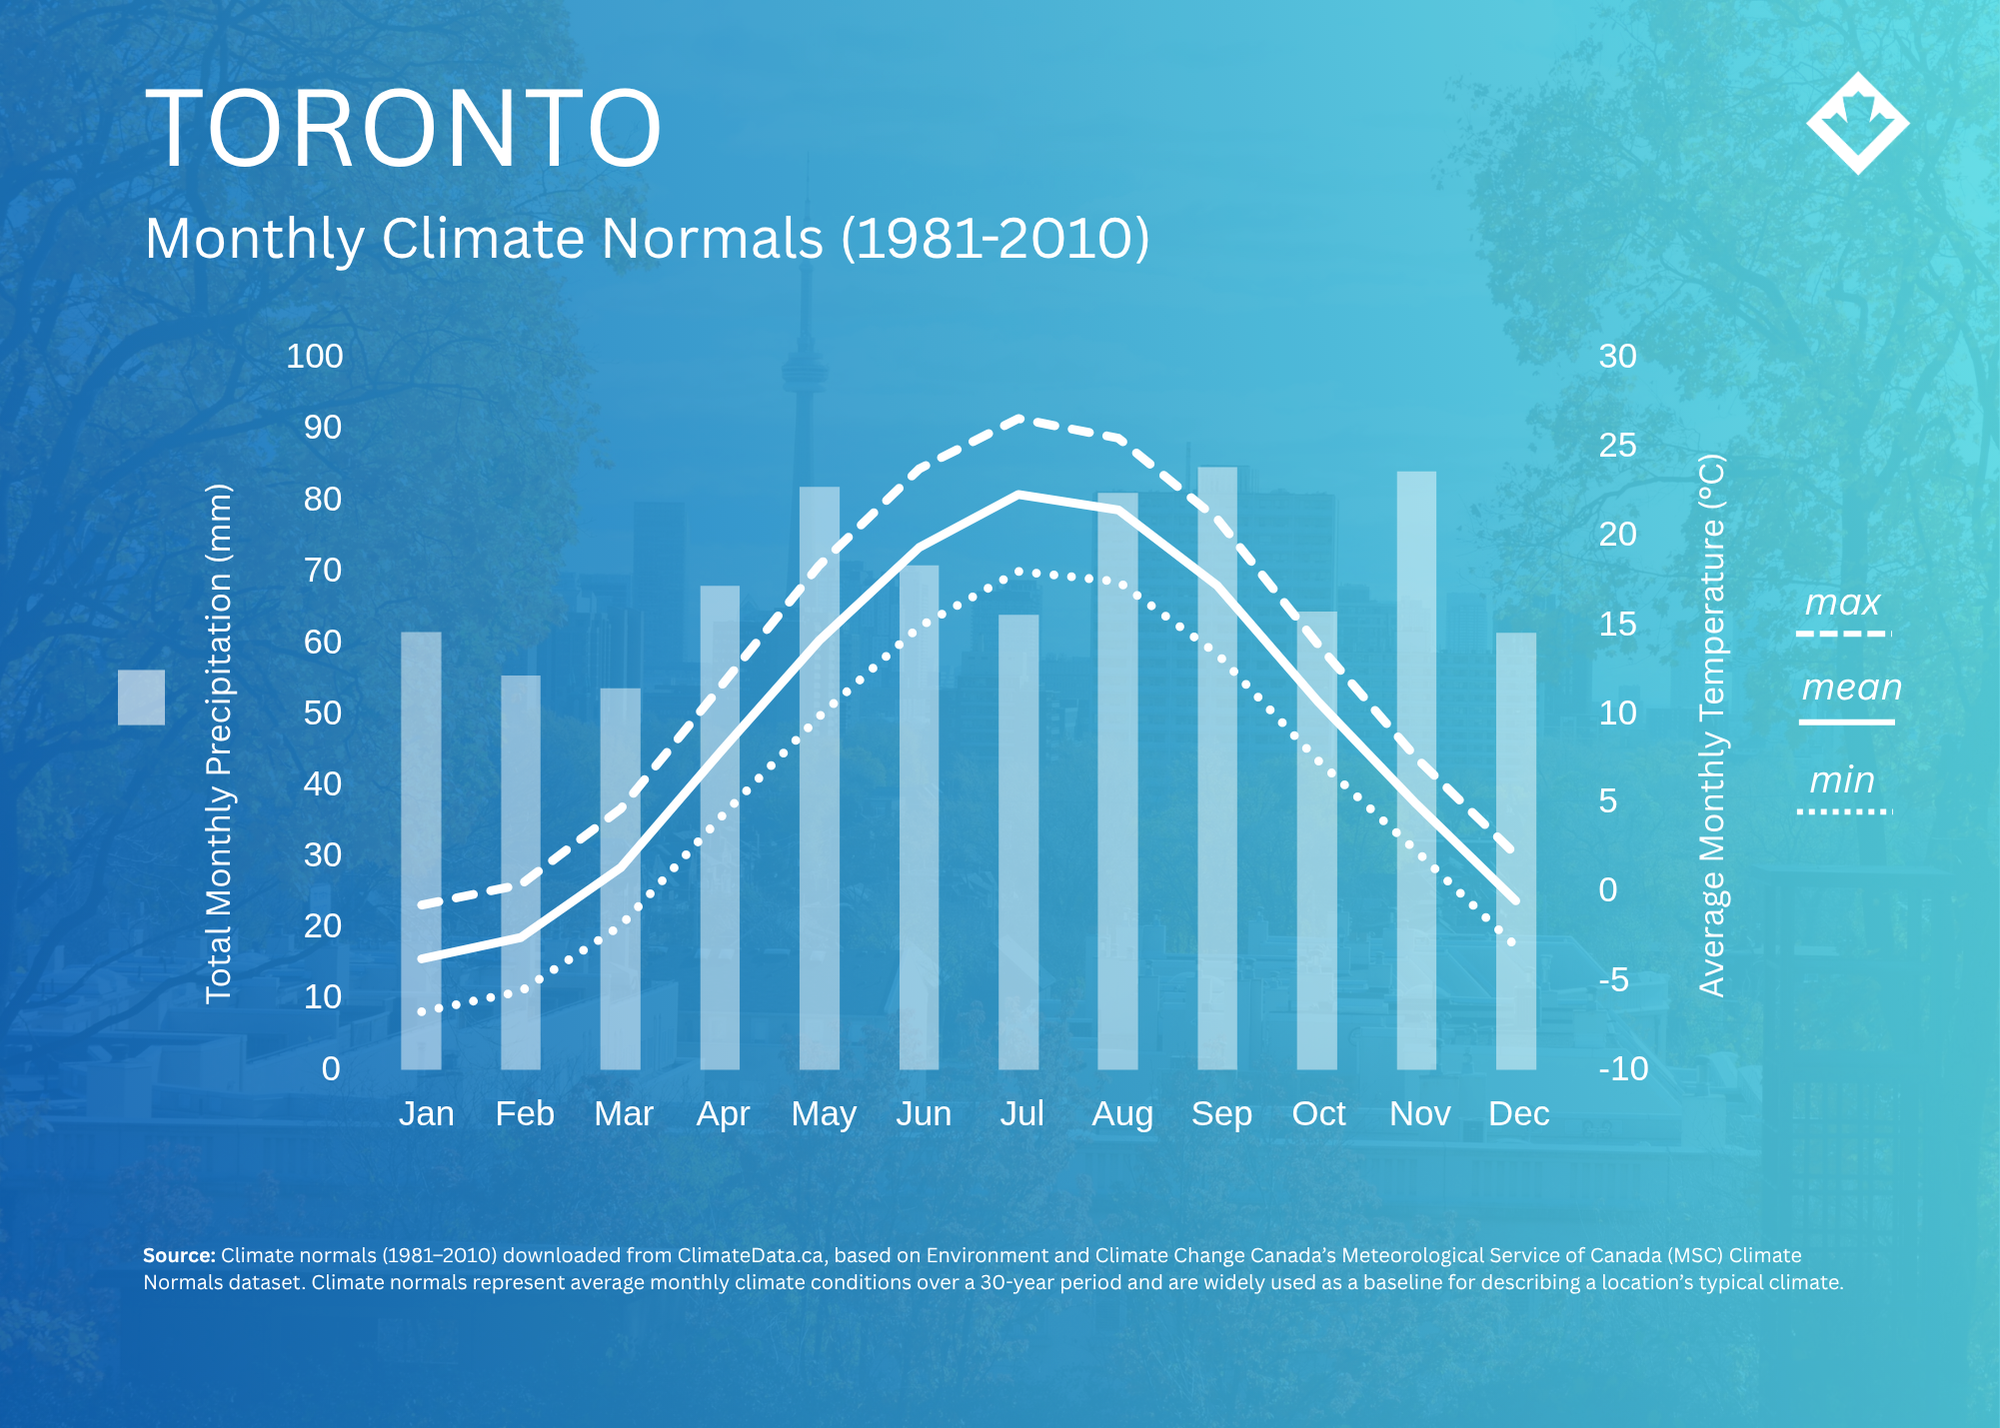
Climate normals summarize average conditions over a standard 30-year period. The Canadian Climate Normals dataset available on ClimateData.ca includes monthly and annual temperature and precipitation statistics for the 1981-2010 time period.

View and explore: Climate normals map

Download: Climate normals

Learn: About the data (see Historical Datasets, MSC Climate Normals 1981-2010)

Normals are useful reference points, but they are descriptive rather than predictive. They do not show the full range of possible conditions and should not be treated as fixed expectations in a changing climate.

Figure 2. Toronto’s 1981–2010 monthly climate normals downloaded from ClimateData.ca. Bars show total monthly precipitation, while the three lines show average monthly maximum, mean and minimum temperature. Data are from Environment and Climate Change Canada’s Meteorological Service of Canada Climate Normals dataset.

Seasonal forecasts: what might the coming months bring?

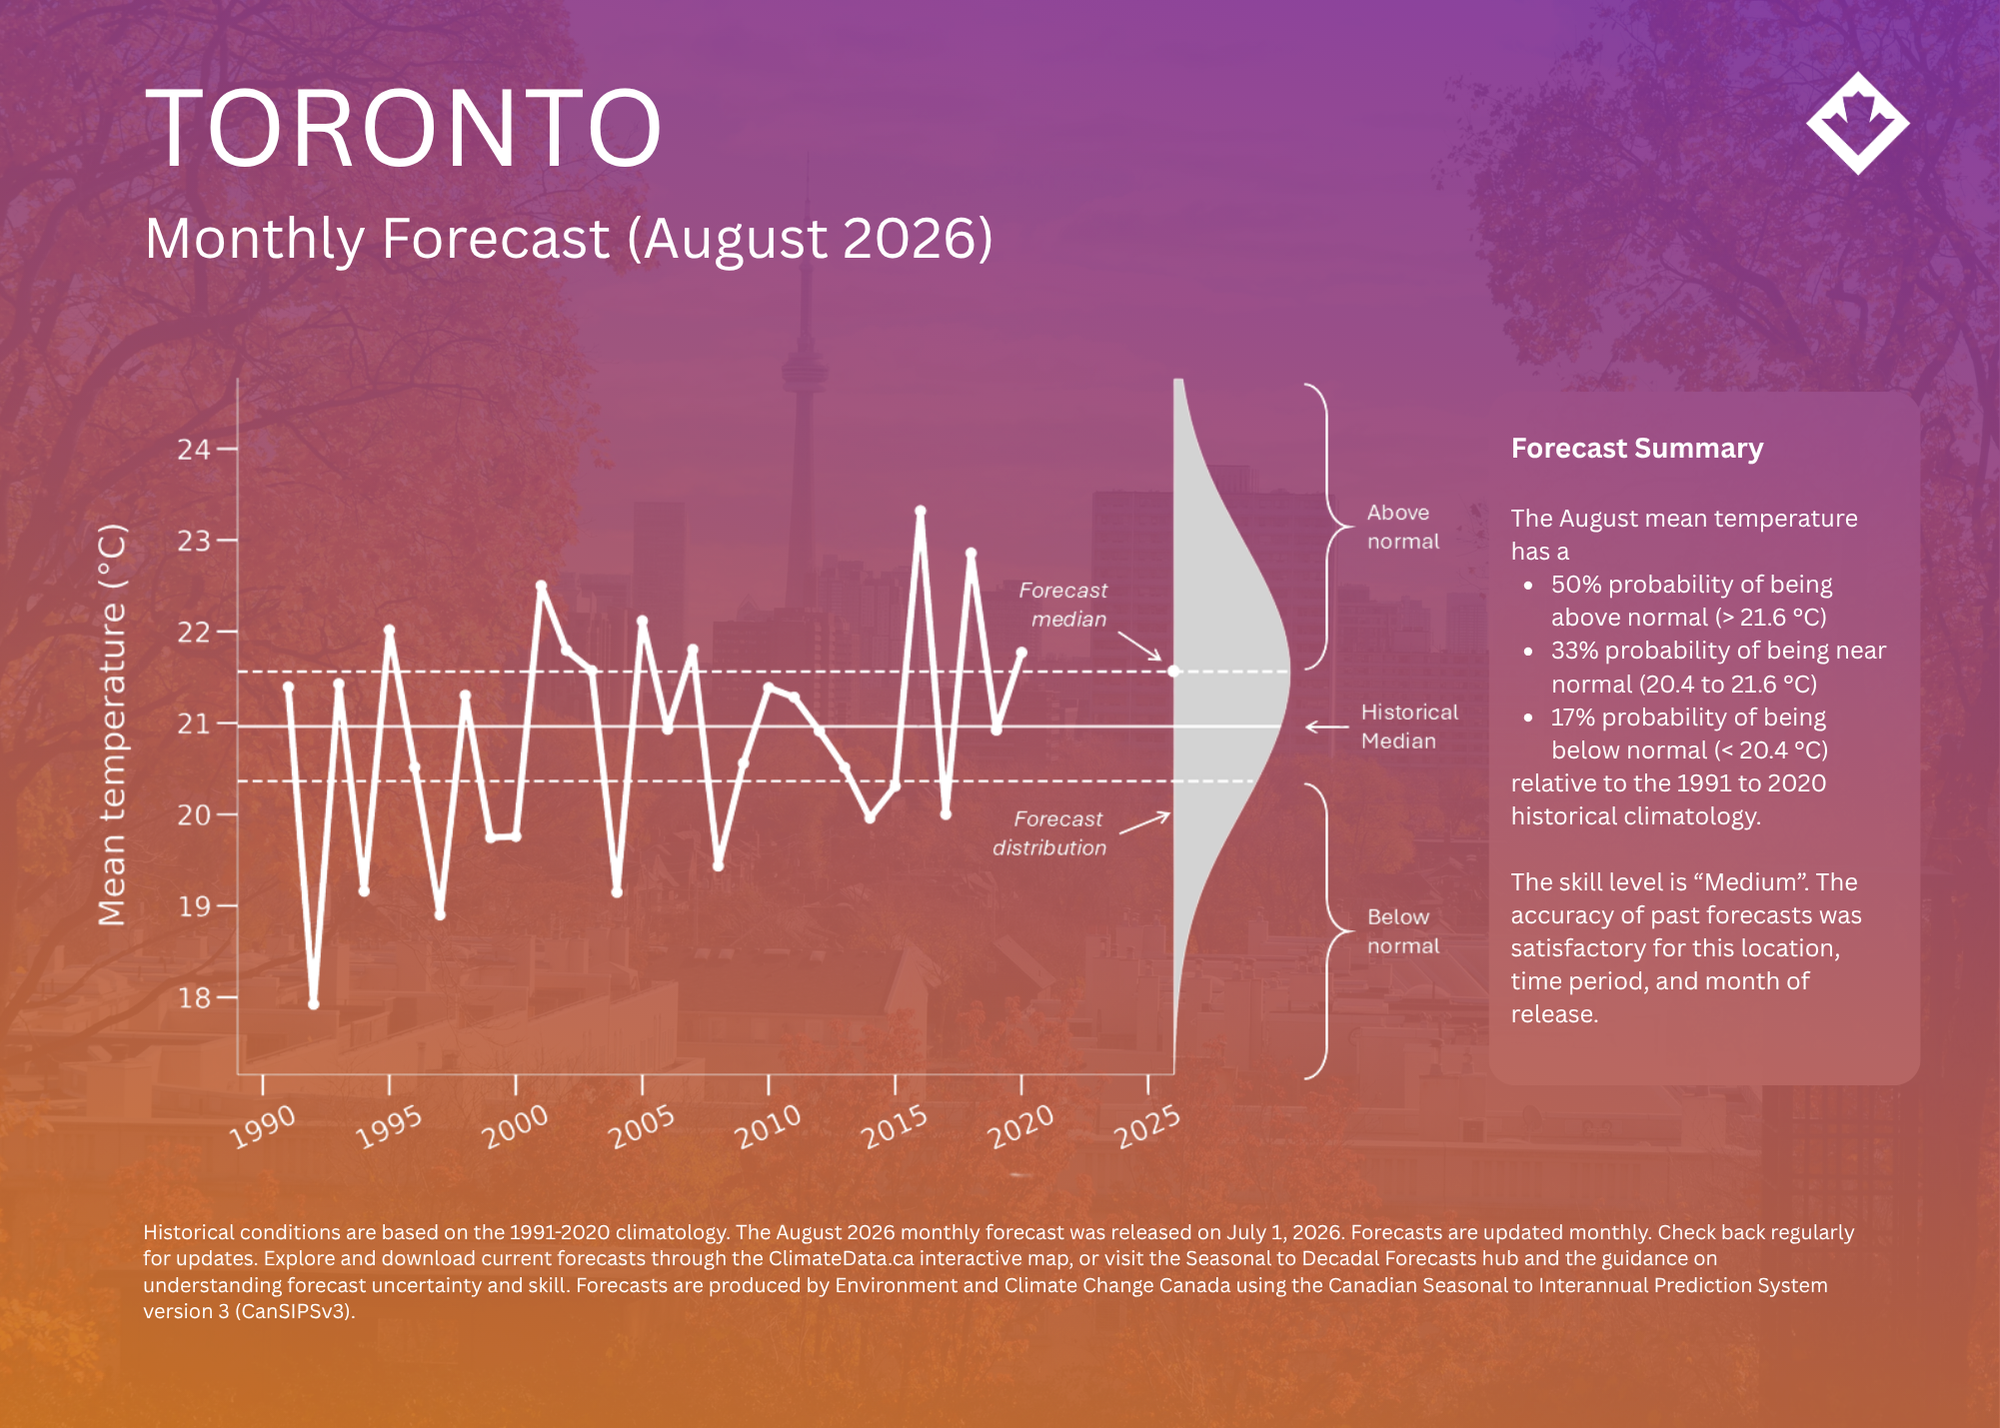
Seasonal forecasts estimate whether temperature or precipitation over the coming months is more likely to be below normal, near normal or above normal relative to 1991–2020. They are probabilistic, not day-by-day forecasts. As such they should be interpreted alongside information related to the forecast’s skill.

For Toronto, these products can support near-term planning in areas such as public health, water management, energy demand and seasonal operations. Because forecasts are updated regularly, users should always consult the current product.

Explore: Current seasonal forecasts

Ask: What are seasonal forecasts?

Learn: Considering uncertainty in seasonal forecasts

Figure 3. Historical conditions are based on the 1991-2020 climatology. The August 2026 monthly forecast was released on July 1, 2026. Forecasts are updated monthly. Check back regularly for updates. Forecasts are produced by Environment and Climate Change Canada using the Canadian Seasonal to Interannual Prediction System version 3 (CanSIPSv3). Explore and download current forecasts through the ClimateData.ca interactive map, or visit the Seasonal to Decadal Forecasts hub and the guidance on understanding forecast uncertainty and skill.

Future projections: the broad direction of change

Long-term projections describe plausible future climate conditions under different Shared Socioeconomic Pathways (SSPs), generally using ensembles of climate models. They are not forecasts for a specific year.

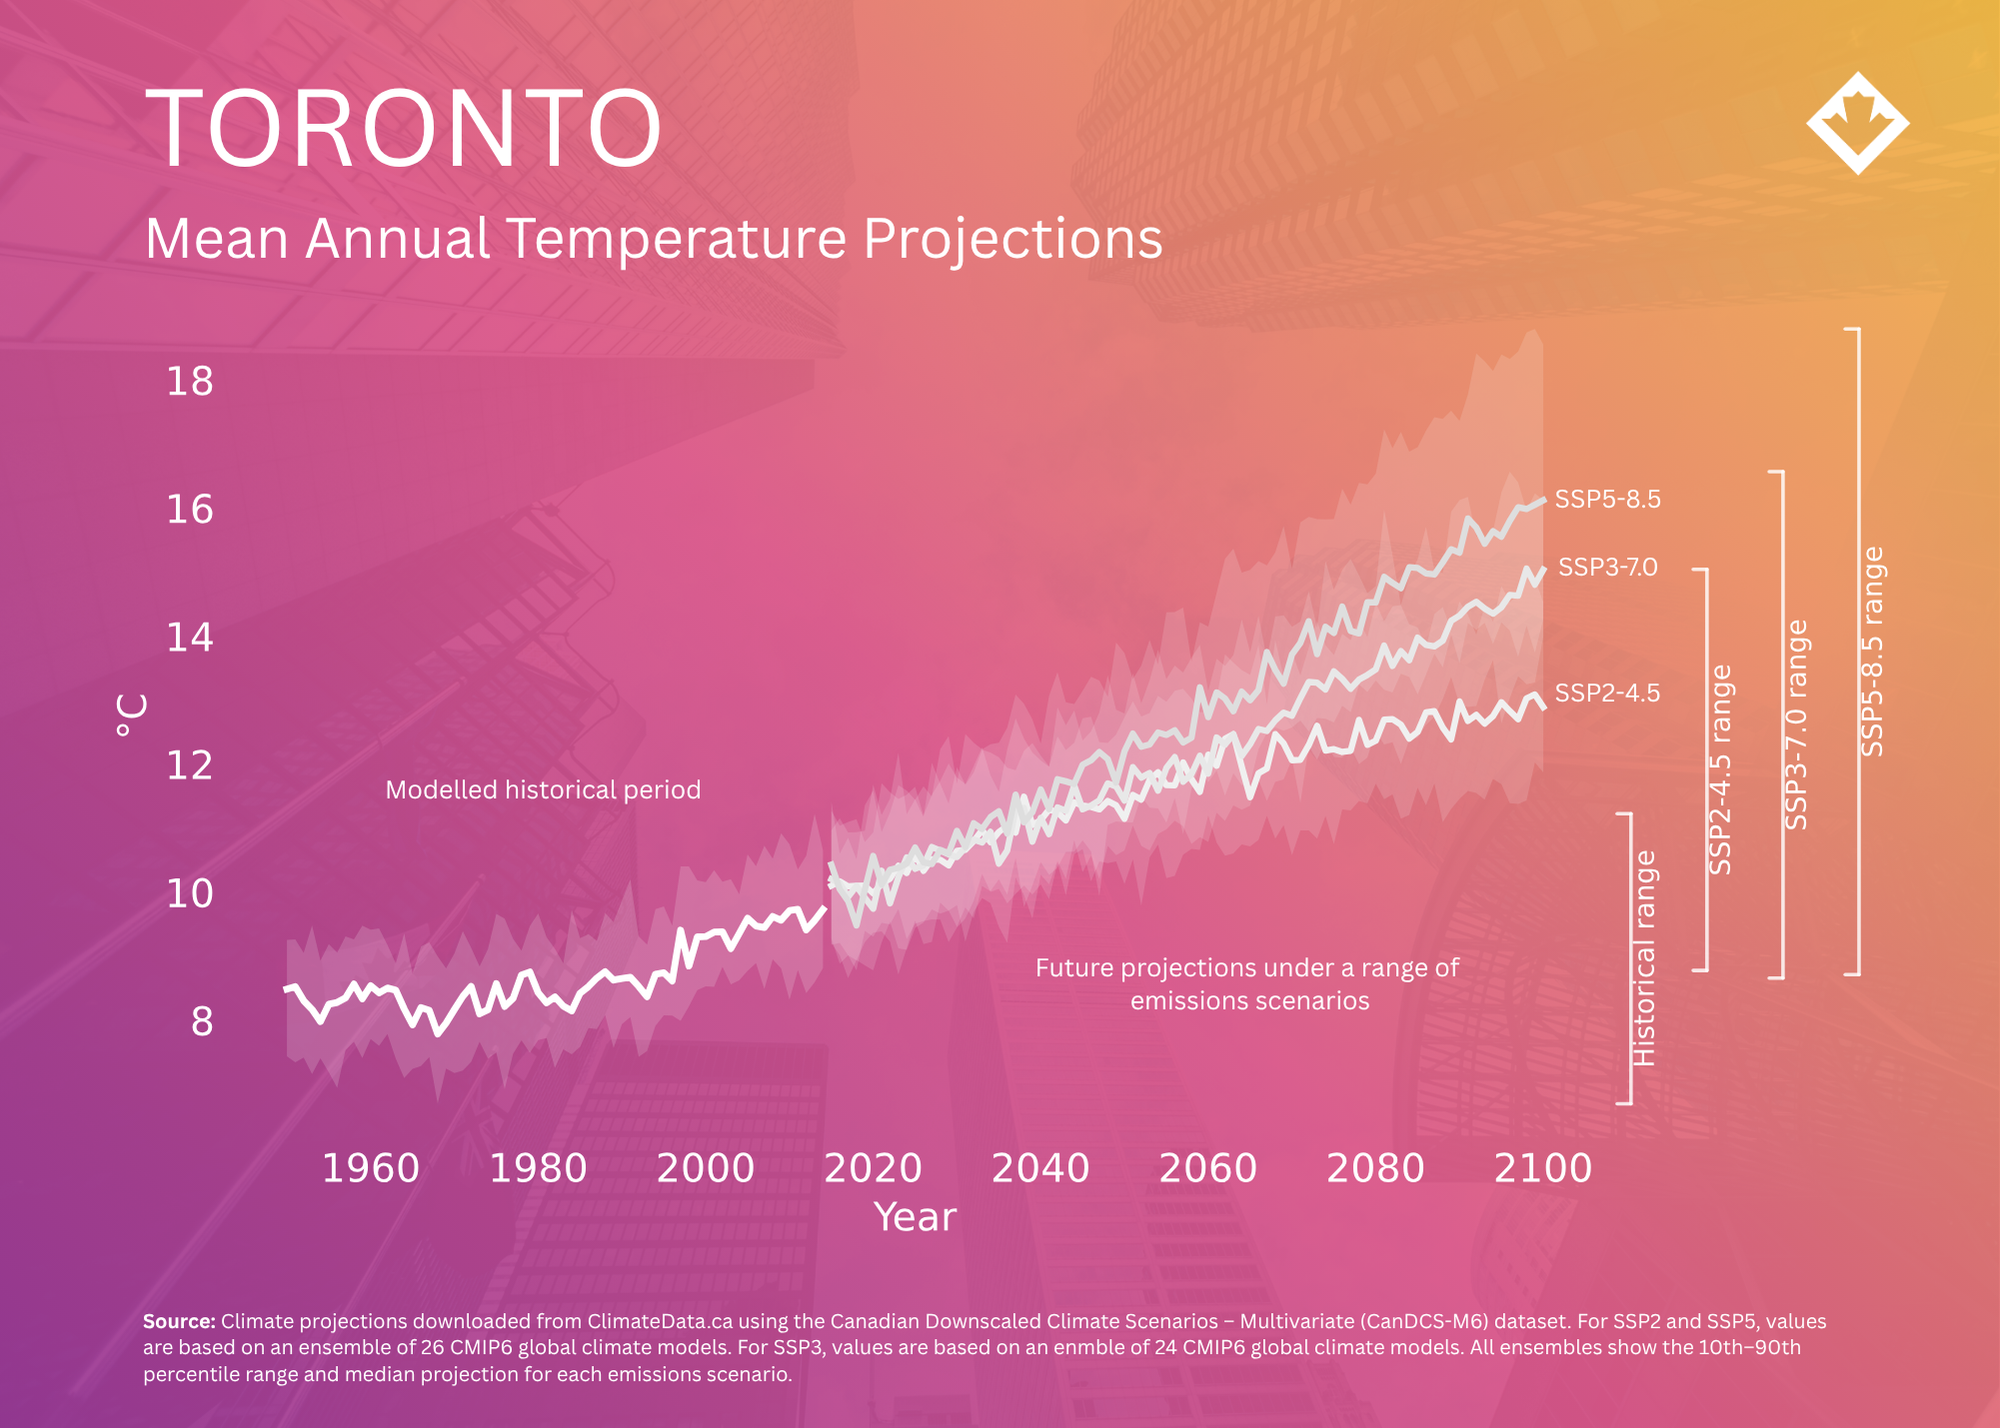
For the nearest CanDCS-M6 grid cell, Toronto City Centre’s 1971–2000 annual average temperature was 8.6 °C. Under a high-emissions scenario, the median rises to 10.9 °C in 2021–2050, 12.6 °C in 2051–2080 and 13.9 °C in 2071–2100. Annual precipitation, historically 868 mm, increases by approximately 5%, 11% and 14% across the same periods.

Explore: Map of climate projections for the GTA

Download: Select “Statistically Downscaled Global Climate Projections”

Browse: Projected climate variables

Learn: Understanding SSPs, Uncertainty in Climate Projections

Figure 4. Modelled historical and projected mean annual temperature for Toronto under SSP2-4.5, SSP3-7.0 and SSP5-8.5, downloaded from ClimateData.ca. Solid lines show the ensemble median and shaded bands show the 10th–90th percentile range across an ensemble of CMIP6 global climate models in the CanDCS-M6 dataset.

Future projections: regionally specific thresholds

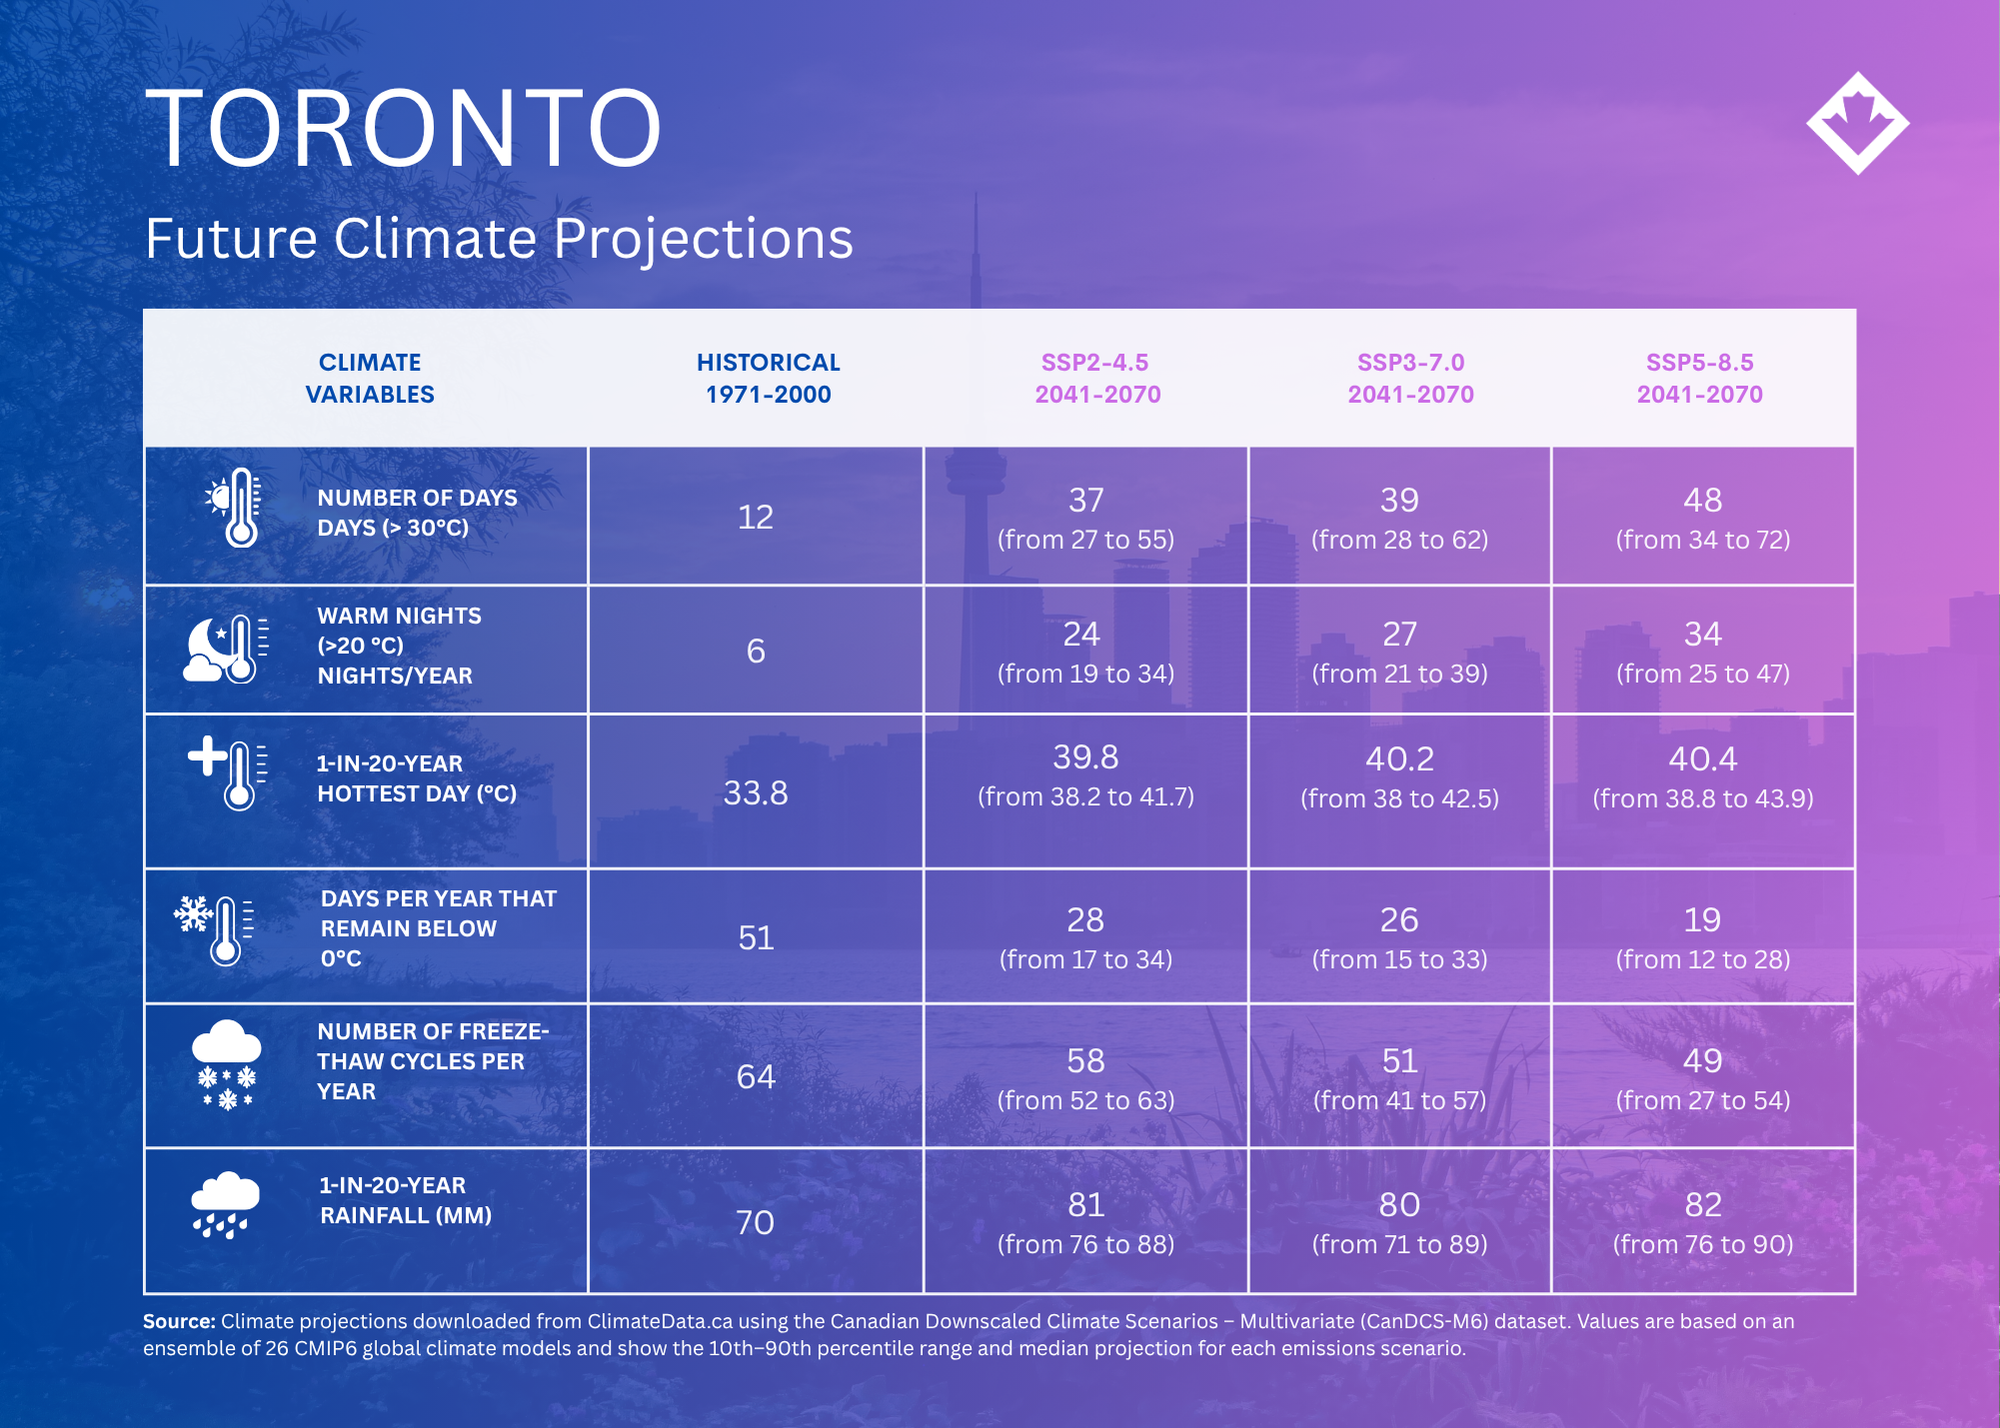
Climate indices translate temperature and precipitation into measures that connect more directly with impacts. For example, Toronto is projected to experience more hot days above 30 °C and more warm “tropical” nights, on average, under all future emissions scenarios. These changes are likely to have an impact on human health.

Explore: Map of climate projections for the GTA

Download: Select “Statistically Downscaled Global Climate Projections”

Browse: Projected climate variables

Learn: Understanding SSPs, Uncertainty in Climate Projections

The table below shows an ensemble median and 10th–90th percentile range. The range represents variation among model results and should be considered in planning.

Figure 5. Comparison of selected climate indices modelled under a historic period (1971–2000) and future period (2041–2070), under the SSP2-4.5, SSP3-7.0 and SSP5-8.5 emissions scenarios. All values were obtained from ClimateData.ca, and show the ensemble median and 10th–90th percentile range across 26 CMIP6 models in the CanDCS-M6 dataset.

Spatial analogues: whose climate will Toronto inherit?

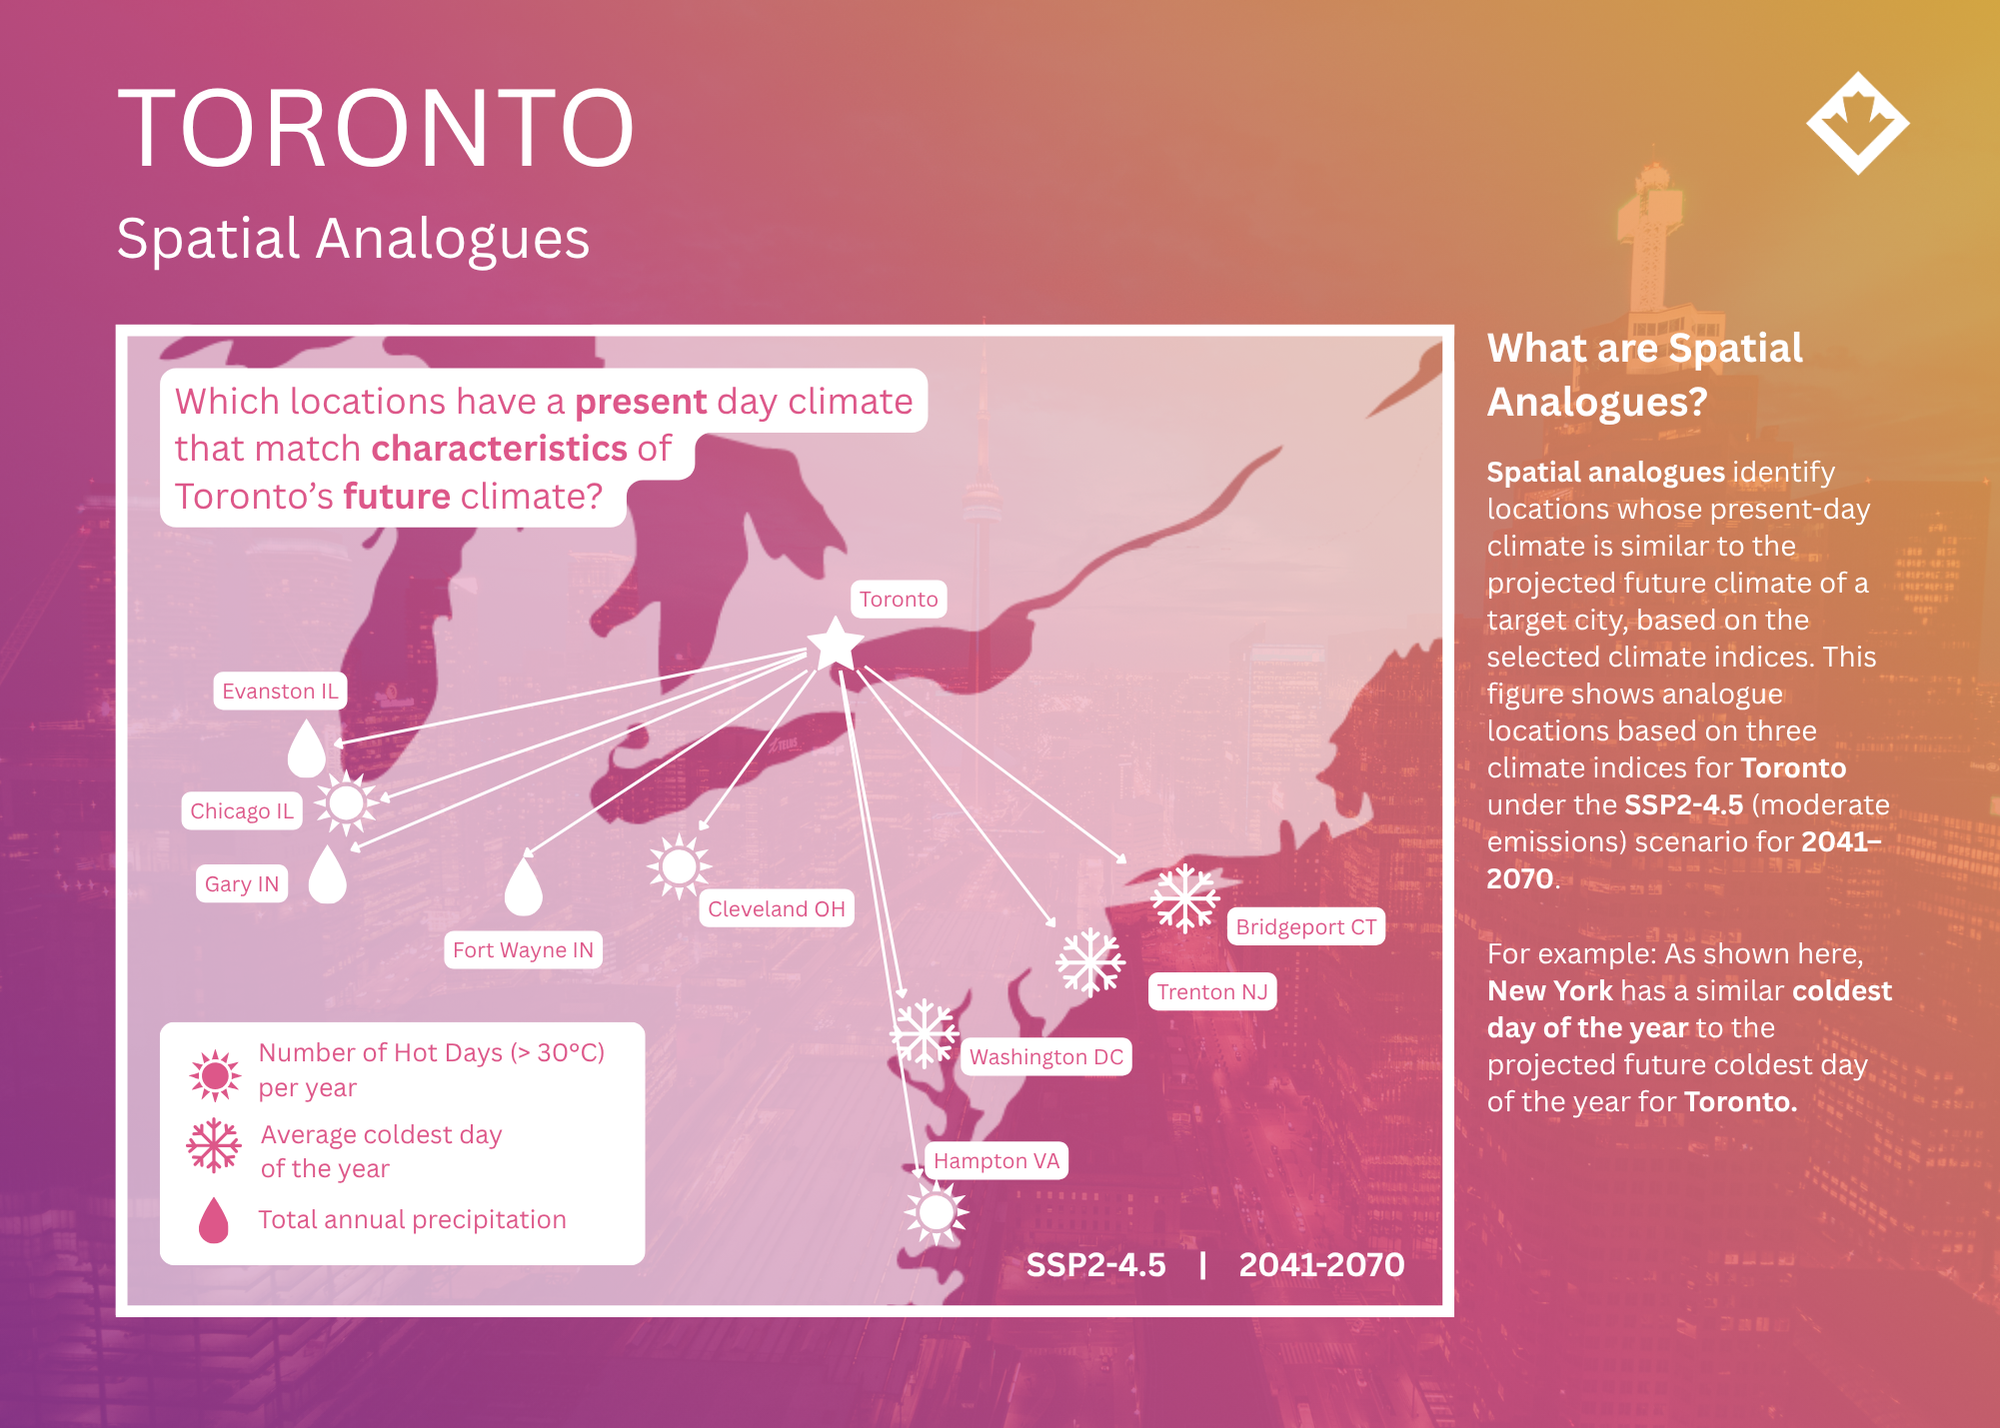
Spatial analogues ask: whose present-day climate resembles Toronto’s projected future climate? The map below identifies locations that provide a good match for one or more of three selected indices (the number of days above 30 °C, the average coldest day of the year, and total annual precipitation) under SSP2-4.5 for 2041–2070. For example, New York’s present-day average coldest day is similar to that projected for Toronto. Other cities provide closer matches for Toronto’s projected heat or precipitation conditions. An analogue does not mean Toronto will become identical to another city; rather, it provides a practical reference point for understanding individual aspects of Toronto’s future climate.

Explore the Spatial Analogues app

Figure 6. Present-day spatial analogues for Toronto’s projected 2041–2070 climate under SSP2-4.5, based on the annual number of hot days above 30 °C, the average coldest day of the year, and total annual precipitation. Analogues are computed using ClimateData.ca’s spatial analogue app. Each analogue may match Toronto more closely for some indices than for others; for example, locations near New York have a similar average coldest day to that projected for Toronto.

Box 1: Smoke and climate change

Wildfire smoke can travel hundreds or even thousands of kilometres, so Toronto’s air quality can be affected by fires occurring far beyond the city. ClimateData.ca does not project future wildfires, smoke concentrations or air quality. However, its Fire Weather Projections app shows how climate conditions that influence the potential for fires to start and spread—including heat, dryness and wind—may change across Canada. Projections of longer fire seasons and more severe fire weather in many regions point to a growing potential for wildfire smoke episodes affecting downwind communities such as Toronto.

IDF data: planning for intense rainfall

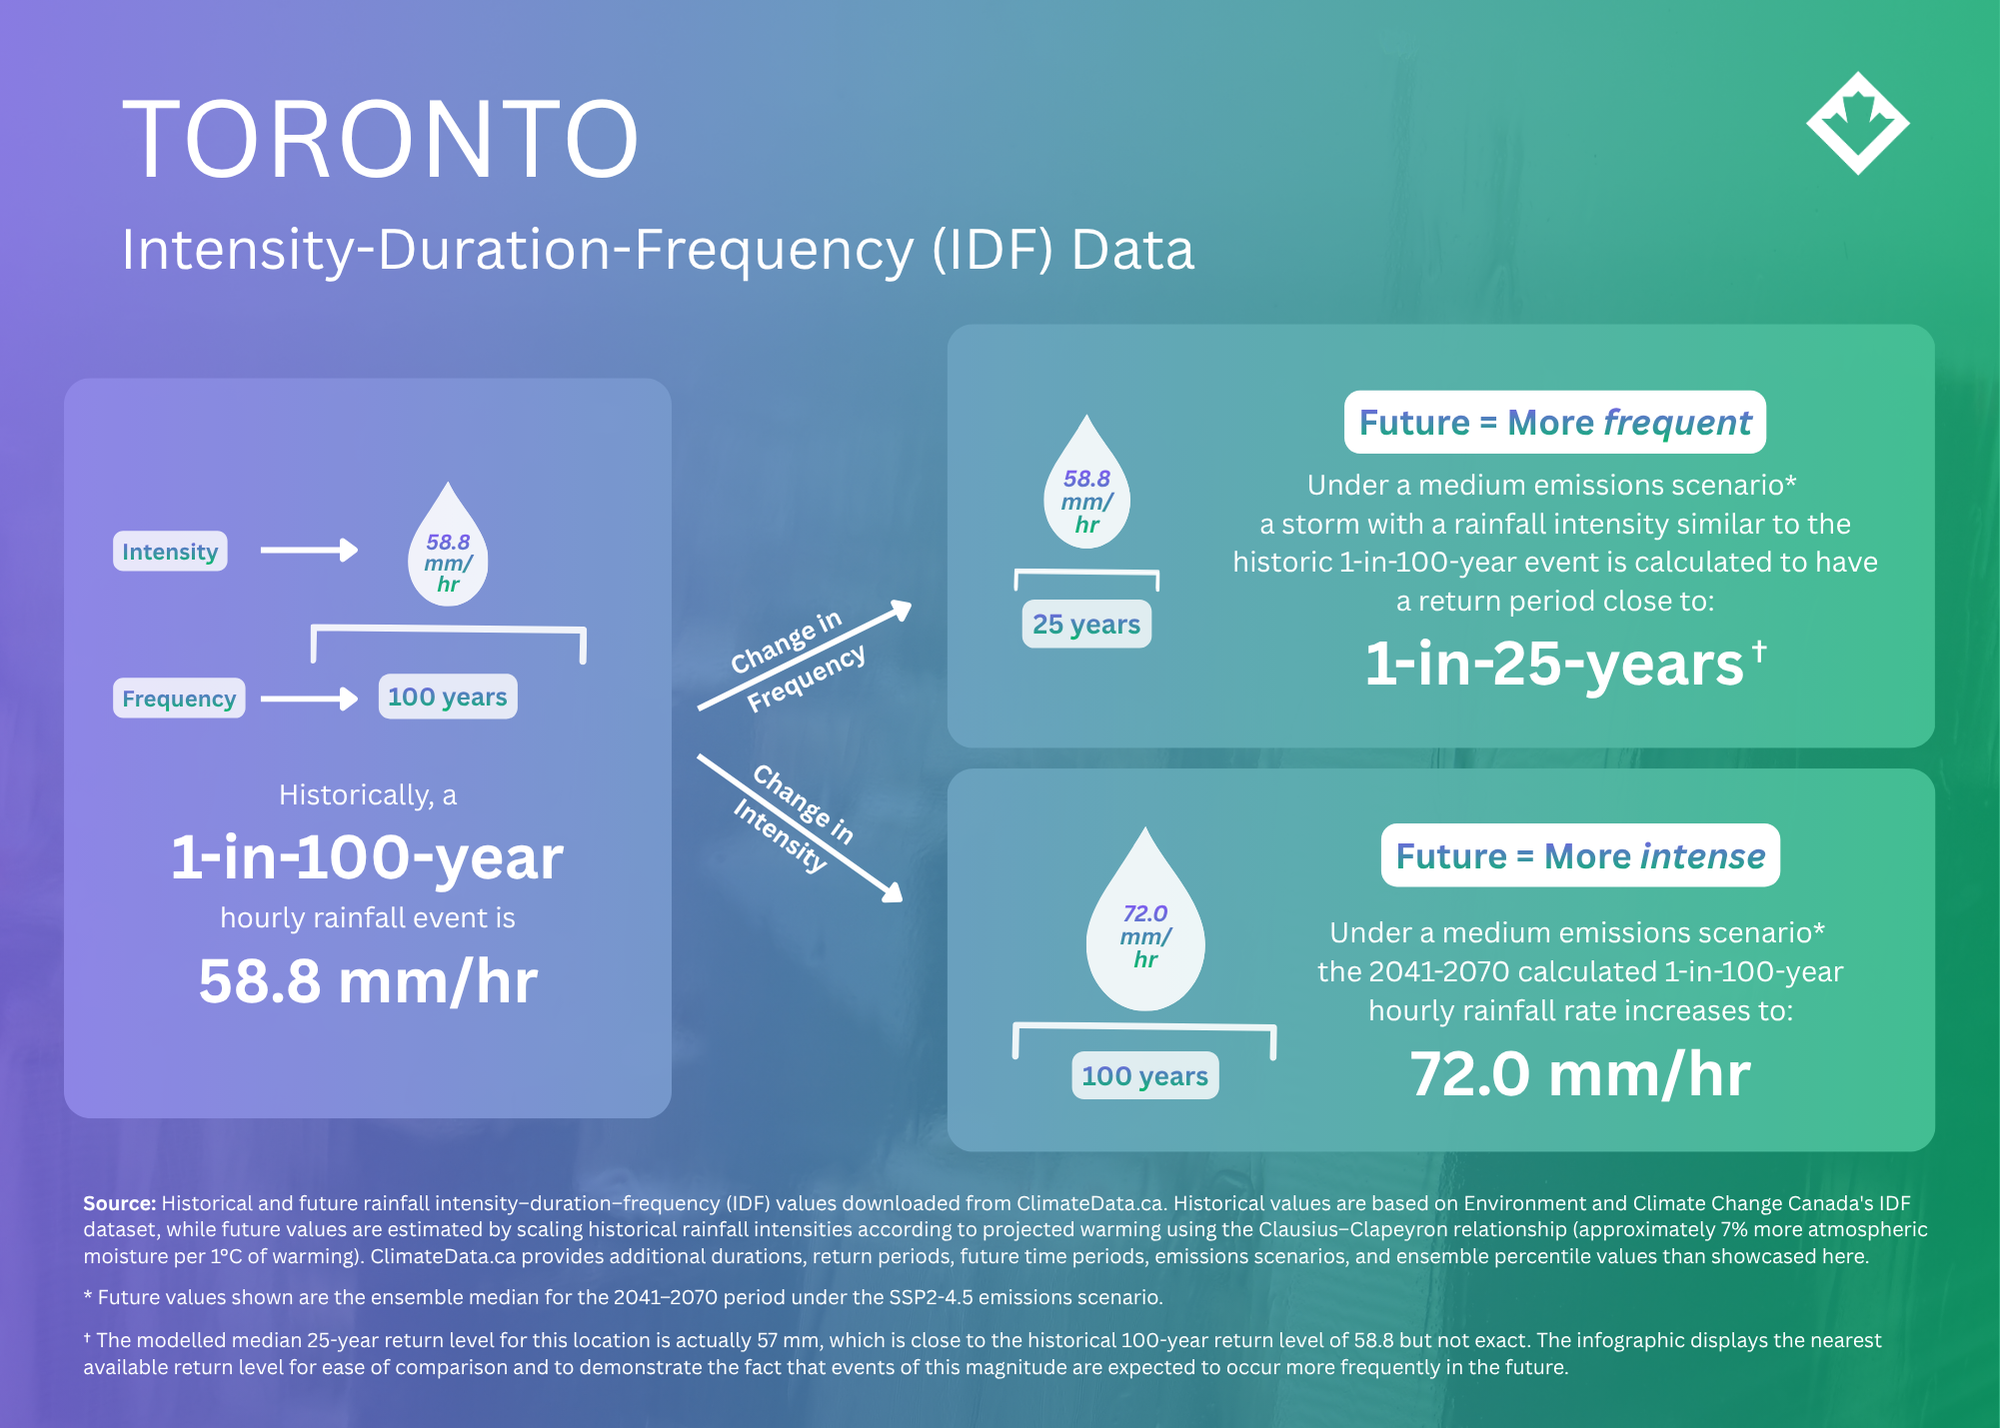
Intensity–Duration–Frequency, or IDF, data describe the likelihood of intense rainfall events. Historical IDF data alone are no longer sufficient for long-lived infrastructure planning and maintenance. Therefore, ClimateData.ca also provides climate change-scaled IDF data for stations across Canada. Users can explore rainfall durations from 5 minutes to 24 hours, return periods from 1-in-2 to 1-in-200-years, multiple future periods, and several emissions scenarios.

Download: IDF rainfall data

About: IDF Curves 101

Learn: IDF data and climate change

Guidance: Best practices for using IDF curves

Figure 7. Historical and climate change-scaled one-hour IDF values for Toronto, downloaded from ClimateData.ca. Historically, the 1-in-100-year hourly rainfall rate is 58.8 mm/h. Under SSP2-4.5 for 2041–2070, a rainfall rate of similar magnitude is associated with a return period closer to 1-in-25-years, while the median 1-in-100-year hourly rainfall rate increases to 72.0 mm/h.

From data to decisions

Different climate datasets help answer different questions: observations describe what has occurred; normals summarize typical conditions; seasonal forecasts support near-term planning; projections describe plausible futures; analogues communicate the geographic scale of change; and IDF data support short-duration rainfall analysis. The datasets described above represent only a sample of the many datasets and variables available on ClimateData.ca.


Guidance and support

Need help selecting and interpreting climate information?

Visit the Learning Zone

Would you like to request a “menu of climate data” for your own community? Contact the Climate Services Support Desk today.

Contact support