Ask a Climate Expert: Deciphering your Data Downloads

Ask a Climate Expert: Deciphering your Data Downloads

Welcome to another post in our “Ask a Climate Expert” series where we address real-life questions that were sent to the Canadian Centre for Climate Services’ Support Desk. Here we are sharing our answers in an easy-to-understand format that is accessible to everyone, not just climate scientists.

Getting comfortable with climate data

As the planet heats up, Canadian professionals across all sectors are factoring climate data into their work. To prepare for climate change, they are considering future changes in climate variables such as precipitation, temperature, and more.

At the Support Desk, we respond to various inquiries from users related to accessing and understanding climate data.  As users familiarize themselves with the data, it’s common to have questions. Today’s post focuses on guiding users through the process of reading the downloadable data files from ClimateData.ca.

What kind of file formats can I download?

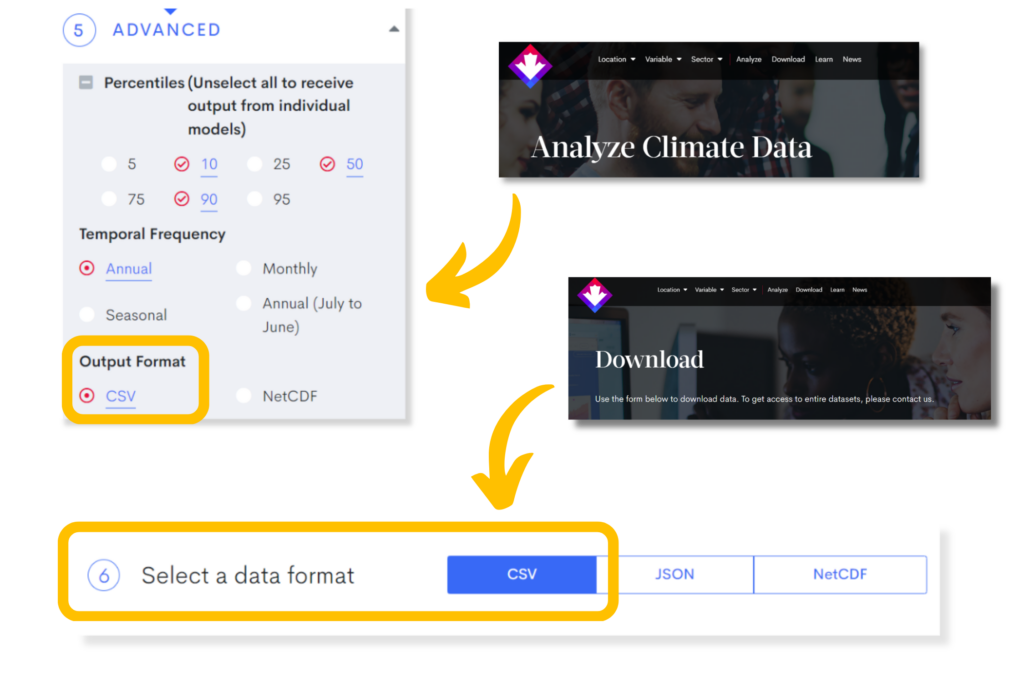
Climate data on ClimateData.ca can be downloaded in several different file formats: CSVs, NetCDFs, JSONs, GeoJSONs, PDFs, and PNGs. Different formats are useful for different applications, and each file type has its own strengths and weaknesses.

In this blog post, we’re going to focus on how to read through the CSV format, since this is the most popular data format on ClimateData.ca. This is also a format that is readily accessible to most people.

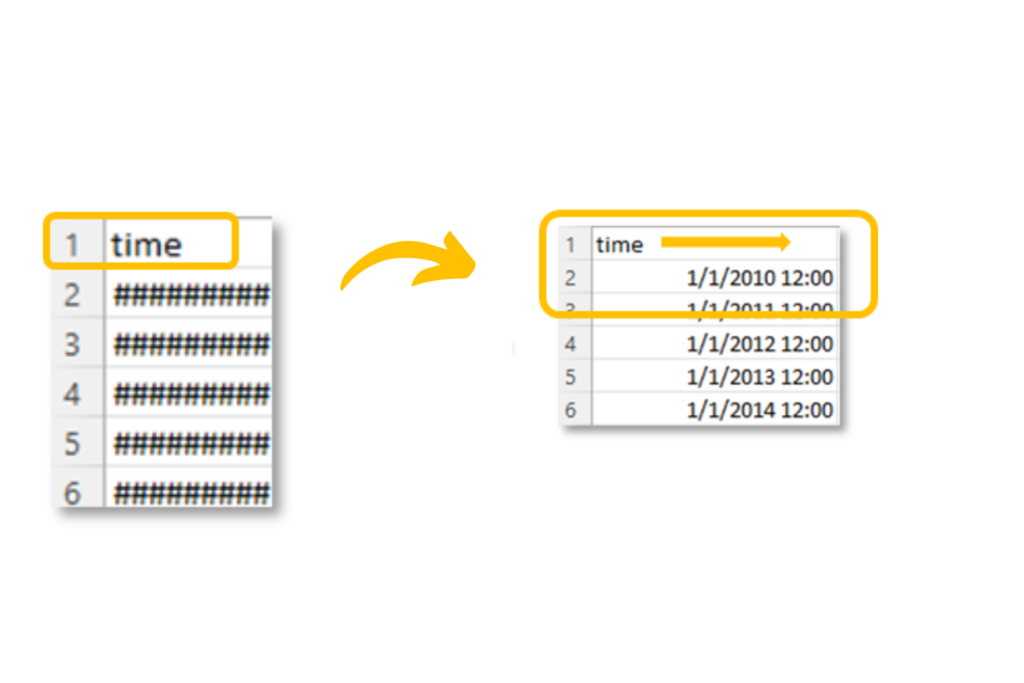
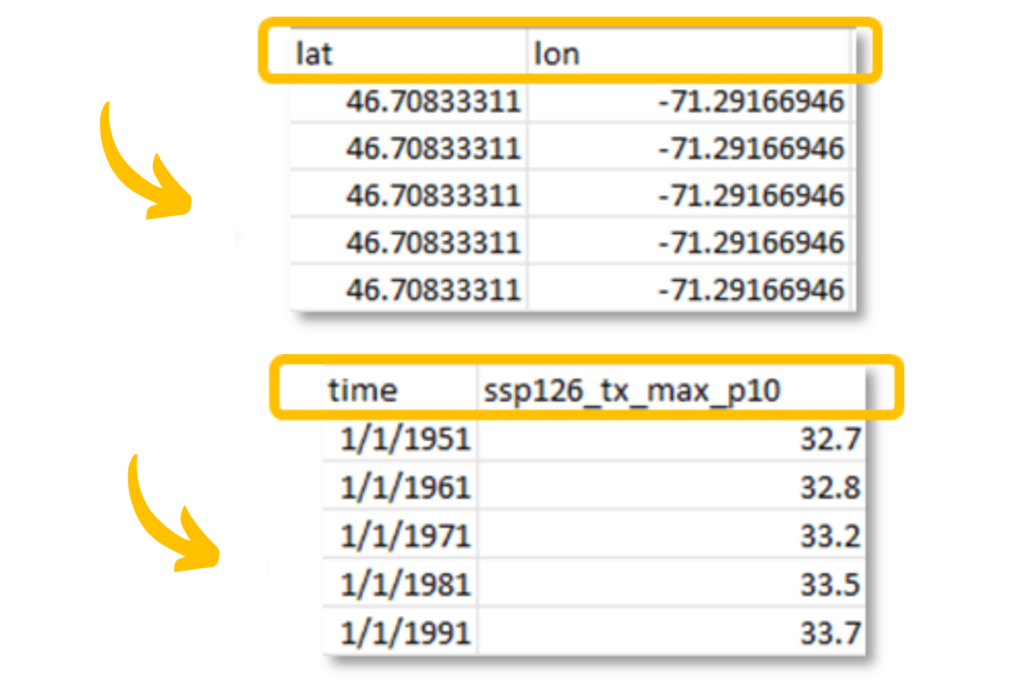
CSV files, which stand for Comma-Separated Values, can be opened with spreadsheet programs like Microsoft Excel or Google Sheets and can also be uploaded into programming environments.

Where can I download data for specific climate variables?

Whether you’re a climate enthusiast, a planner, a researcher, or just curious about Canada’s climate – you can explore the climate variables that are most relevant to you.

Download data for Canada on ClimateData.ca:

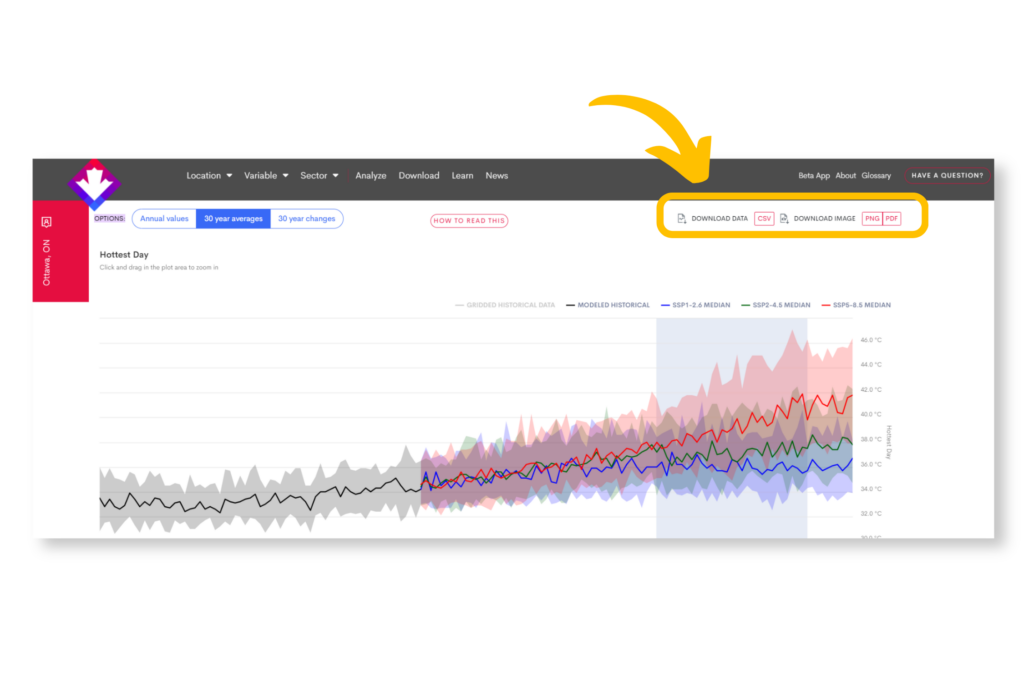
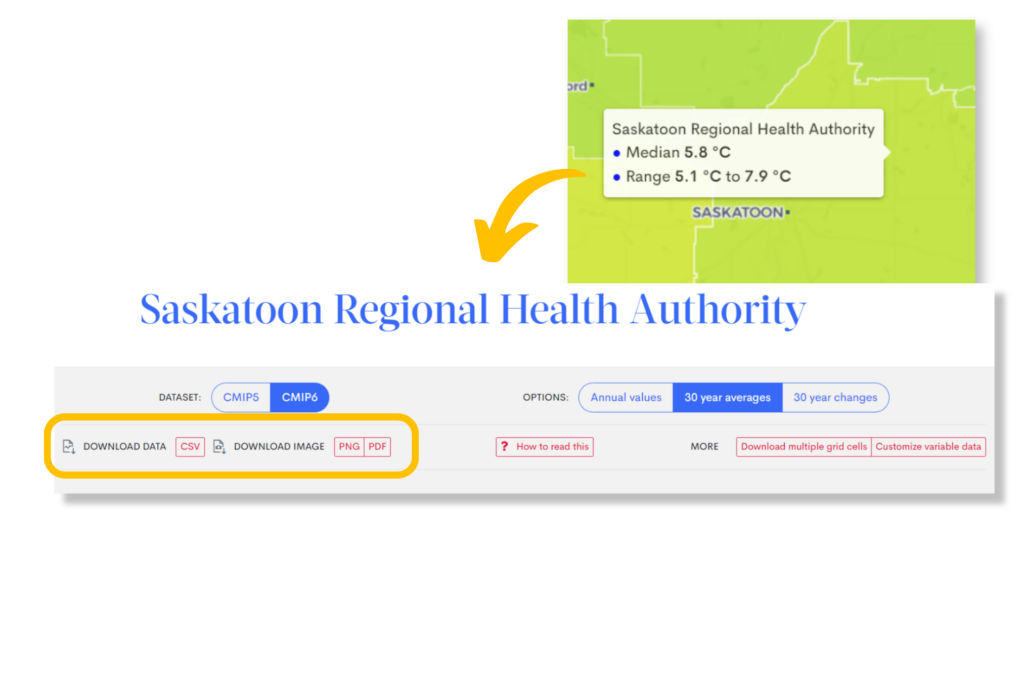
  1. Search by Location: When exploring climate changes for different locations, you can download data by clicking on one of the download options near the top right corner.

2. Search by Variable: When exploring climate variables, you can click on any grid cell or area (watershed, census subdivision, or health region) from the Map/Variable view. A timeseries graph will appear for that location, and download buttons are available near the top left corner.

3. Analyze page: Work through the steps along the left side of the webpage to select your data sets, locations, variables, and timeframes. For Step 5, under “Advanced”, you can select your output format, including an option for a “CSV” spreadsheet.

4. Download page: Step 6 in the data selection is to “Select a data format”. A CSV spreadsheet is the default option.

I’ve downloaded my data – now how do I make sense of this document?

The partner organizations behind ClimateData.ca want users to feel empowered to customize their data and walk away with usable information. Now that you know where to download the data and what kind of files you can produce, let’s take a closer look at what is included in a CSV spreadsheet from our portal.

Using the guide below, learn how to “speak the language” of a climate data download file, with links along the way to learn more.

Deciphering the data you downloaded

1. Date/Time:

The first thing you may notice when you open one of the CSV files in Microsoft Excel is that the “time” column is showing “########”. To see the full dates and times, widen the column a bit until you see the dates appear.

Here’s how to decipher the date:

  • 30-year average data: These files contain 30-year averages from 1951-2071, with the starting year for the 30-year period shown in the “time” column. For example “1/1/1971” represents the 1971-2000 period, and so on until “1/1/2071” which represents 2071-2100.
  • Annual data: For the downloads with all annual data for 1950-2100, you’ll see the years noted in this column, and the month will show as 1, for example “1/1/1957”.
  • Seasonal data: The month in the “time” column will be 12, 3, 6 or 9, depending on the season you downloaded. These data are for the climatological seasons, i.e.,:
    • 12 = Winter: December, January and February (DJF)
    • 3 = Spring: March, April and May (MAM)
    • 6 = Summer: June, July and August (JJA)
    • 9 = Autumn: September, October and November (SON)
  • Monthly data: For the downloads with monthly data for 1950-2100, you’ll see the years and months noted in this column.
  • Daily Data: It is also possible to download daily data on ClimateData.ca for a very limited set of variables (minimum temperature, maximum temperature and total precipitation). These download files are considerably different from the other CSVs, so we are not discussing them here.

For more information on why it’s beneficial to consider 30 years of data when making decisions concerning future climate change, check out the Climate Science 101: Importance of Using 30 Years of Data article.


2. Location:

Next, you may see some “lat” and “lon” columns. These represent the latitudes and longitudes of the grid cell(s) that you have selected.

  • If you selected multiple grid cells, data for these are returned in a single file and the latitude and longitude information will help you differentiate the different grids.
  • If you downloaded the data by watershed, health region or census subdivision, you will get a generically labelled file, such as “Tx_max.csv” with no location information.

To help remember the location for which you downloaded the data, or if you’re downloading data for multiple areas at once, re-label the files to add in location information such as:

  • Location_Tx_max.”


3. Remaining column headers

The rest of the columns follow a predictable format. The generic version of the column header follows a standard naming convention and will look something like this:

  • “EmissionsScenario_VariableShorthand _[delta_1971_2000, if present]_percentile”

In a real-world example of data downloaded from ClimateData.ca, your column headers may look something like these:

  • ssp126_tx_max_p50
  • ssp126_rx1day_p90
  • ssp585_frost_free_season_p10
  • ssp585_tg_mean_delta_1971_2000_p10
  • ssp245_prcptot_delta_1971_2000_p90

The portion starting with “delta” are change values, known as delta values. This section only shows up in the column headers if you’ve chosen to download a file that includes the “30 year change” values that you see on ClimateData.ca.

  • “Delta_1971_2000” notes that the values shown are for a change (or delta) between the 30-year period noted in the “time” column and the 30-year average for 1971-2000, which is the default baseline period that is used by ClimateData.ca.

If you’d like more information on baseline periods, check out this Ask a Climate Expert: Navigating the Intricacies of Baseline Periods blog post.

4. Emissions Scenario

This part of the naming convention tells you which emissions scenario the data is for. It is typically organized in ascending order as shown below:

  • SSP1-2.6/RCP 2.6 – the low emissions scenario
  • SSP2-4.5/RCP 4.5 – the moderate emissions scenario
  • SSP5-8.5/RCP 8.5 – the high emissions scenario

More information on emissions scenarios is available in the ClimateData.ca Learning Zone in the following articles: Emissions Scenarios: RCPs and Understanding Shared Socio-economic Pathways (SSPs)

5. Percentile

The last part of the column header naming convention used on ClimateData.ca refers to the percentiles of the data being shown.

The default options for percentiles shown on ClimateData.ca are the 10th, 50th and 90th percentiles. In the file names, we use the following naming conventions:

  • p10: This represents the 10th percentile value. This is used as a lower bound for the range of values shown on ClimateData.ca, where 10% of the model simulations are less than, or equal to, this value.
  • p50: This represents the 50th percentile value, also known as the median value. This is represented by the bold line in figures shown on ClimateData.ca. This represents the value where half of the model results are below this, and half are above this value.
  • p90: This represents the 90th percentile value. This is used as an upper bound for the range of values shown on ClimateData.ca, where 90% of the model results are less than, or equal to, this value.

For more information on what percentiles are, check out this Learning Zone article on Understanding Multi-Model Ensembles that gives a visual example of how percentiles are calculated.

What if I still have questions?

You don’t have to be an expert in climate science to start using climate data. Get more acquainted with climate data today and let us know where we can help. Remember, we’re here to support you along the journey.

Stay tuned for more posts in our “Ask a Climate Expert” series, where we’ll continue to break down complex climate concepts. Until then, keep the questions coming and happy data downloading!

Have a question? We’re here to help.