Winter Ice Roads in Northern Ontario

Climate change is presenting significant challenges to the operation and maintenance of winter ice roads in northern Canada. Northern communities require data and tools to assess the viability of ice roads into the future. This case study will define and explore one climate index that can contribute to climate risk assessments for northern communities.

Contributing Authors: Elaine Barrow, Nathalie Bleau, Jessie Booker, Taylor Livingston, Lindsay Matthews, Stacey O'Sullivan, Amanda Patt, Kari Tyler.

Summary

Winter ice roads typically operate from January to March, and represent a critical means of access for remote northern communities. Winter ice roads in northern Ontario service 31 remote First Nations communities, who rely on these roads for the economical transport of supplies during the winter months. A warming climate has already affected the length of time that winter roads can remain operational.

Analyzing the accumulation of Freezing Degree Days (FDDs) under different emissions scenarios can provide one indication of the viability and longevity of winter roads into the future. This type of information is important to consider in long-term community planning and decision-making.

Background

Winter ice roads in northern Ontario link 31 remote First Nations communities that are otherwise fly-in only. The winter roads typically operate from January to March, and are essential for the communities they serve as they reduce the cost of goods and services by enabling the ground shipment of heavy and bulky goods in the winter months. First Nations community leaders are already reporting a reduction in the length of time that winter roads are accessible due to warming, and have concerns about the associated higher living costs and quality of life impacts.

“Climate change has dramatically reduced the length of time winter roads are accessible, causing shortages of food, fuel, and medical supplies and increasing the need to fly in supplies. This results in higher living costs and potential decreases in quality of life and health.”

–Isadore Day, Ontario Regional Chief for the Assembly of First Nations

Warming will significantly affect winter road construction, maintenance, and use. Warming trends and associated decreases in the length of winter road seasons will therefore continue to have significant impacts on communities as winter roads are the most economical method for the transport of supplies.

As the warming climate is already having an impact on winter road construction, how long will winter roads be a viable way of accessing the communities they serve?

The challenge in answering that question is to identify the climate change variables and thresholds that are appropriate indicators of the length of operation of these roads. The opening of winter roads depends largely on sufficient ice development before construction, while the timing and operational length of these roads are affected by a variety of other climate factors including air temperature, precipitation, snow, and wind.

Research was conducted to analyze trends in the seasonal timing of opening dates of the James Bay Winter Road as correlated with air temperature.1,2 The analysis found that a minimum of 380 Freezing Degree Days (FDDs) below 0°C (see Box 1) during the period of road preconditioning was a critical factor in a favourable construction period (historically, the preconditioning period is from October 1st to December 31st). However, the preconditioning period may shift into January as the climate warms, and the spring melt period will also start earlier than in the past. The focus of the analysis below is on the shifts in the timing of achieving this 380 FDD threshold during the preconditioning period.

Knowing this threshold value, it is possible to explore scenarios that examine the viability and longevity of winter roads over the coming century. FDD accumulations starting after September 30th (the traditional start of the preconditioning period) were examined for several communities served by winter road corridors (see right: Big Trout Lake, Lansdowne House, Moosonee, Red Lake, and Kapuskasing) to assess trends in historical and projected FDD accumulations. The results of this analysis reveal that the date at which ice road construction can begin will shift through the century.

Box 1: Freezing Degree Days (FDDs) begin to accumulate when the daily mean temperature drops below a certain threshold (commonly 0°C). If a day’s mean temperature is -21°C, for example, it increases the annual FDD value by 21. Days when the mean temperature is 0°C or warmer would not contribute to the annual sum.

High FDD values are associated with relatively cold conditions and likely imply greater snow and ice accumulation. If projections show a decrease in FDDs, then that location is likely to experience shorter or less severe winters.

Results

When assessing trends for FDD accumulations starting on October 1st, the accumulation of 380 FDDs is projected to occur later in the year for all communities under all greenhouse gas emissions scenarios, when compared to historical conditions. For example, using the high emissions scenario (RCP 8.5), starting construction dates for ice roads are projected to occur between three to four weeks later for all five of the communities by the end of the century (Table 1). This analysis is based on the median date at which FDD accumulations reach 380 FDDs from the start of the preconditioning period (October 1st). For Moosonee, Red Lake, and Kapuskasing, the implication of this later freezing period is that construction would not be able to begin until the middle of January. For Big Trout Lake and Lansdowne House, the starting construction dates are projected to move to late December and early January, respectively.


Table 1. Median date at which 380 FDDs (Tmean ≤ 0°C) have accumulated from October 1st for RCP 8.5

By visualizing this information for these locations for all emissions scenarios (Figure 1), it can be seen that under the lower emissions scenarios (RCP 2.6 and 4.5), ice road construction is still projected to be delayed, but to a much lesser extent than under the high emissions scenario (RCP 8.5). See Box 2 for a detailed explanation on comparing the gridded (ANUSPLIN) historical dataset (shown in orange) to the future-projected data shown in Figure 1.

Figure 1. Freezing Degree Day accumulations for five communities

Upper Left: Day of the year when FDD (Tmean ≤ 0°C) accumulations are greater than 380 (starting from October 1st) for Big Trout Lake, Lansdowne House, Moosonee, Red Lake, and Kapuskasing. Different colours refer to different future emissions pathways (RCPs), with heavy lines showing the multi-model median and lighter shading indicating the multi-model range. Observational, gridded historical data (ANUSPLIN) is indicated by the solid orange line, with modelled historical data shown in grey. See Box 2 below for important information on comparing ANUSPLIN data to future-projected data. Lower Right: Location of the communities of Big Trout Lake, Lansdowne House, Moosonee, Red Lake, and Kapuskasing in northern Ontario.

Using the “Degree Days Exceedance Date” variable on the Analyze page (see Box 3 below), you can download data for your region of interest that identifies the date at which the threshold (in this case 380 FDDs) will be met in the winter season. With this analysis tool, you can specify the temperature threshold for degree days (either above or below a temperature threshold), as well as the total threshold of accumulated degree days.

Conclusion

As average winter temperatures continue to warm throughout Canada, the viability of winter ice roads is projected to decrease. Climatic conditions for preconditioning are projected to become less favourable for winter ice roads by the 2050s and into the 2080s for Moosonee and Kapuskasing, as the 380 FDD threshold is not projected to be met until well into January for these communities, which will result in delayed construction and opening dates of the ice road. Climate conditions may also significantly delay the opening of the ice road for Red Lake by the end of the century. However, climate conditions could remain favourable for preconditioning through the end of 2100 for Big Trout Lake and Lansdowne House. This analysis was based on the high emissions scenario (RCP 8.5), but as seen in Figure 1, a delay to the start of the winter road season is projected under the low (RCP 2.6) and moderate (RCP 4.5) emissions scenarios as well, albeit to a lesser extent.

This example only explores climatic conditions for the preconditioning period of ice road construction, but warming will also affect the length of time that the ice road can be maintained. It is projected that spring melt will also occur earlier as the climate warms. Consideration of the shortened access season for winter ice roads is important information for community decision-making, where reliable winter road access is less likely by mid-century. This information can be used to inform long-term strategic planning for communities, including alternate transportation modes in the future.

Key Takeaways

  • Winter ice roads, such as the James Bay Winter Road in northern Ontario, are an essential means of access and ground transportation for remote First Nations communities.
  • Warming due to climate change has already shortened winter road season lengths, driving up costs of living and decreasing quality of life.
  • The number of freezing degree days (FDD) during the road preconditioning period is one critical indicator of winter road viability and longevity over the coming century.
  • By mid-century, climate conditions could significantly shorten the ice road season for several First Nations communities in northern Ontario. This is an important consideration for community decision-making and long-term strategic planning.

Box 2. A Note on ANUSPLIN vs Future-Projected Data in Figure 1

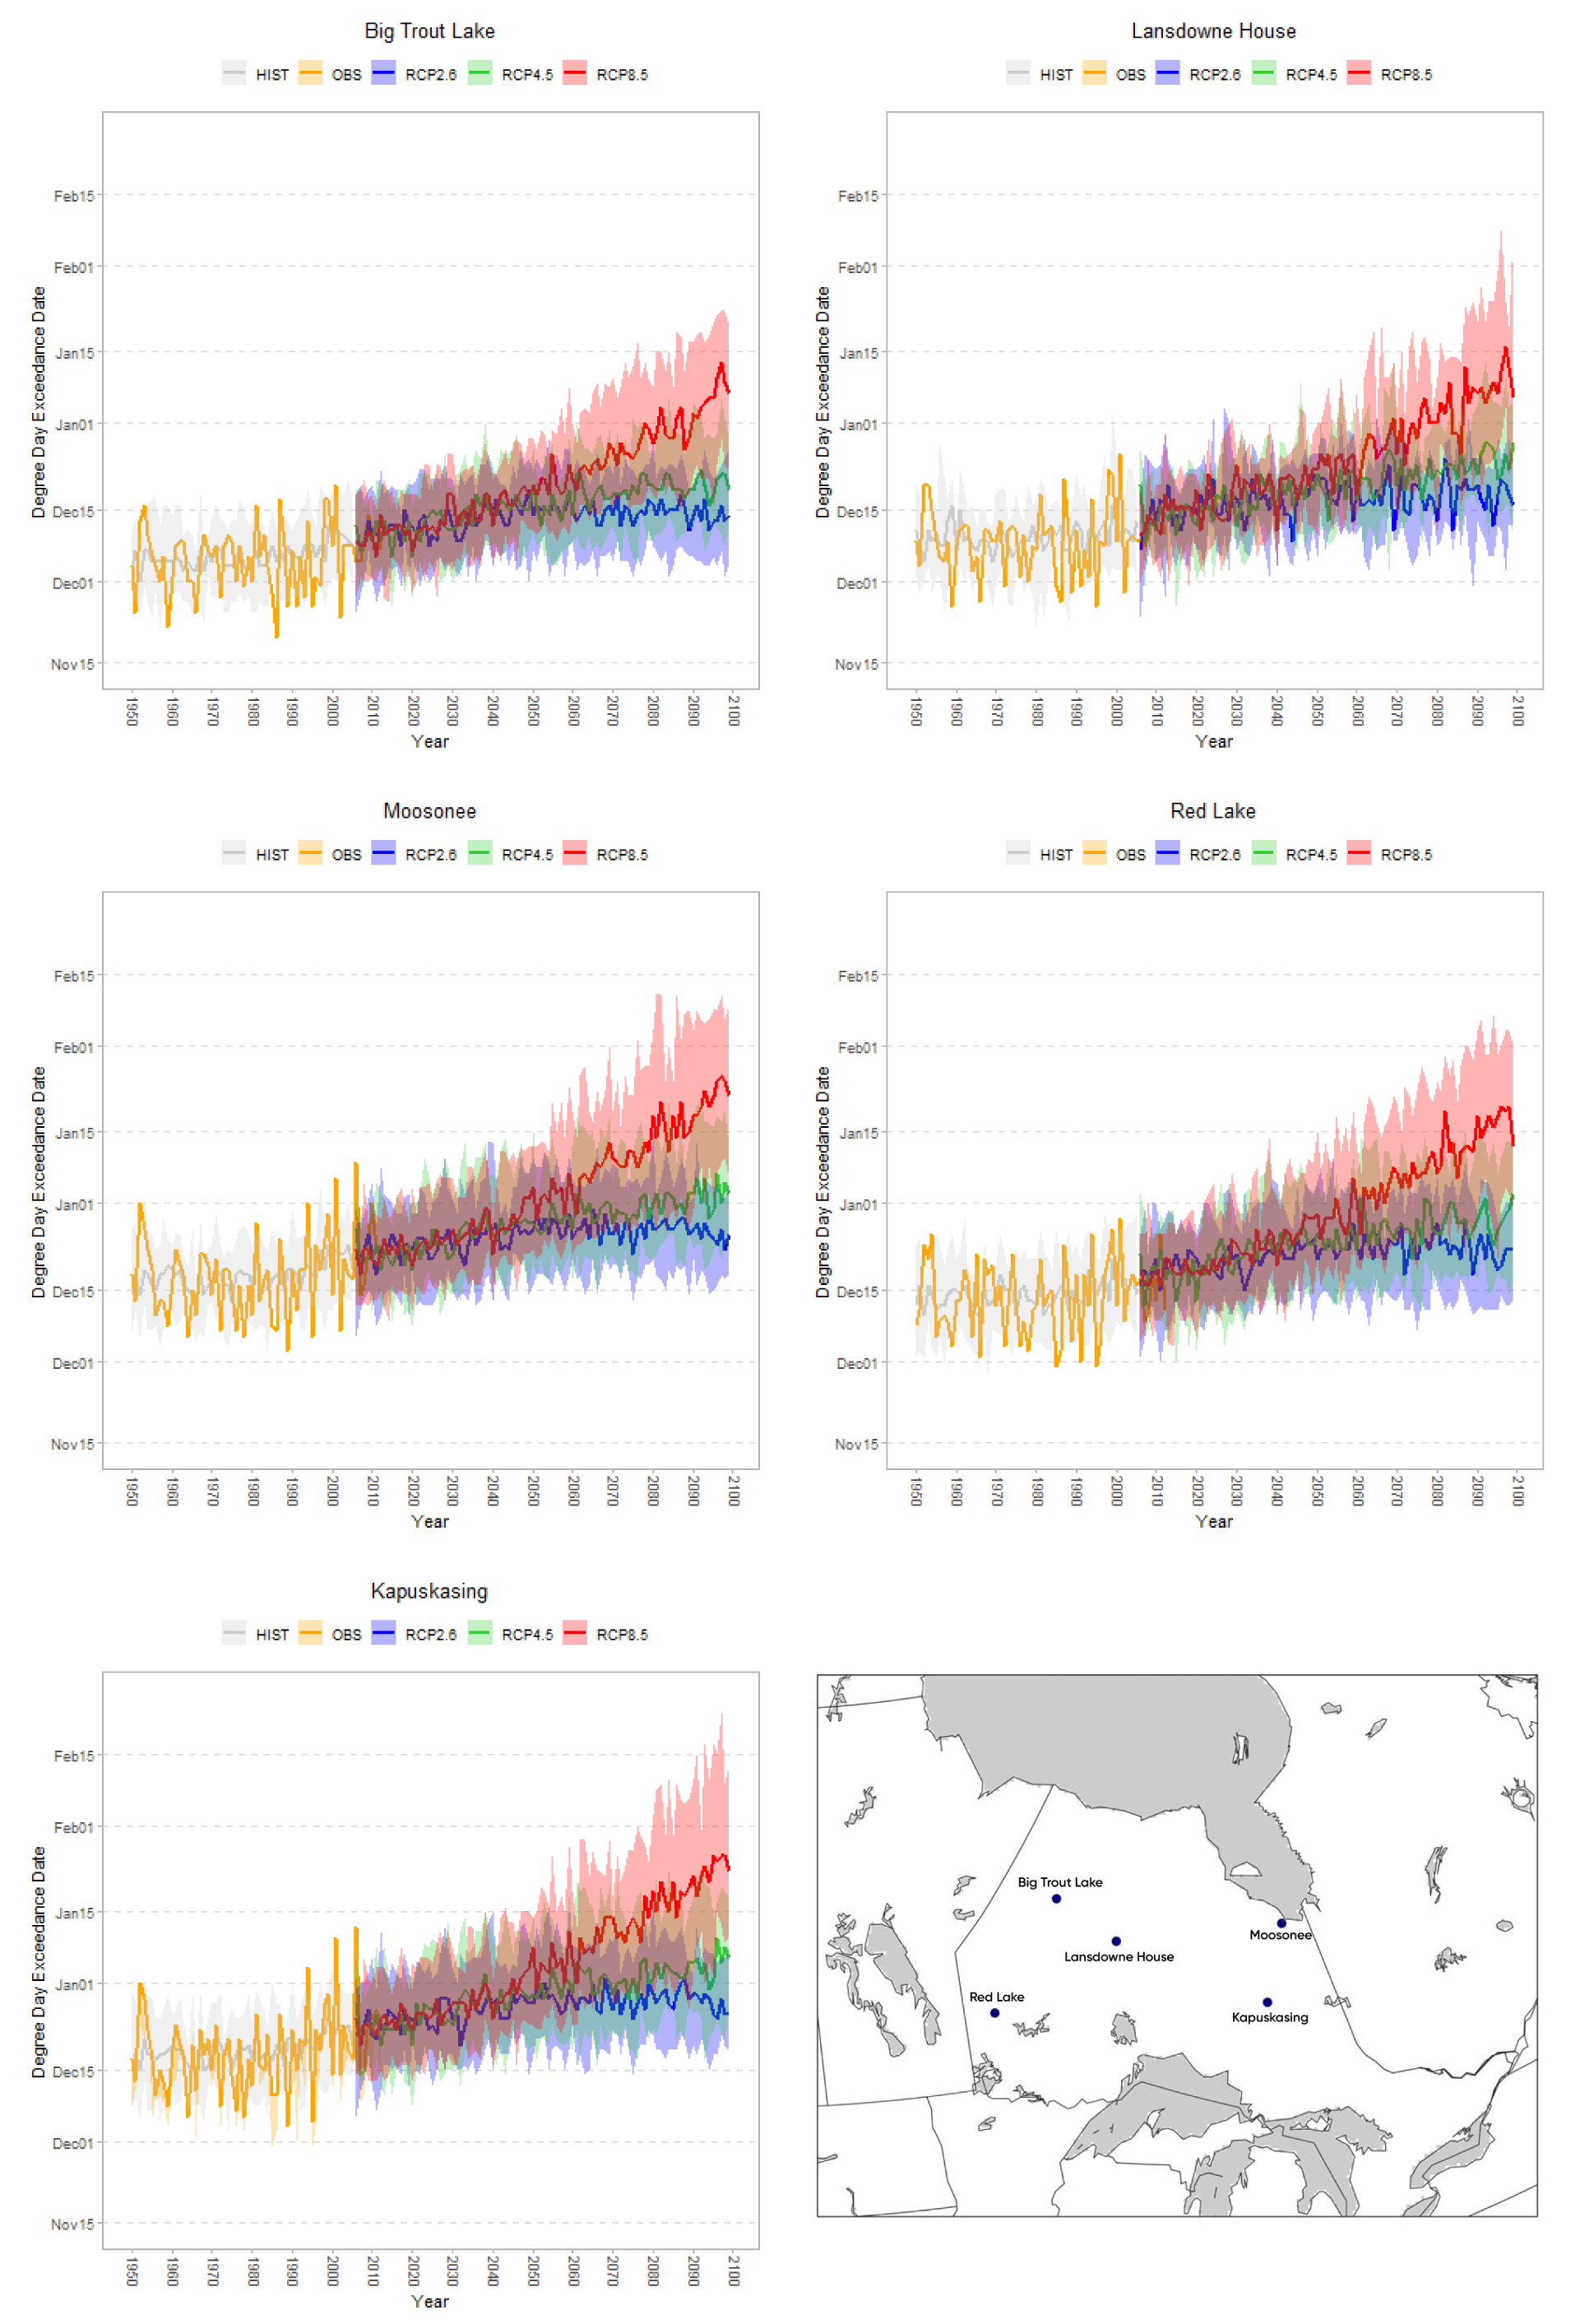
Using the freezing degree day (FDD) accumulation criteria outlined above, there are years in Figure 1 in which the start dates for ice road construction appear to be delayed in the gridded historical (ANUSPLIN) datasets (shown in orange). It also appears that the variability in the timing of reaching the FDD accumulation threshold is increasing in the latter portion of the gridded historical record for several locations, particularly for Kapuskasing and Moosonee. Examination of the climate model simulations, however, shows that comparable conditions are not projected to occur until mid-century and beyond.

There are a number of reasons why there may be differences between model simulations and observed conditions, and it is important to recognise the differences between the two types of data. First, climate models are useful but not perfect; they operate at relatively coarse spatial resolutions and so cannot directly include all climate processes. Our understanding of the climate system is also not complete, and models continue to evolve as our understanding improves. Second, it is not expected that climate simulations will match observed conditions on a day-to-day or even year-to-year basis. Each climate simulation is a single representation of possible climate conditions in response to atmospheric concentrations of greenhouse gases and aerosols – to be able to simulate a climate which perfectly matches observed conditions we would need both a perfect climate model and perfect knowledge of the composition of the atmosphere, neither of which we have. Due to natural variability in the climate system, the observed climate is itself one realisation of many possible climates that could have resulted from the same atmospheric composition.

Additionally, the gridded ANUSPLIN dataset has been interpolated from information observed at point locations. In some regions, particularly Canada’s North, these observations are sparsely distributed, which can affect the robustness of the gridded dataset. What is expected, however, is very similar statistical properties between the climate simulations and the observed conditions over longer time periods (e.g., 30 years), which is the case in the examples shown in Figure 1. Simulations of future climate are used to explore the range of possible future conditions and trends over time rather than to focus on individual climate model results for specific years.

Box 3: Using the Analyze page to examine Freezing Degree Days (FDDs)

Click here to go to the Analyze page. Then:

  1. Choose the BCCAQv2 dataset.
  2. Select “Grids” under Select Locations.
  3. Choose your variable of interest – in this case, “Degree Days Exceedance Date.”
    • Enter the temperature threshold. A commonly used threshold for FDDs is 0°C.
    • Select a location on the map, or use the search bar in the bottom right corner to search for a location. Select the grid cells on the map for your location of interest.
  4. Select a starting year and ending year (a minimum 30 year period is recommended) under Choose a Timeframe.
  5. Under the Advanced section, specify the desired Models, RCPs, Percentiles, Temporal Frequency, and Output Format. Default values are pre-selected.
  6. Enter your email address and submit your request. The data will be processed and sent to you in the format requested.

Acknowledgements

The authors would like to express their sincere gratitude to Dr. Yukari Hori and Dr. William Gough for their invaluable contributions to this case study.

References

This case study was inspired by and relied upon the following original research:

  1. Hori, Y., Gough, W. A., Butler, K., & Tsuji, L. J. (2017). Trends in the seasonal length and opening dates of a winter road in the western James Bay region, Ontario, Canada. Theoretical and Applied Climatology, 129(3): 1309-1320
  2. Hori, Y., Cheng, V. Y., Gough, W. A., Jien, J. Y., & Tsuji, L. J. (2018). Implications of projected climate change on winter road systems in Ontario’s Far North, Canada. Climatic Change, 148(1): 109-122